International Baccalaureate · PYP 3
Data Handling
I
What We Count: Groups or Quantities
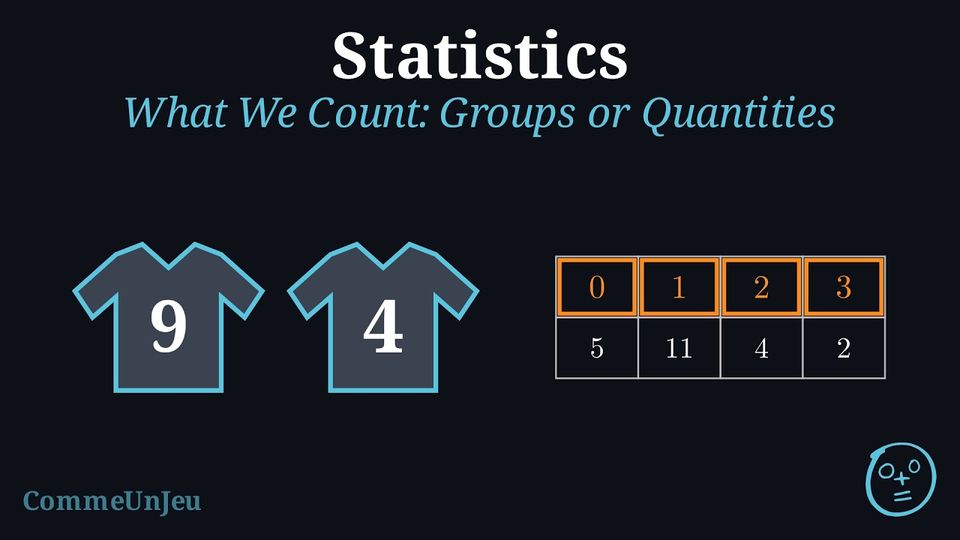
Léa asks her class two questions: “How do you come to school?” and “How many brothers and sisters do you have?” She writes the answers in two tables. The first table:
The second table:
Do the two tables work the same way?
| On foot | By bike | By car | By bus |
| \(9\) | \(6\) | \(4\) | \(3\) |
| \(0\) | \(1\) | \(2\) | \(3\) |
| \(5\) | \(11\) | \(4\) | \(2\) |
Both count how many children gave each answer, so both fill a table the same way. But the answers themselves are not of the same kind. “On foot”, “by bus” name groups: one is not bigger than another, and they can be written in any order. “\(0\)”, “\(1\)”, “\(2\)” are quantities: they have an order, and the table follows it.
Definition — Qualitative and Quantitative Data
When we survey a class, the answers we collect are our data. They are of two kinds: - Qualitative data name a group — the way you come to school, the colour of your eyes, your favourite fruit.
- Quantitative data (also called numerical data) say how many — the number of brothers and sisters, the age in whole years. Here those quantities are always counted, one by one.
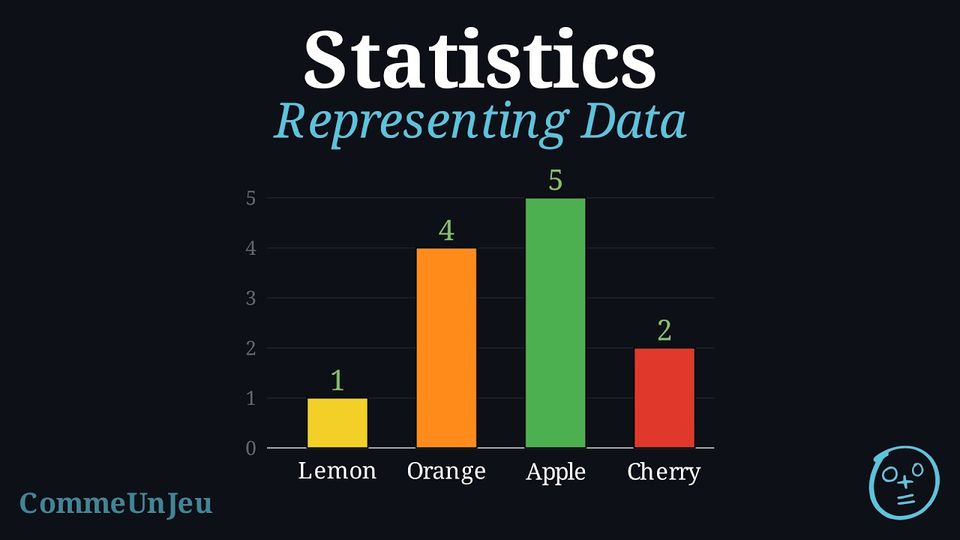
Both are counted and put in a table in the same way. The difference shows on the graph: for a quantity, the bars follow the natural order of the numbers; for a group, the order of the bars is free — often from the tallest to the shortest.
Example — Group or Quantity?
For each question, say whether the answers are qualitative or quantitative data: (a) the colour of the school bag; (b) the number of pets at home; (c) the number on the front of the football shirt; (d) the age in whole years.
(a) Qualitative: red and blue name groups, neither is bigger. (b) Quantitative: \(0\), \(1\), \(2\)… are counted one by one and can be ordered. (c) Qualitative, even though it is written with a number: the shirt number \(9\) is not “more” than the shirt number \(4\), it only names a player. (d) Quantitative: ages can be ordered.
Skills to practice
- Telling a Group from a Quantity
II
Scaled Pictographs, Line Plots and Scales
Method — Reading a Scaled Pictograph
When there is a lot of data, one picture can stand for more than one item. A small key (or legend) tells us how many items each picture represents. To read the graph: - Read the key to find the value of one full picture.
- Count the full pictures in a row and add their values.
- A half picture represents half of the key value; add it on.
Example
The pictograph shows how many stickers four children earned. 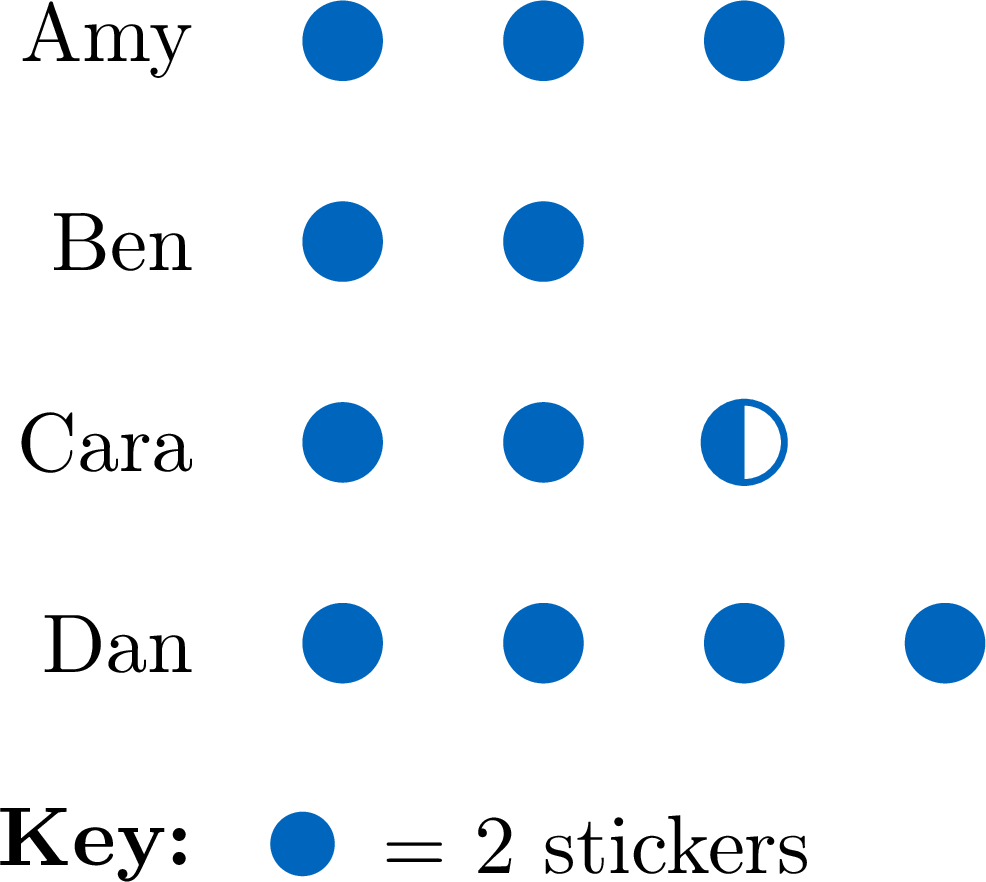
- Amy has 3 full pictures: \(3 \times 2 = \mathbf{6}\) stickers.
- Cara has 2 full pictures and a half: \(2 \times 2 + 1 = \mathbf{5}\) stickers.
- Dan has the most, with \(4 \times 2 = \mathbf{8}\) stickers.
Definition — Line Plot
A line plot (also called a dot plot) shows numerical data using marks above a number line. Each data value is shown by one dot placed above its number; dots for the same value are stacked. A line plot shows at a glance which values are most common and how the data is spread. Example
A team recorded the number of goals it scored in each of its 10 games: \(2, 3, 1, 3, 2, 4, 3, 5, 2, 3\). We show the data on a line plot. 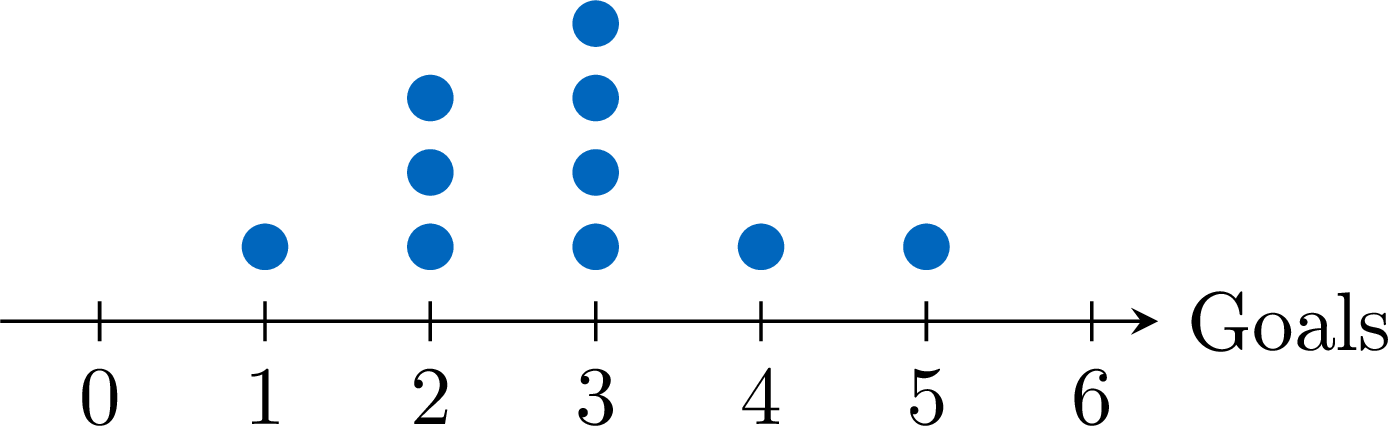
- The most common score is 3 goals (it has the tallest stack: 4 dots).
- The team scored in every game, from a low of 1 to a high of 5.
Method — Choosing the Scale and Drawing the Bars
Building a bar chart is already known: the two axes, the names under the bars, one bar at a time, and the axis numbered one by one. That numbering works while the counts stay small. With bigger counts it does not, and the axis must be numbered otherwise: drawing then means choosing the scale first. - Look at the biggest count: it decides how high the axis must go.
- Choose a simple step — \(1\), \(2\), \(5\), \(10\), \(20\) — so that the axis holds roughly five to ten marks. It is a guide, not a rule: with counts under ten, a step of \(1\) is suitable.
- Graduate from zero, evenly: equal gaps for equal steps, or the heights lie.
- Draw each bar: find its count on the scale and go up to that height. A count between two marks stops between them: share that gap into as many equal parts as the step — \(18\) with a step of \(5\) stops three parts above \(15\), a little below \(20\).
- Finish: bars of the same width, separated by a gap, the names underneath, and a title.
Example — Choosing a Scale
The school canteen counted the desserts chosen on Monday: fruit \(18\), yoghurt \(24\), cake \(12\), ice cream \(6\). Choose a scale for these counts. Here is the chart once drawn: 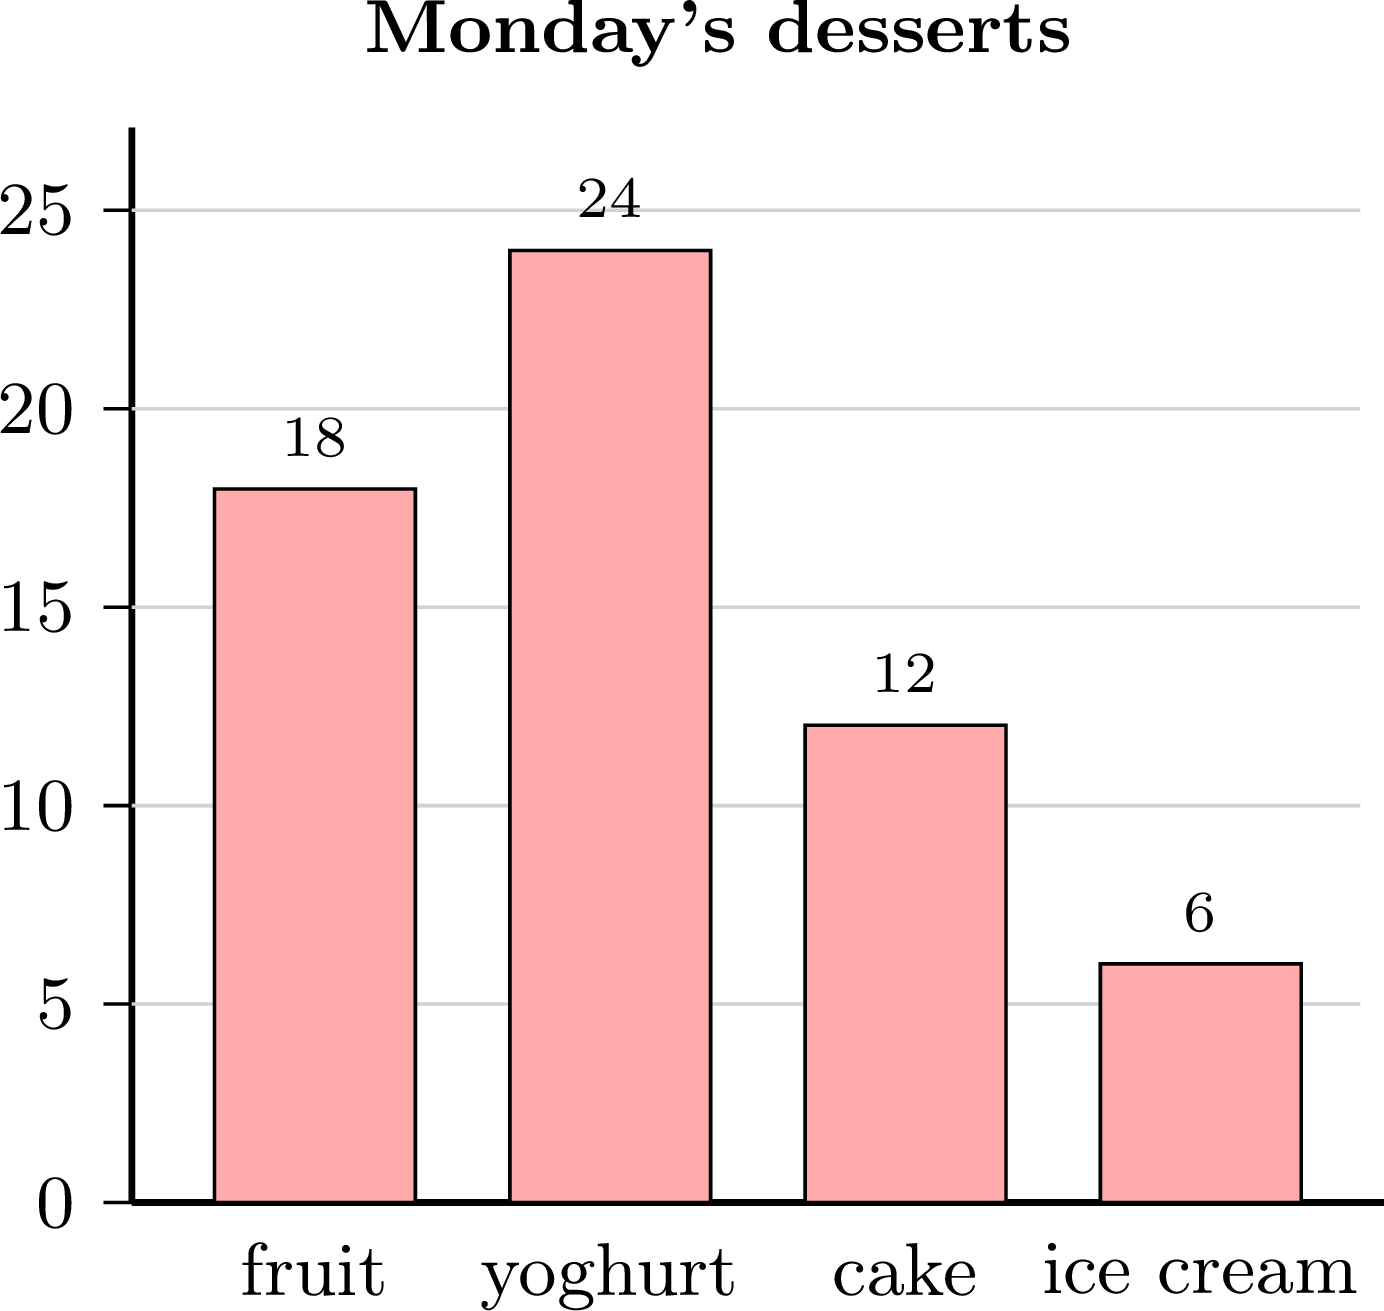
The biggest count is \(24\). A step of \(5\) takes the axis to \(25\) in five marks: a good choice. A step of \(1\) would need \(24\) marks; a step of \(10\) only three, and then \(18\), \(24\), \(12\) and \(6\) would all fall between two marks, harder to draw and to read. The bar for the fruit, \(18\), stops three parts above \(15\); the one for the ice cream, \(6\), just above \(5\). These are qualitative data: the order of the bars is free.
Skills to practice
- Choosing the Scale
- Reading Pictographs, Line Plots and Bar Charts
III
Sorting with Two Questions
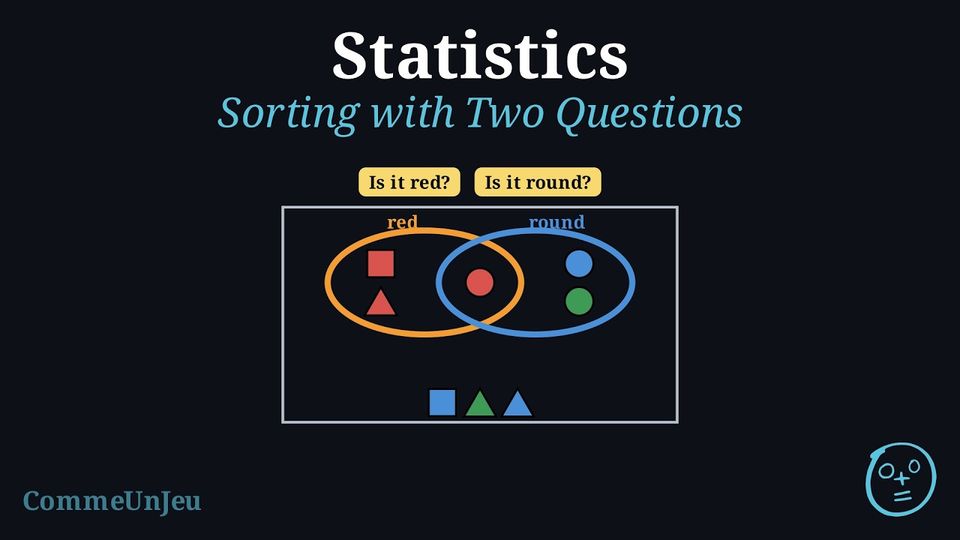
Lina asks two questions about each of her shapes: “Is it red?” and “Is it round?”. 
With one question, a sorting diagram makes two groups. How can one diagram show the answers to both questions?
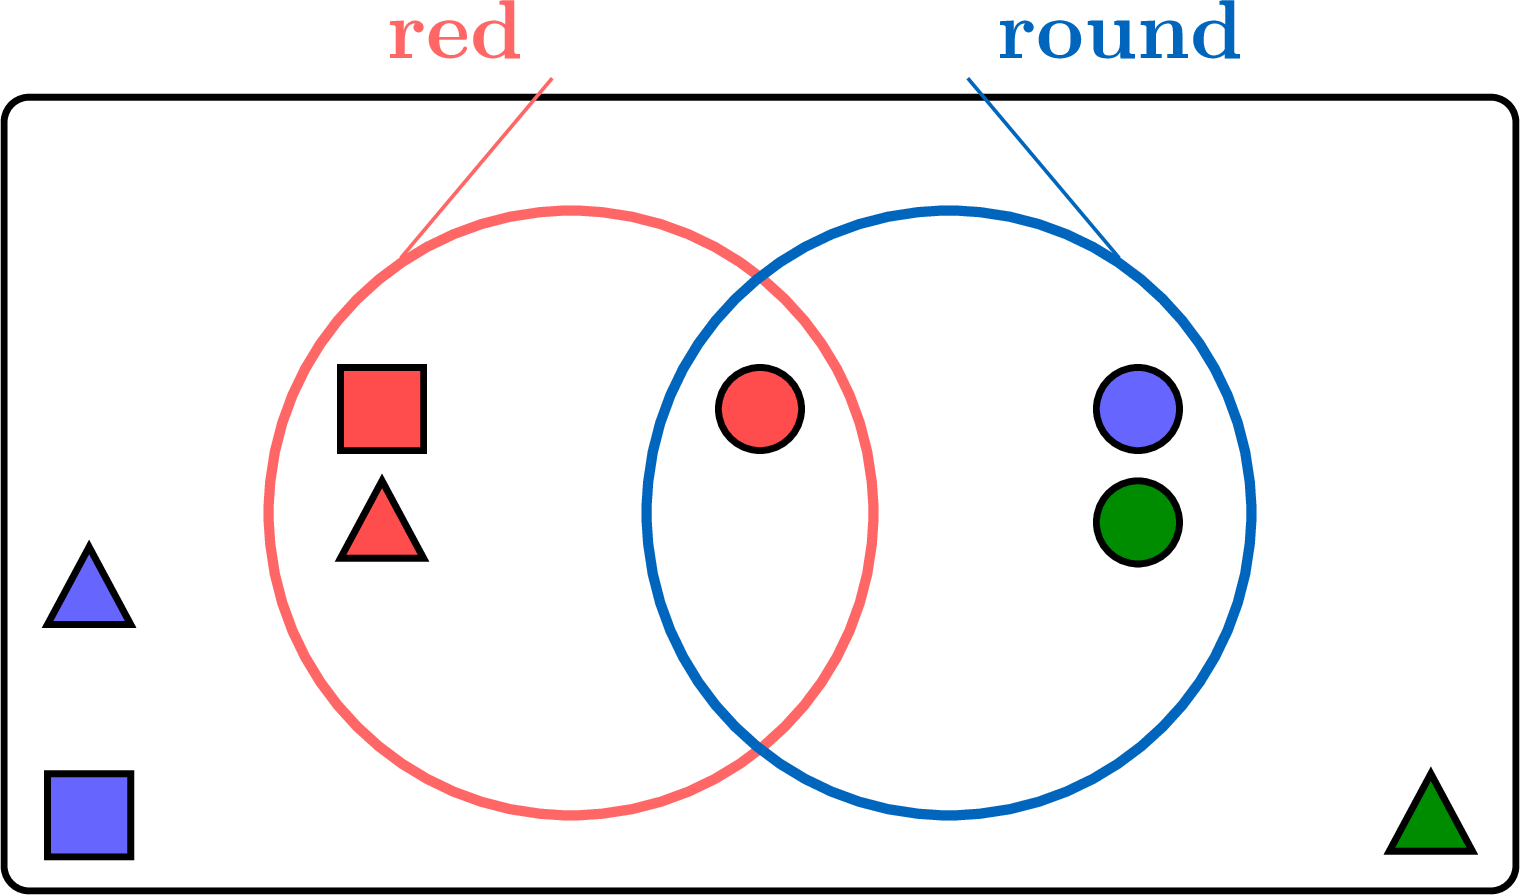
Each shape gives two answers, so there are four kinds of shapes:
- red and round: the red circle;
- red but not round: the red square and the red triangle;
- round but not red: the blue circle and the green circle;
- neither red nor round: the blue square, the green triangle and the blue triangle.
Definition — Carroll Diagram for Two Questions
A Carroll diagram for two questions is a table of \(4\) boxes: \(2\) columns and \(2\) rows of boxes, with their names written above the columns and beside the rows. The columns answer the first question (has the property, has not); the rows answer the second question (has the property, has not). Each object goes in the one box where its two answers meet. 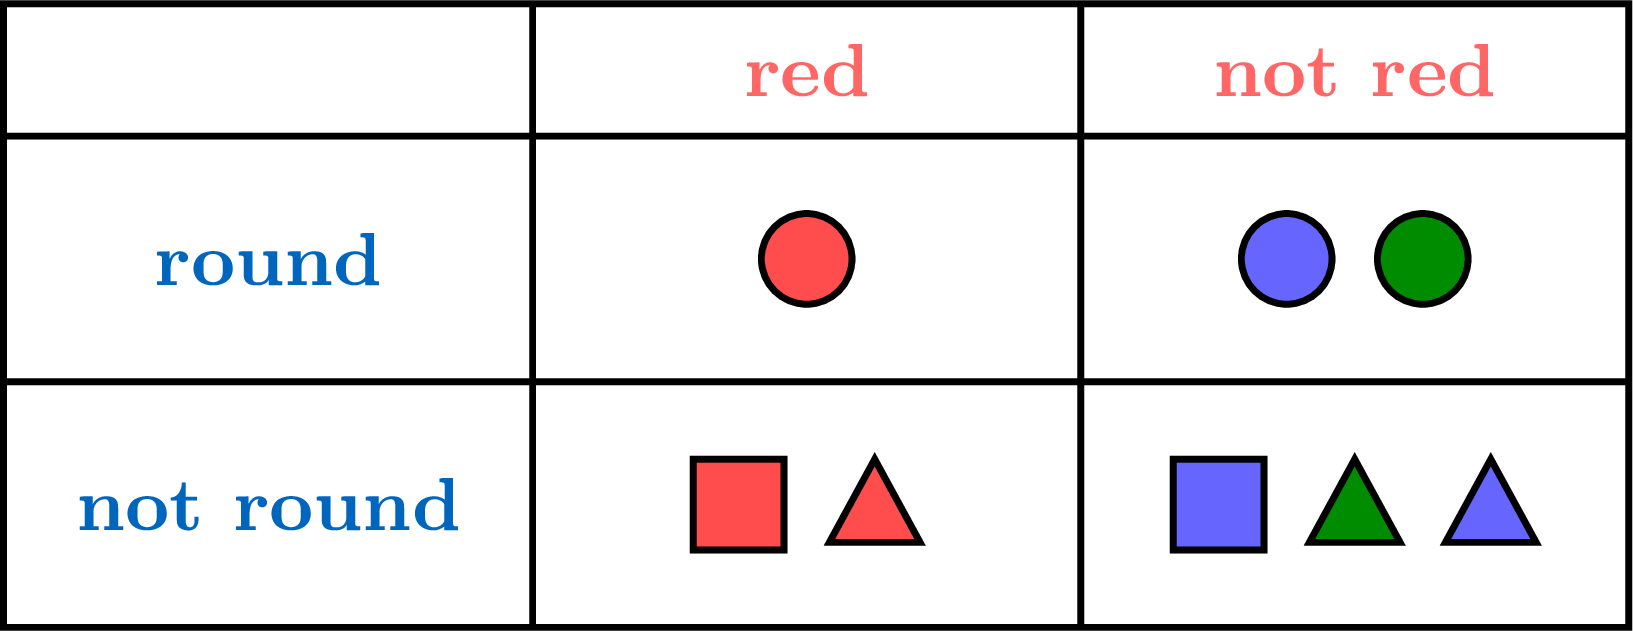
Definition — Venn Diagram with Two Loops
A Venn diagram with two loops has one loop for each question, and the two loops overlap inside the frame. It has four parts: - the overlap, inside both loops: the objects that answer yes to both questions;
- inside the first loop only: yes to the first question, no to the second;
- inside the second loop only: no to the first question, yes to the second;
- outside both loops, in the frame: the objects that answer no to both questions.
Method — Placing an Object with Two Questions
- Ask the first question, then the second: each object gets two answers.
- Find its place from the two answers:
- yes and yes: the overlap, or the box where both properties meet;
- yes and no: inside the first loop only, or the box “first property, not the second”;
- no and yes: inside the second loop only, or the box “second property, not the first”;
- no and no: outside both loops, or the box of neither property.
- Check: every object is placed once, and the four groups together hold all the objects.
Example
Sort the numbers \(10\), \(15\), \(4\), \(20\), \(7\), \(25\), \(12\), \(30\), \(9\) and \(6\) with the two questions “Is it even?” and “Is it in the 5 times table?”. Show the sort in a Venn diagram with two loops, then in a Carroll diagram.
We ask the two questions about each number. 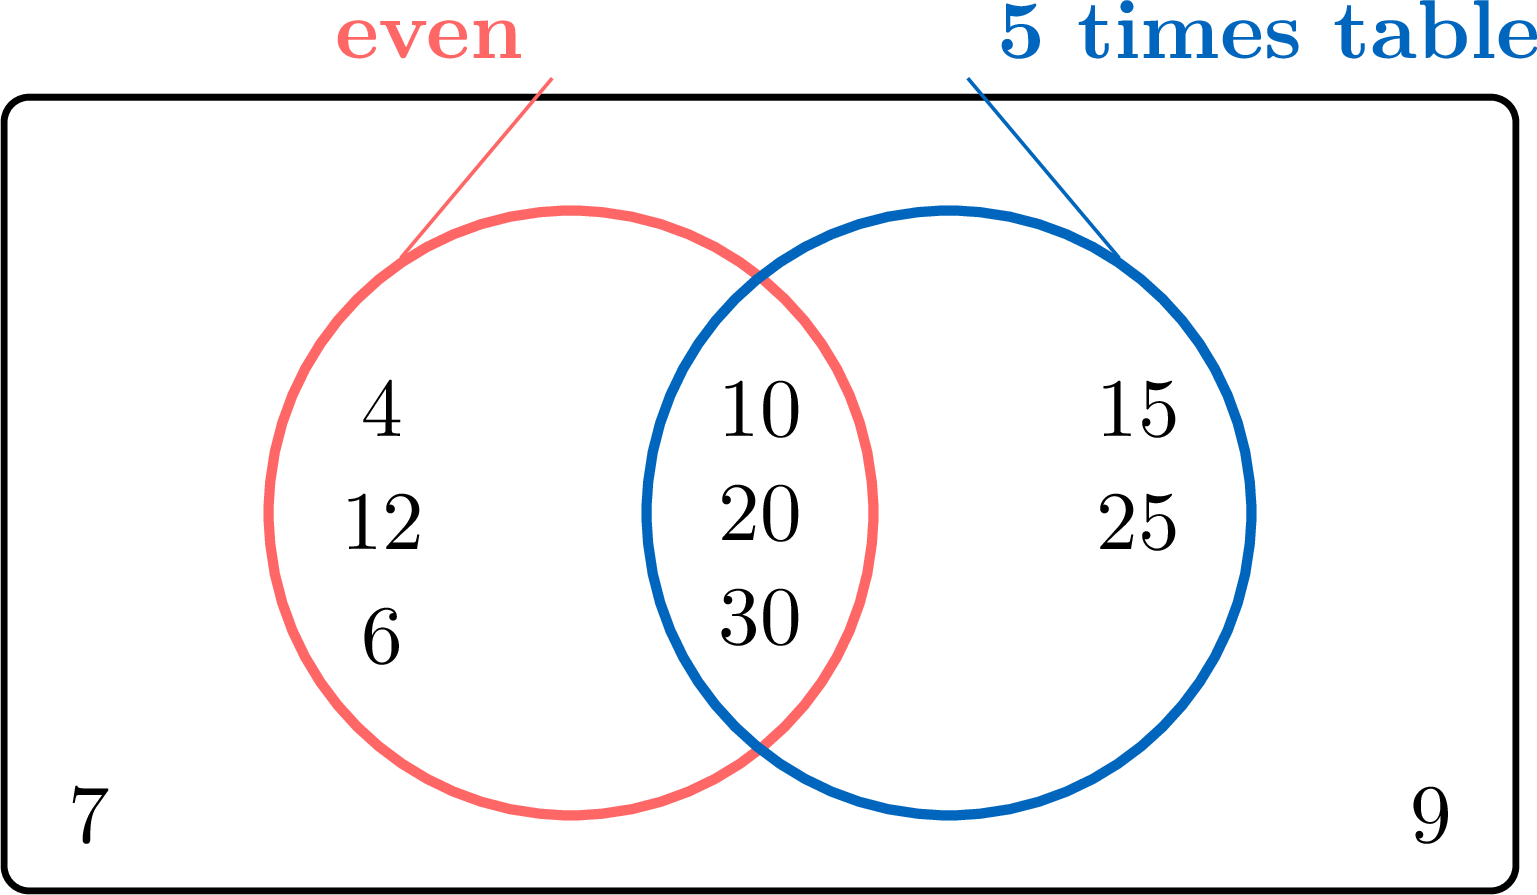
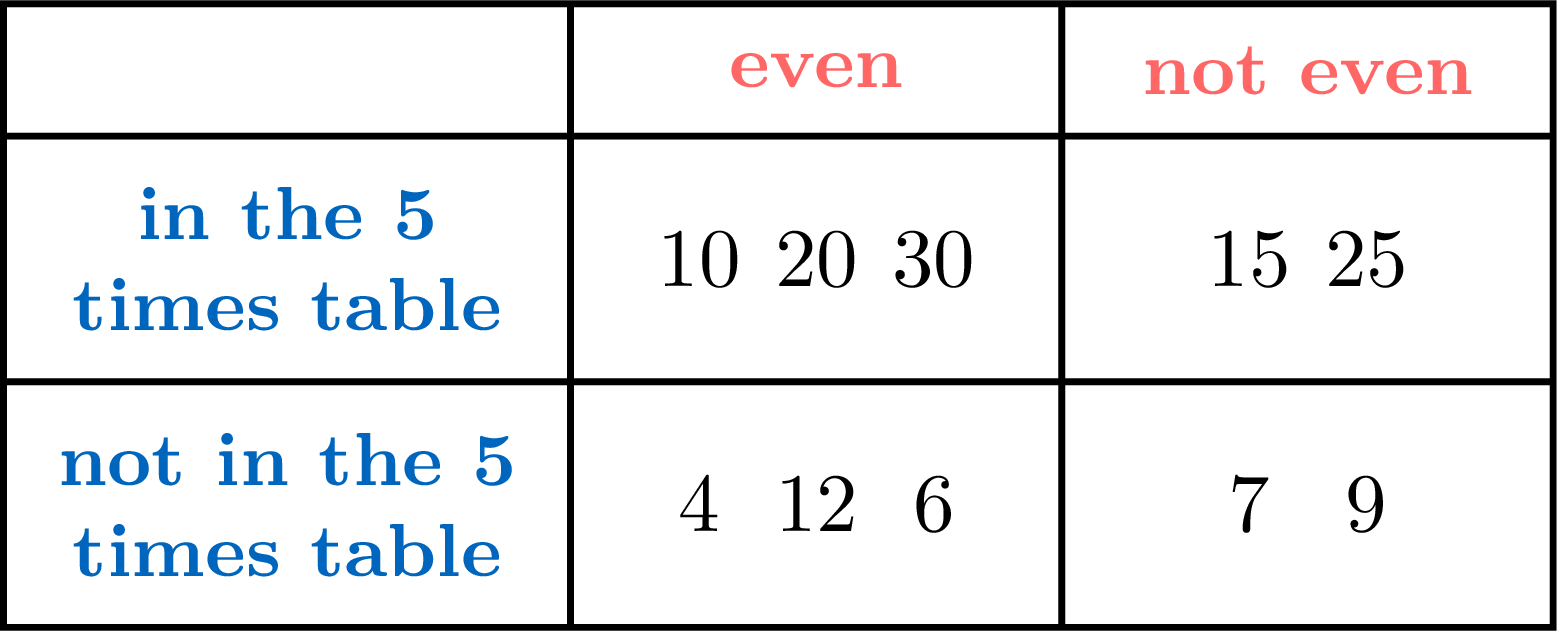
Check: \(3 + 3 + 2 + 2 = 10\) numbers, each placed once. The same four groups appear in both diagrams.
- Even and in the 5 times table: \(10\), \(20\), \(30\).
- Even but not in the 5 times table: \(4\), \(12\), \(6\).
- In the 5 times table but not even: \(15\), \(25\).
- Neither: \(7\), \(9\).
Skills to practice
- Finding Where an Object Goes
- Reading a Two-Question Diagram
- Completing a Two-Question Diagram
IV
Two-Way Tables
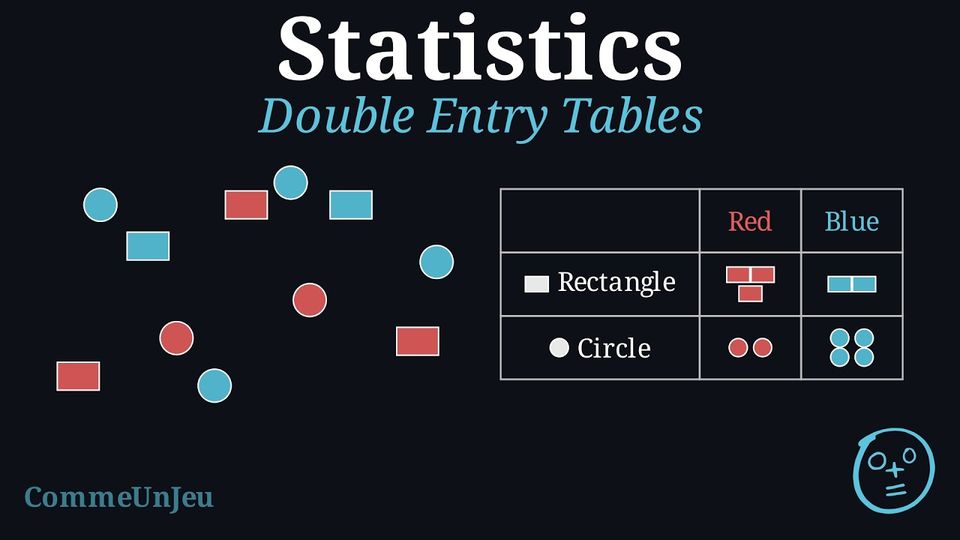
Sometimes, we want to count things using two rules at the same time. We use a special grid called a two-way table (also called a double-entry table). A Carroll diagram for two questions already does this with objects: write the number of objects in each box and it becomes a two-way table.
Definition — Two-Way Table
A two-way table is a chart that organises data into rows and columns. - The columns (vertical) represent one category (like Colour).
- The rows (horizontal) represent another category (like Shape).
Example
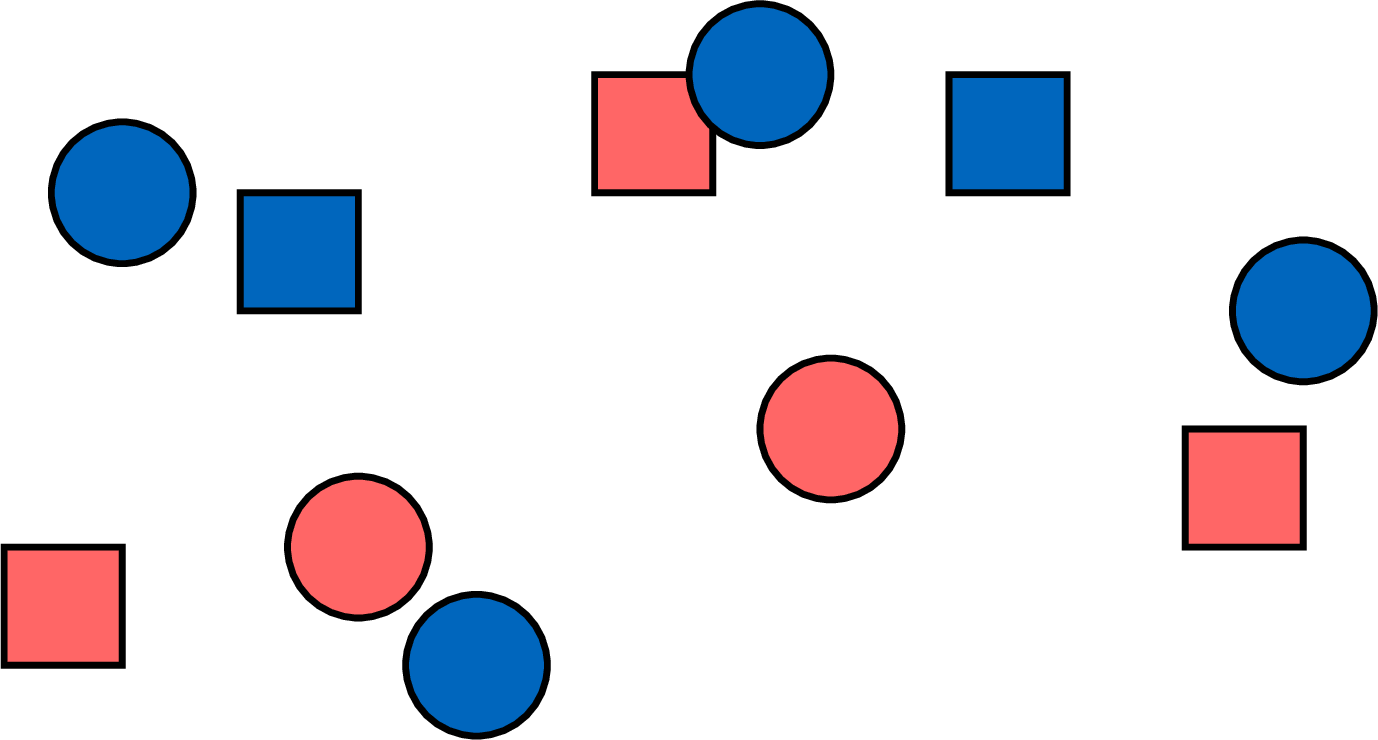
- We count 3 red squares.
- We count 2 blue squares.
- We count 2 red circles.
- We count 4 blue circles.
| \textcolor{colordef}{Red} | \textcolor{colorprop}{Blue} | |
| Square | 3 | 2 |
| Circle | 2 | 4 |
Method — Reading the Totals of a Table
Some two-way tables carry one more row and one more column, both named Total. - A cell of the table is read by crossing: the row gives one rule, the column gives the other. “Boys” crossed with “By bike” gives the number of boys who come by bike.
- The Total column gives, for each row, how many in all: the whole row added up.
- The Total row gives, for each column, how many in all: the whole column added up.
- The corner is the total of everything. It can be found in two ways: by adding the numbers of the Total column that stand before the corner, or by adding the numbers of the Total row that stand before it. The two ways must agree — that is how we check a table.
Example
A school asked all its pupils how they come to school. Here is the table of the answers. | Girls | Boys | Total | |
| On foot | \(77\) | \(65\) | \(142\) |
| By bike | \(29\) | \(18\) | \(47\) |
| By car | \(24\) | \(24\) | \(48\) |
| By bus | \(18\) | \(27\) | \(45\) |
| Total | \(148\) | \(134\) | \(282\) |
We cross, then we read the totals.
- Boys by bike: the row “By bike” crossed with the column “Boys” gives \(18\) boys.
- Pupils on foot: the row “On foot” does not stop at the girls: its Total says \(142\) pupils, and indeed \(77 + 65 = 142\).
- All the pupils: the corner says \(282\). We check it in the two ways: down the Total column, \(142 + 47 + 48 + 45 = 282\); along the Total row, \(148 + 134 = 282\). The two ways agree.
Method — Finding a Missing Number
A table or a chart sometimes gives the total and hides one of the numbers that make it. The total says what the whole line must reach, so the number that is missing is found by subtracting. - Find the line where one number only is missing: a row, a column, or the whole set of bars.
- Add the numbers that are given.
- Subtract that sum from the total: what is left is the missing number.
- Check: put the number back and add the whole line again — the total must come out.
Example — Finding a Missing Number
A class of \(24\) pupils chose a workshop. One number is missing. Find it, then check. | Workshop | Painting | Music | Drama | Total |
| Pupils | \(9\) | \(7\) | ? | \(24\) |
The two numbers given make \(9 + 7 = 16\). The line must reach \(24\), so the missing number is \(24 - 16 = \mathbf{8}\) pupils in drama. Check: \(9 + 7 + 8 = 24\).
The same on a chart: if the three bars drawn reach \(20\), \(15\) and \(10\) while the text announces \(55\) pupils, the missing bar goes up to \(55 - 45 = 10\).
The same on a chart: if the three bars drawn reach \(20\), \(15\) and \(10\) while the text announces \(55\) pupils, the missing bar goes up to \(55 - 45 = 10\).
Skills to practice
- Reading a Two-Way Table
- Completing a Two-Way Table
- Producing a Chart and Solving Problems
V
Going further
Skills to practice
- Conducting a Full Investigation
- Quiz
Jump to section