International Baccalaureate · PYP 2
Data Handling
I
Sorting with One Question
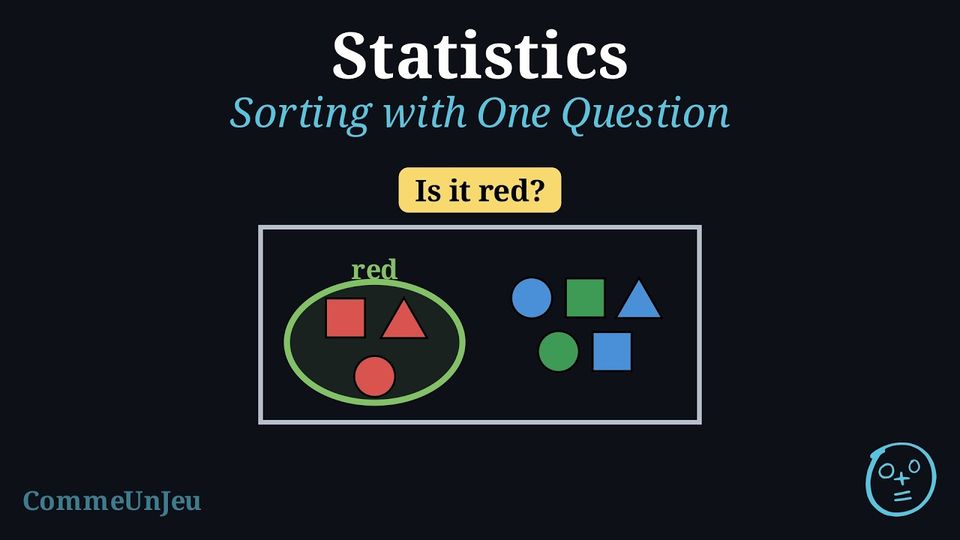
Tom empties his box of shapes on the table. 
He wants to put them away in two trays. For every shape he asks the same question: “Is it red?” Which shapes go in the tray “yes”? How many shapes go in each tray?
Tom asks “Is it red?” about each shape, one after the other. The red square, the red triangle and the red circle answer yes: they go in the tray “yes”. The five other shapes answer no: they go in the tray “no”.
Check: \(3 + 5 = 8\). Every shape is in a tray, and in one tray only. The sorting diagrams below are three ways of drawing these two trays.
Check: \(3 + 5 = 8\). Every shape is in a tray, and in one tray only. The sorting diagrams below are three ways of drawing these two trays.
Definition — Sorting
To sort objects is to put them into groups. We choose one yes-or-no question about a property of the objects (their colour, their shape, their size…), for example “Is it red?”. This question is the sorting question. We ask it about every object: - the objects that answer yes go in one group;
- the objects that answer no go in the other group.
Definition — Sorting Tree
A sorting tree starts from all the objects and asks the sorting question. It then splits into two branches: the branch “yes” and the branch “no”. At the end of each branch we put the objects of that group. 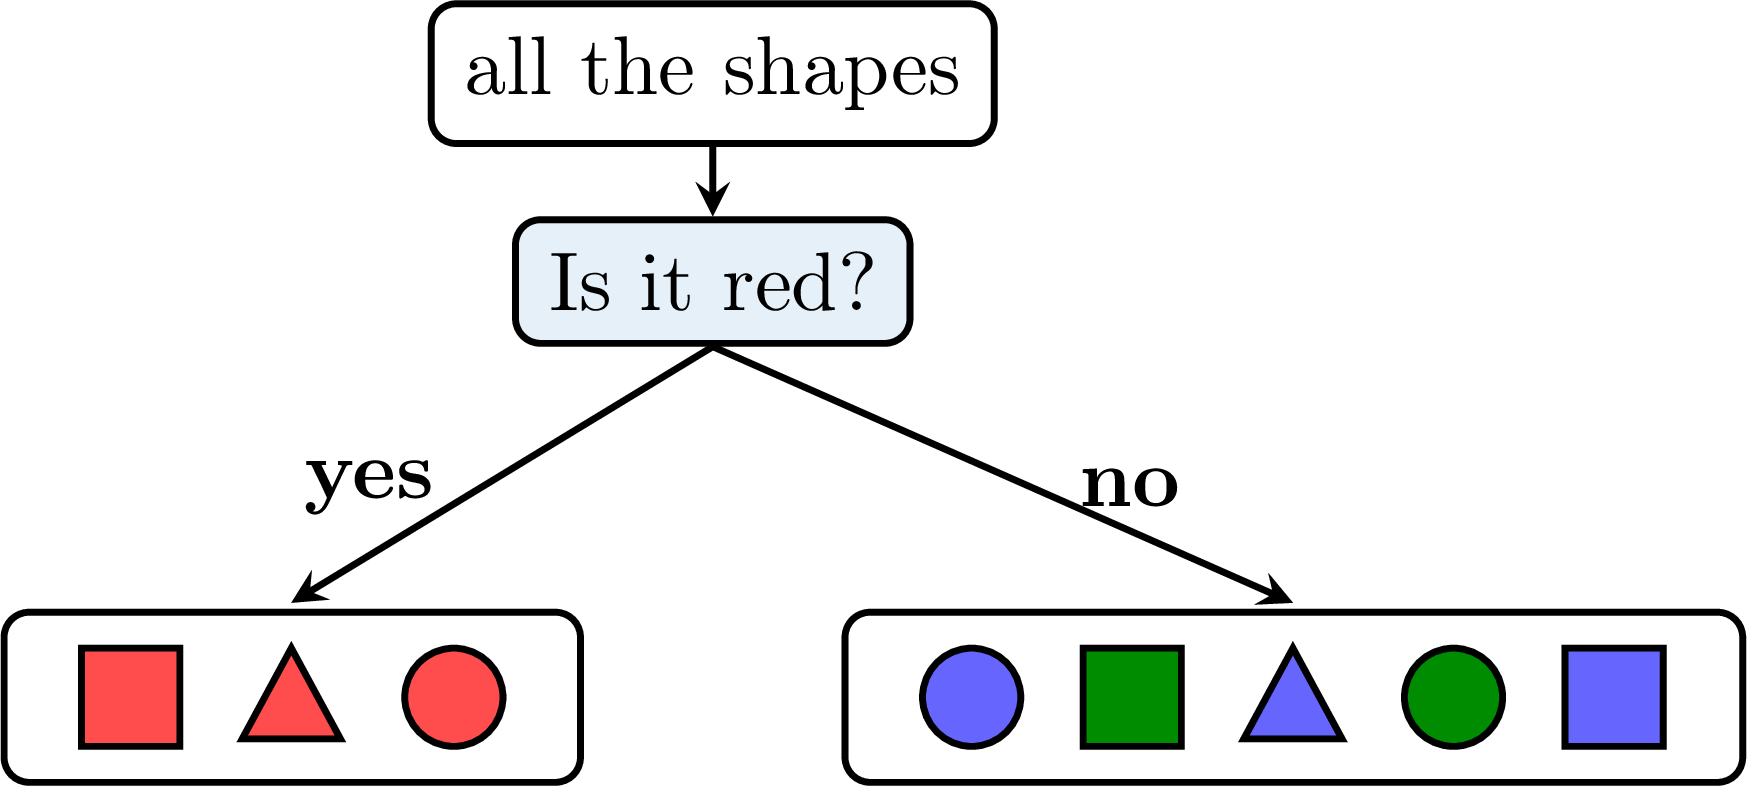
Definition — Carroll Diagram
A Carroll diagram is a table with two boxes. The name at the top of each box says which objects go in it: one box for the objects that have the property (“red”), one box for the objects that do not have it (“not red”). Each object goes in one box. 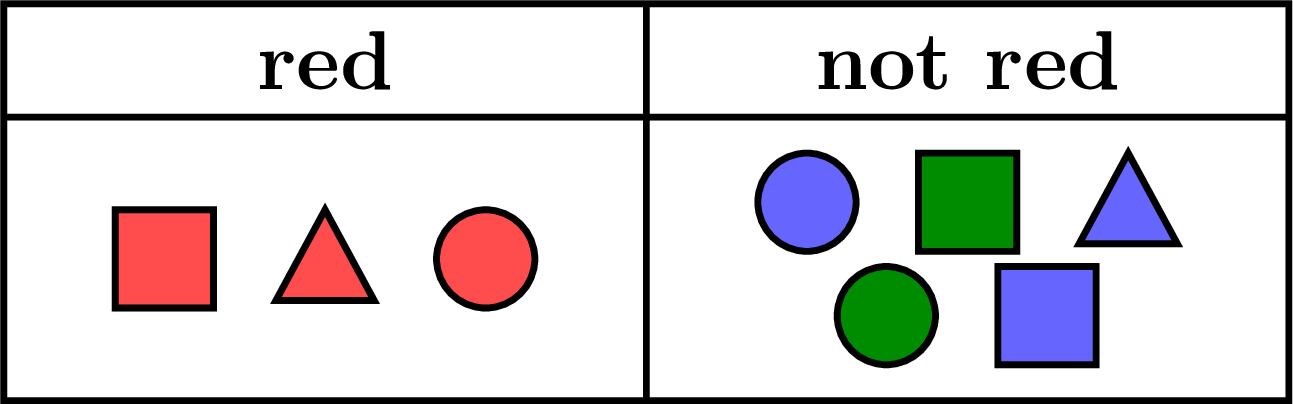
Definition — Venn Diagram
A Venn diagram is a frame that holds all the objects, with a loop drawn inside it. The name of the loop is the property. The objects that have the property go inside the loop; the other objects stay outside the loop, in the frame. 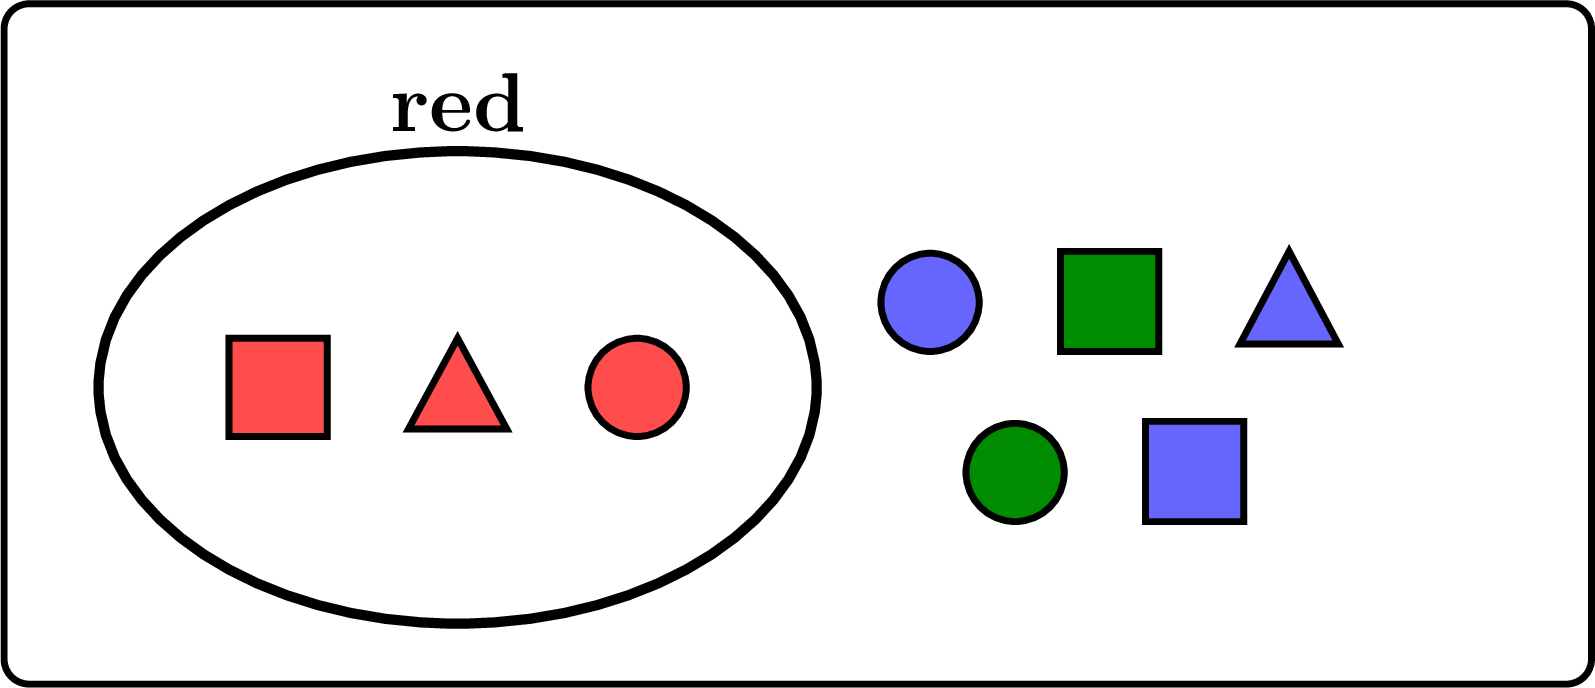
Method — Reading a Sorting Diagram
A sorting tree, a Carroll diagram and a Venn diagram can show the same two groups: only the picture changes. - Find the sorting question: read the question of the tree, the names of the boxes, or the name of the loop.
- Count each group: the branch “yes”, the box of the property or the inside of the loop; then the branch “no”, the other box or the outside of the loop.
- Check the total: the two groups together make all the objects.
- Place a new object: ask it the sorting question. If the answer is yes, it goes with the “yes” group; if the answer is no, it goes with the other group.
Example
Léa sorted some numbers with the question “Is it bigger than 20?”. 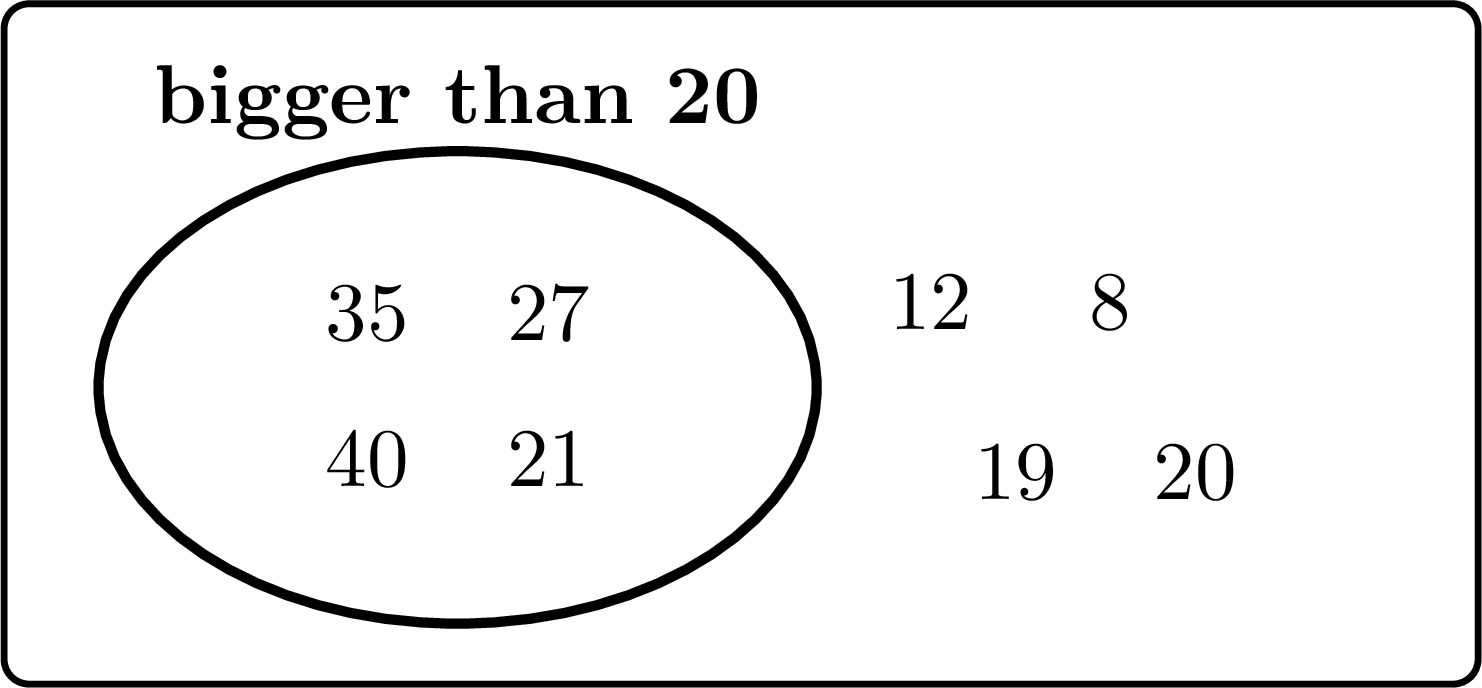
The name of the loop gives the sorting question.
- Inside the loop: \(35\), \(27\), \(40\) and \(21\). These 4 numbers are bigger than \(20\).
- Outside the loop: \(12\), \(8\), \(19\) and \(20\). These \(4\) numbers are not bigger than \(20\): \(20\) is equal to \(20\), not bigger, so it stays outside.
- Léa sorted \(4 + 4 = \mathbf{8}\) numbers.
- \(25\) is bigger than \(20\): the answer is yes, so \(25\) goes inside the loop.
Skills to practice
- Choosing the Correct Group
- Counting the Groups of a Sorting Diagram
II
Bar Charts
Definition — Bar Chart
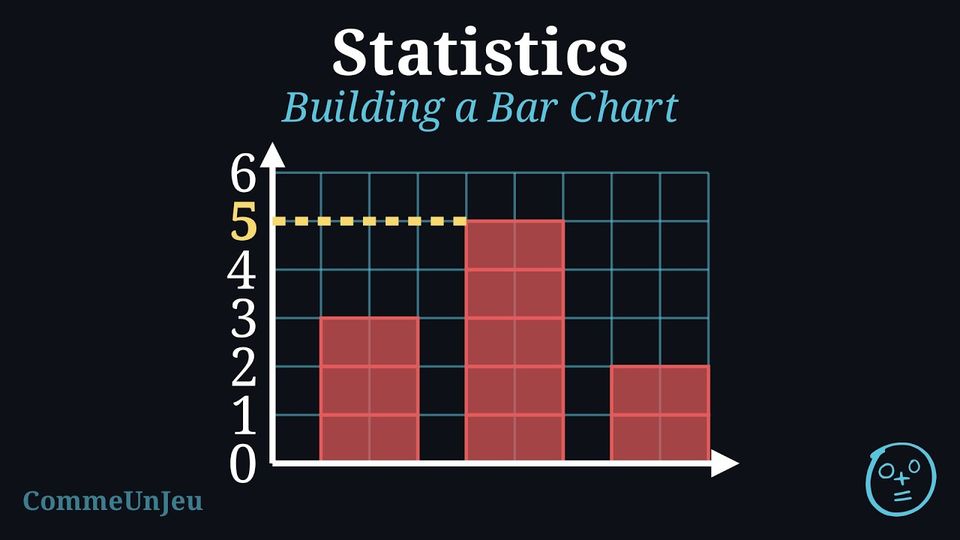
A bar chart shows data with bars. It is drawn like a picture graph: a column of pictures becomes a bar. Each bar goes up to the number of its group: the taller the bar, the bigger the number. Most often, the names of the groups are written at the bottom and the numbers on the side. One glance is enough to see which group has the biggest number. Example
A class voted for their favourite fruits. First, they collected the data in a tally chart: | Fruit | Tally Marks | Total |
| Lemon |  | 1 |
| Orange |  | 4 |
| Apple |  | 5 |
| Cherry |  | 2 |
- Favourite Fruits Bar Chart
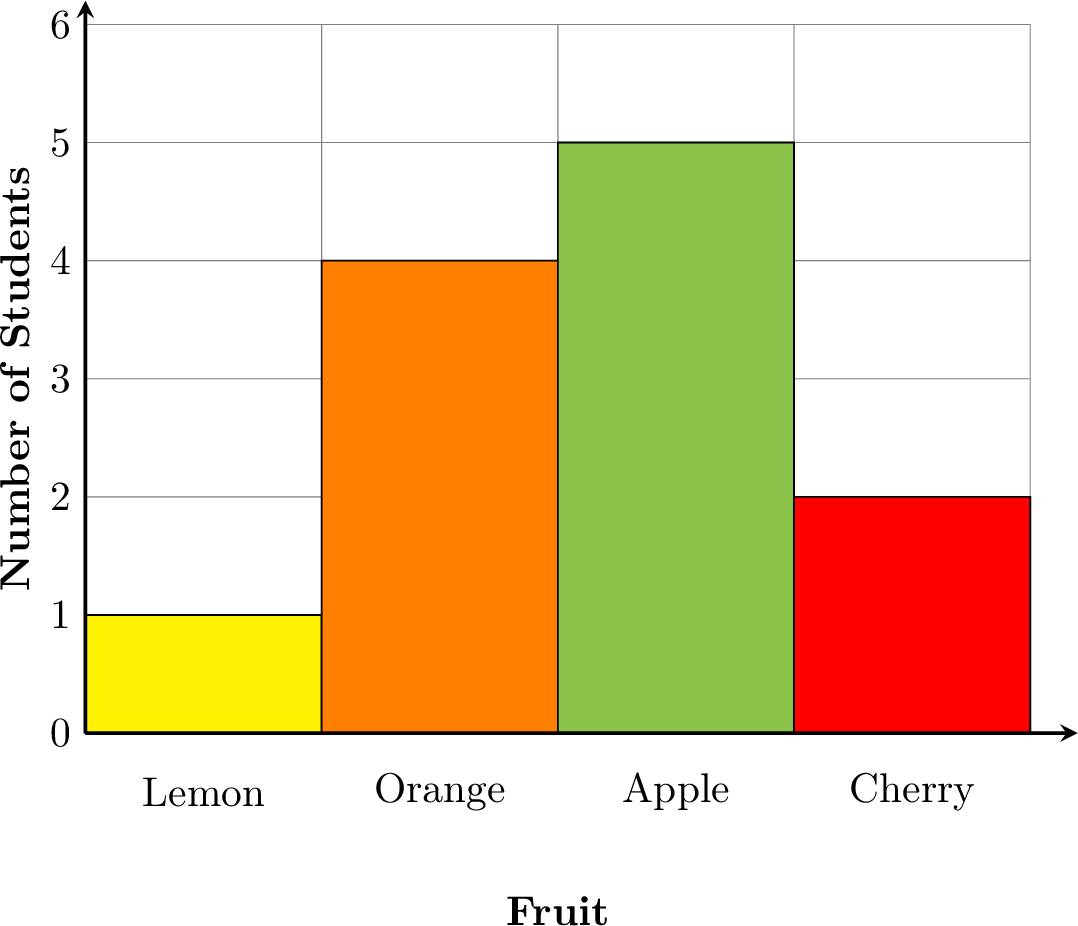
- How to Read the Bar Chart:
- Look at the bottom to see the categories (Lemon, Orange, Apple, Cherry).
- Look at the numbers on the side. They tell you “how many”.
- Find the top of a bar and follow it across to the number on the side to see its total.
- Check that the height of each bar matches the total in the tally chart.
- Reading the Chart:
- Which fruit is the most popular? Apple, because its bar is the tallest (it reaches 5).
- Which fruit is the least popular? Lemon, because its bar is the shortest (it reaches 1).
- How many more students chose Apple than Cherry? Apple has 5 votes and Cherry has 2. So, \(5 - 2 = 3\) more students chose Apple.
Method — Building a Bar Chart
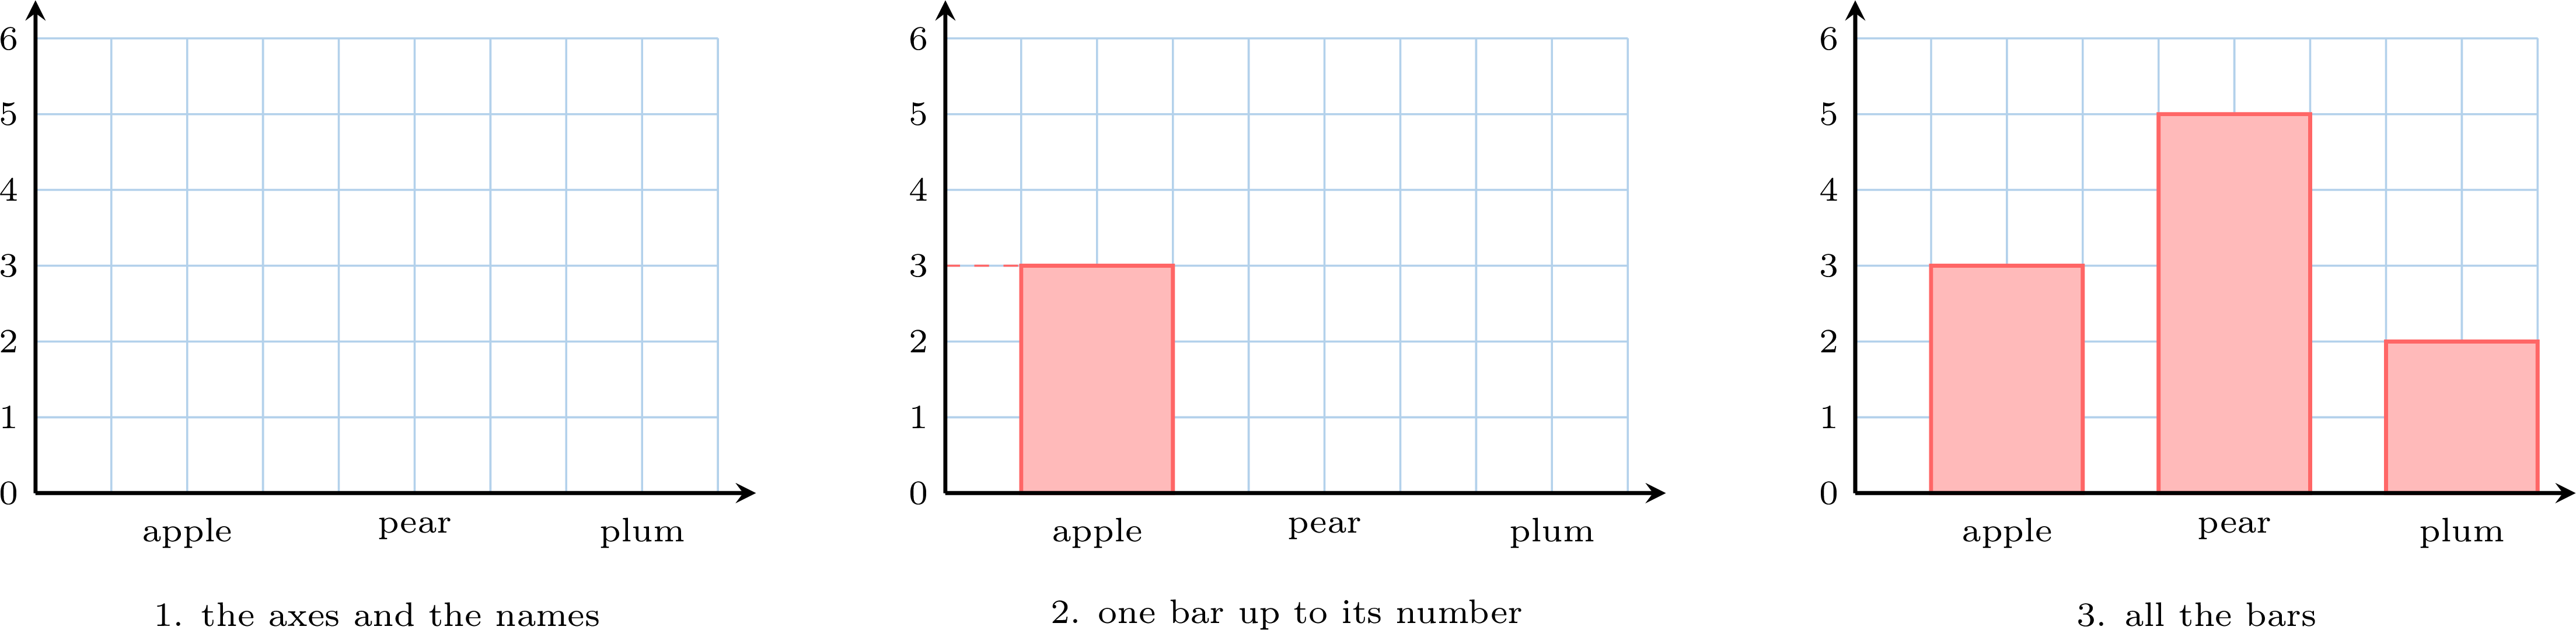
From a tally chart, we draw the bar chart on squared paper. - The two axes: draw the base line, then the vertical axis on its left. Number the vertical axis one by one, from \(0\) on the base line: each square is one.
- The names: write the name of each category under the base line, one name per bar; leave a gap between two bars (here, one empty column).
- One bar at a time: read the total of the category in the table, then colour the squares of its bar from the base line upwards, until the top of the bar falls on that number.
- Check: slide a finger from the top of each bar to the scale — you must read the number of the table again.
Method — Reading a Bar Chart
To read a bar chart someone else has drawn: - Read the bottom: the names written under the bars say what each bar counts.
- Read the side: the numbers written up the side are the scale. Often it goes up one by one: each square is one.
- Follow one bar: put a finger on the top of the bar and slide it across to the numbers. The number you reach is the count of that bar.
- Compare without counting: the tallest bar is the most frequent answer, the shortest the least frequent — and two bars of the same height mean two answers chosen just as often. To know how many more, read the two numbers and subtract.
Skills to practice
- Building a Bar Chart
- Reading Graphs
III
Conducting an Investigation
Method — Our Plan for Collecting Data
Collecting data requires a clear plan. Here is one way to do it. - Ask a Clear Question: Start with something you want to know. For example: “What is your favourite pet?” Everyone should understand the question and be able to answer it.
- Gather Your Answers: Ask your classmates the same question, one by one, so that everyone answers once.
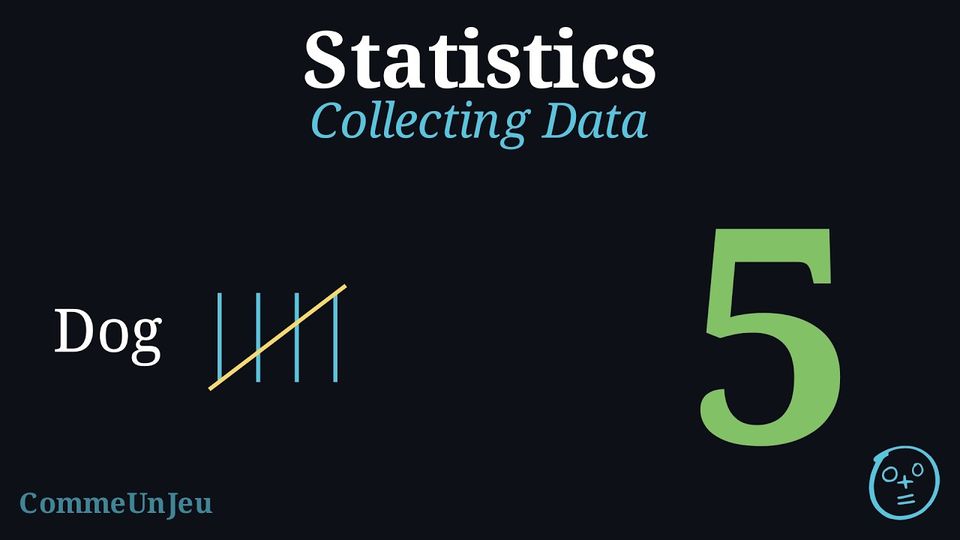
- Record the Data with Tally Marks: A tally mark is a quick way to write down “one”. For every answer, you draw one line. When you get to five, you draw a line across the first four. This makes it easy to count and check your total later.
| Pet | Tally Marks | Total |
| Dog | | 5 |
| Cat | | 4 |
| Fish | | 2 |
Skills to practice
- Conducting a Full Investigation
IV
Review & Quizz
Skills to practice
- Quiz
Jump to section