International Baccalaureate · PYP 5
Statistics: Graphs and Averages
I
Population and Types of Data
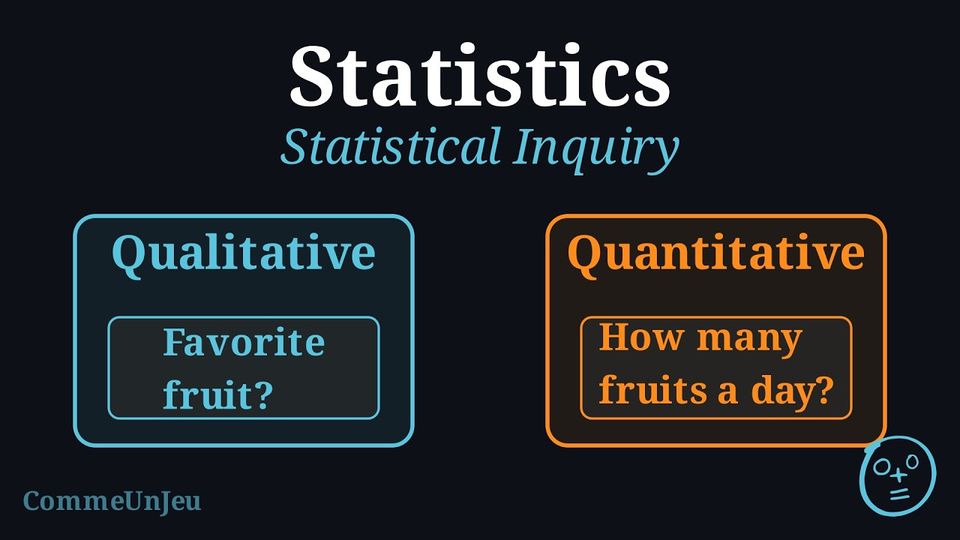
Suppose a class wants to investigate the question: “What is our favourite school subject?” The survey covers all 25 students in the class.
Definition — Population
A population is the entire group of people or things that you want to study. Example
For our survey, the population is all 25 students in our class. Example
The data we collect will be the list of answers from each student, such as “Maths”, “Art”, “Science”, “Art”, “Sport”, etc. Definition — Qualitative and Quantitative Variables: Counting or Measuring
A survey looks at a variable: what is observed for each person or each object. - a qualitative variable (the answers are categorical data): the answer names a category (eye colour, favourite food), even when it is written with a number, like a shirt number;
- a quantitative variable (the answers are numerical data): the answer says how many. It is counted (the number of siblings) or measured (height in centimetres, mass in kilograms, a duration).
Example
For our survey: - The variable “Favourite Subject” is qualitative because the answers are categories (Maths, Art, etc.).
- The variable “time spent on homework each week” is quantitative: the answer is a duration, which is measured (e.g., 2 hours, 5 hours).
Skills to practice
- Identifying Populations
- Classifying Data Types
- Designing Questions for Data Types
II
Frequency Tables
Definition — Frequency and Relative Frequency
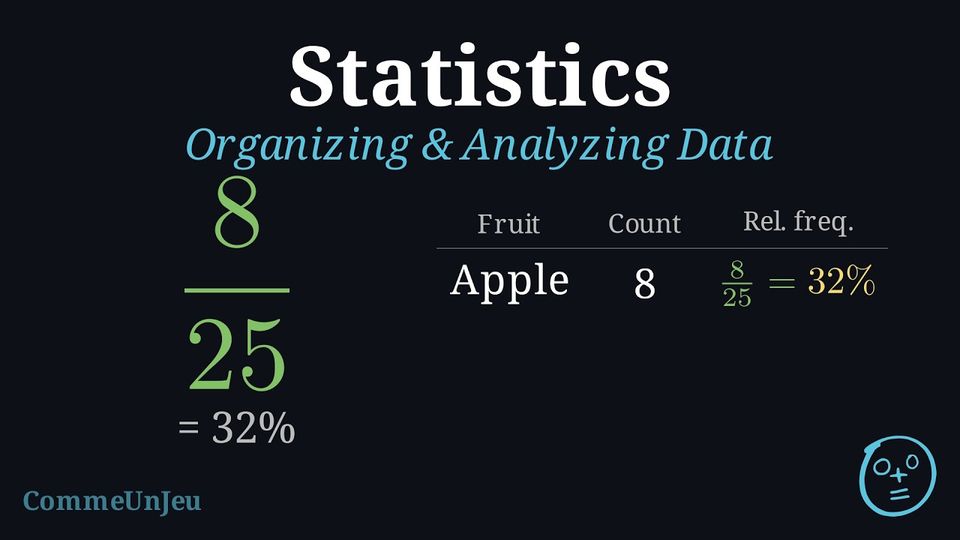
The frequency (or count) of a category is how many times that category appears in our data.Relative frequency is the proportion of the data that falls into a category. We can write it as a fraction, a decimal, or a percentage. $$ \text{Relative frequency (in }\pourcent\text{)} = \frac{\text{Frequency}}{\text{Total number of data values}} \times 100\pourcent $$
Method — Creating a Frequency Table
To organise our data, we use a frequency table. We use tally marks to count the frequency for each category. Then, we can calculate the relative frequency.Here is the data for the “Favourite Subject” survey of 25 students, organised into a frequency table:
| Subject | Tally Marks | Frequency (Count) | Relative Frequency |
| Maths | 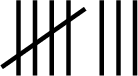 | 8 | \(8/25 = 32\pourcent\) |
| Science |  | 5 | \(5/25 = 20\pourcent\) |
| Sport | 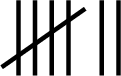 | 7 | \(7/25 = 28\pourcent\) |
| Art | | 5 | \(5/25 = 20\pourcent\) |
| Total | 25 | 100\(\pourcent\) |
Example
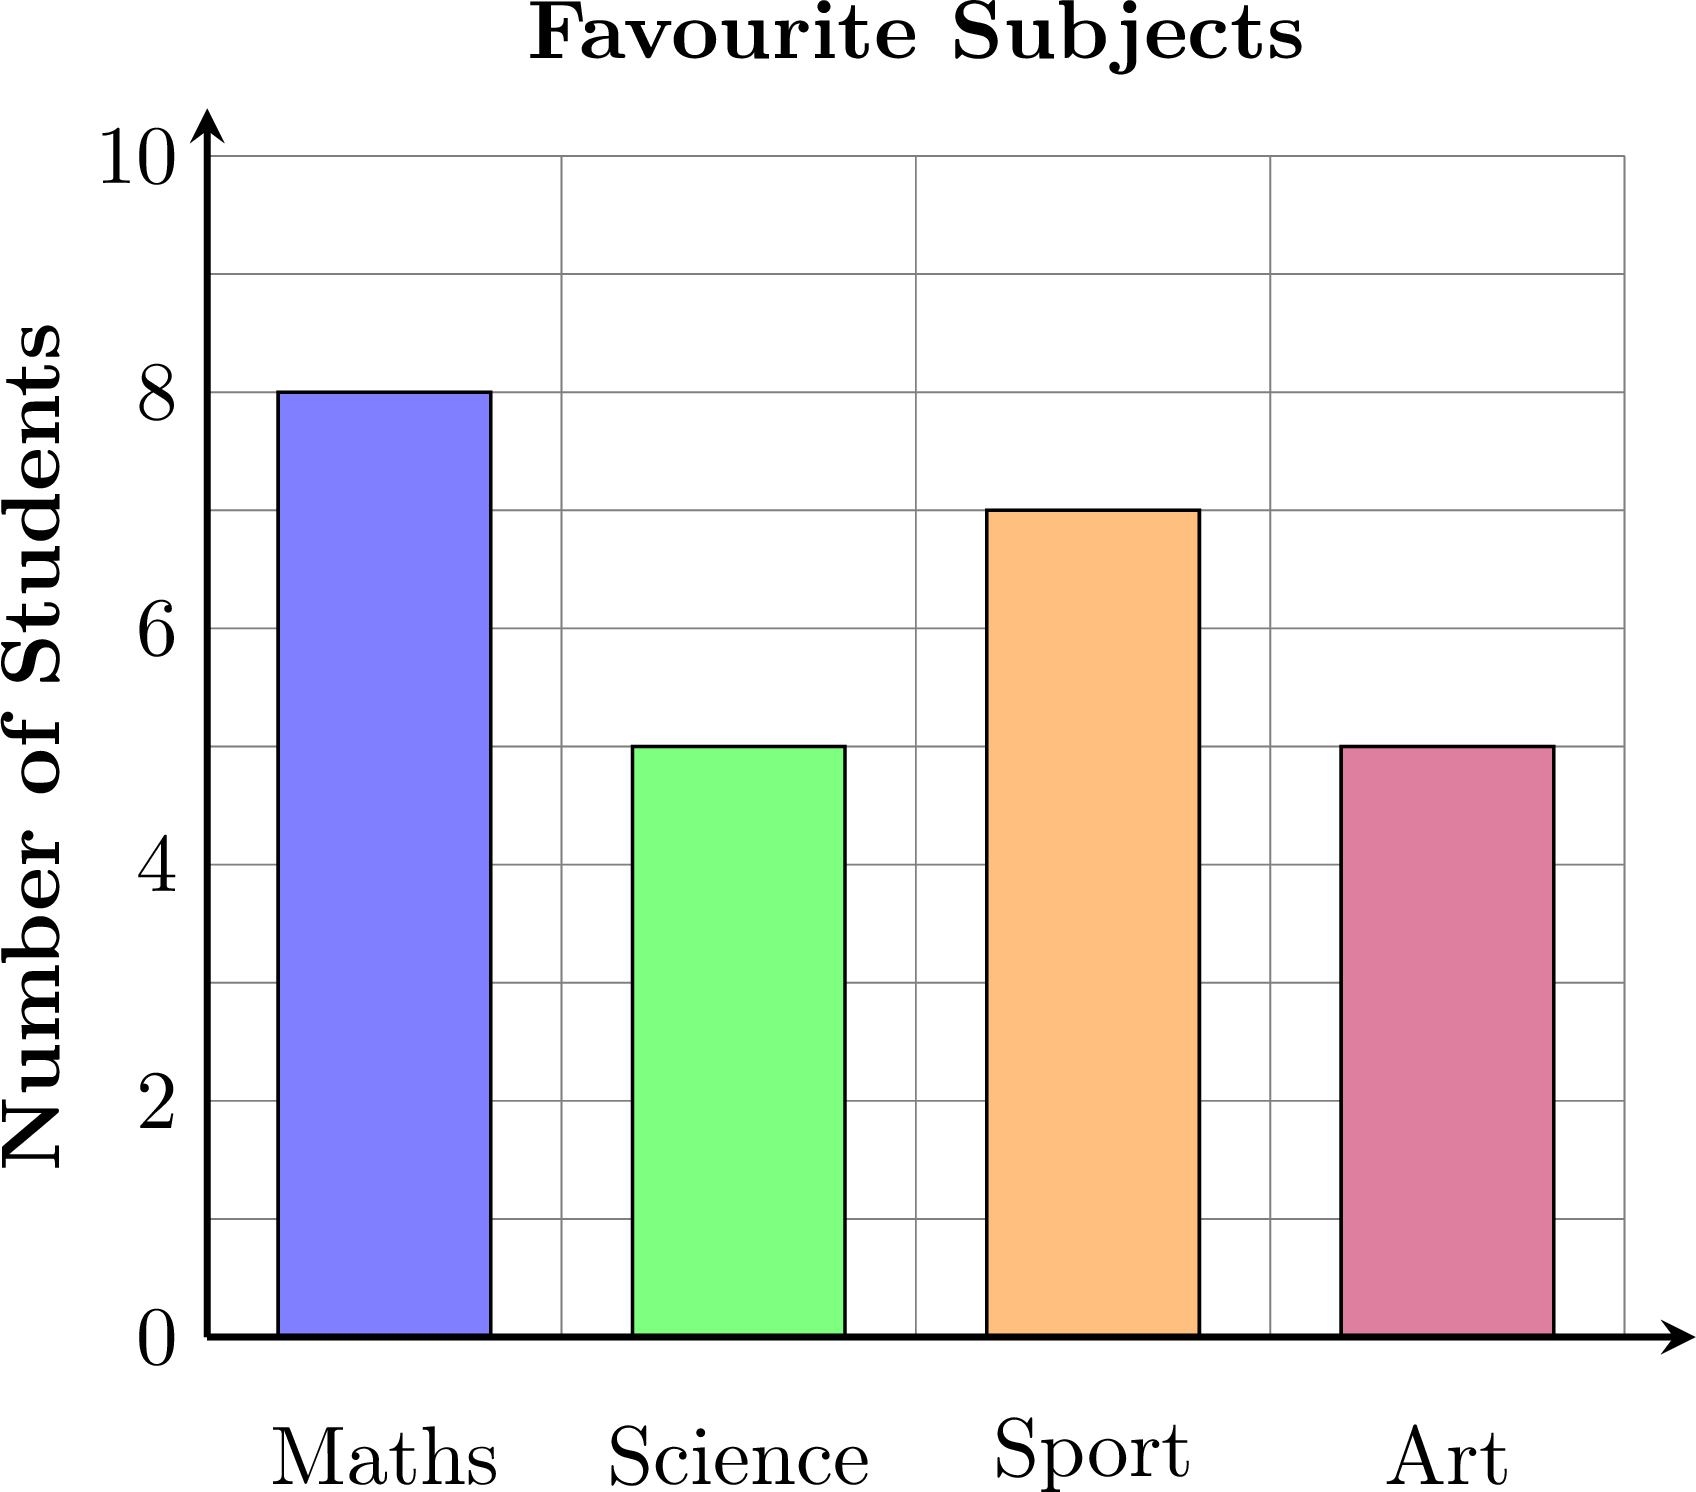
Here is a bar chart showing the data from our “Favourite Subject” table: the number of students for each subject (also called its frequency). It helps us see the results at a glance. | Subject | Number of Students |
| Maths | 8 |
| Science | 5 |
| Sport | 7 |
| Art | 5 |
Skills to practice
- Finding Frequencies in Lists and Bar Charts
- Finding Relative Frequencies
III
Data in a Text
Method — Taking data out of a text
A problem does not always come with a table: the data can be hidden in a text. Before answering anything, take the data out of the text and put it in a table. - Read the text once, then underline every number together with what it counts (“40 comics”, “8 picture books”). A number without its category is useless.
- Draw a table with one row per category, and a row for the total.
- Fill it in. Be careful: some numbers in a text are not the data we are looking for (a date, a page number, an age), and some data is given indirectly (“the others”, “twice as many”): compute it. Sometimes, on the contrary, a piece of data we need is not in the text at all: then we cannot answer without it.
- Check the total, then answer the question from the table, not from the text.
Example
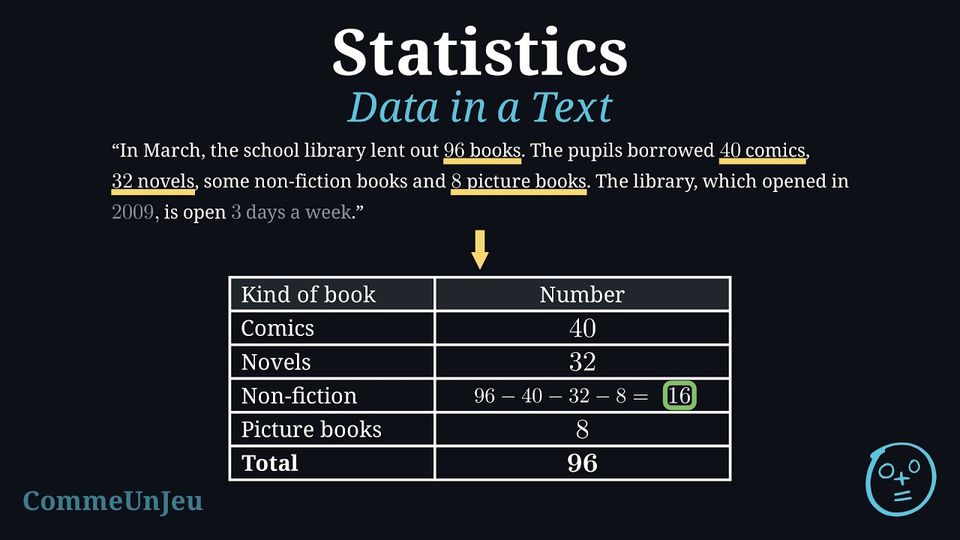
“In March, the school library lent out 96 books. The pupils borrowed 40 comics, 32 novels, some non-fiction books and 8 picture books. The library, which opened in 2009, is open 3 days a week.” How many non-fiction books were borrowed? Which kind of book was borrowed twice as often as the picture books?
The numbers that count books are \(96\) (total), \(40\), \(32\) and \(8\); the year \(2009\) and the \(3\) days are not the data we need. The non-fiction books are given indirectly: \(96 - 40 - 32 - 8 = 16\).
Twice \(8\) is \(16\): the non-fiction books were borrowed twice as often as the picture books.
| Kind of book | Number |
| Comics | 40 |
| Novels | 32 |
| Non-fiction | \(96-40-32-8 = 16\) |
| Picture books | 8 |
| Total | 96 |
Skills to practice
- Finding the Missing Information
- Taking Data from a Text into a Table
IV
The Pie Chart
Definition — Pie chart
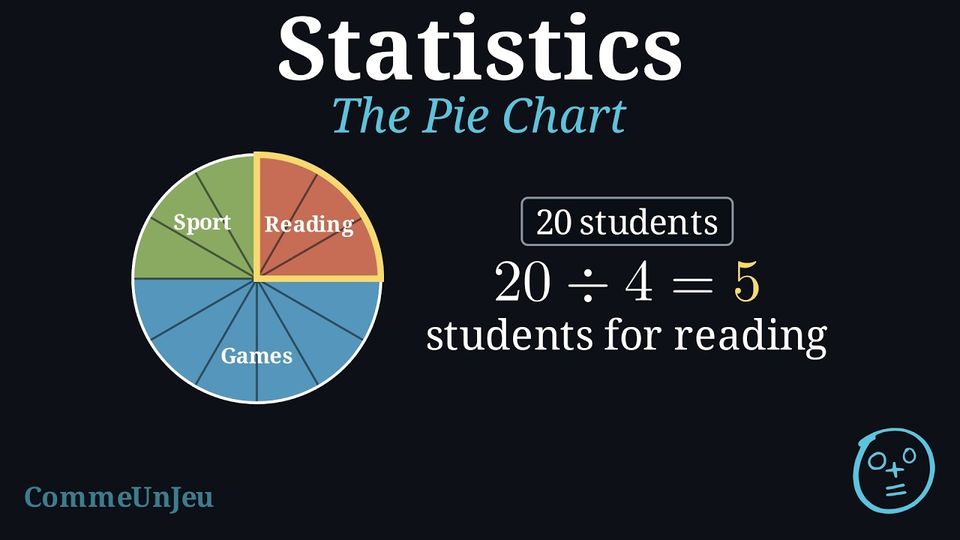
A pie chart shows how a total is shared out between categories. The disc stands for the whole total; each category gets a sector (a slice), and the bigger the sector, the bigger the share. Half of the disc means half of the total, a quarter of the disc a quarter of the total. On our charts, the disc is divided into \(12\) equal parts by thin lines, so a sector can be read as a number of parts out of \(12\): \(3\) parts out of \(12\) is a quarter, \(2\) parts is a sixth (because \(6 \times 2 = 12\)), \(6\) parts is a half. A semi-circular chart works the same way, with a half-disc that stands for the whole total; ours are divided into \(10\) equal parts. 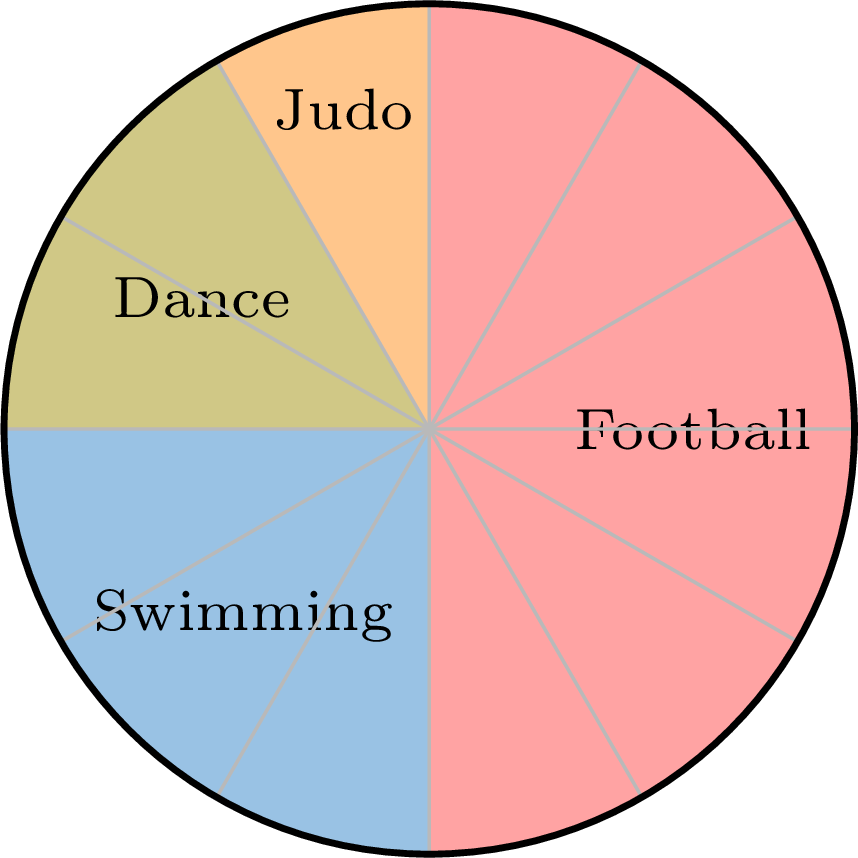
Method — Reading a pie chart
To find how many things a sector stands for: - Find the total. It is written in the title or in the text (“the favourite sport of the \(24\) pupils”). Without the total, a pie chart like ours, with nothing written in the sectors, only gives shares, not numbers.
- Read the share of the sector: count its parts out of \(12\), or compare it with a half or a quarter of the disc.
- Compute the number: the share of the total. A quarter of \(24\) is \(24 \div 4 = 6\); one part out of \(12\) is \(24 \div 12 = 2\), so \(2\) parts are \(4\).
- Check: the numbers of all the sectors must add up to the total.
Example
The pie chart shows the favourite sport of the \(24\) pupils of a class. How many pupils prefer each sport?
The total is \(24\).
- Football: 6 parts out of 12, that is half of the disc, so half of 24 \(= 12\) pupils.
- Swimming: 3 parts out of 12, that is a quarter of the disc, so a quarter of 24 \(= 6\) pupils.
- Dance: 2 parts out of 12, that is \(\frac{1}{6}\) of the disc, so \(\frac{1}{6}\) of 24 \(= 4\) pupils.
- Judo: 1 part out of 12, that is \(\frac{1}{12}\) of the disc, so \(\frac{1}{12}\) of 24 \(= 2\) pupils.
Example
This semi-circular chart shows how the \(40\) pupils of two classes come to school. The half-disc is divided into \(10\) equal parts. How many pupils come by bike? On foot? 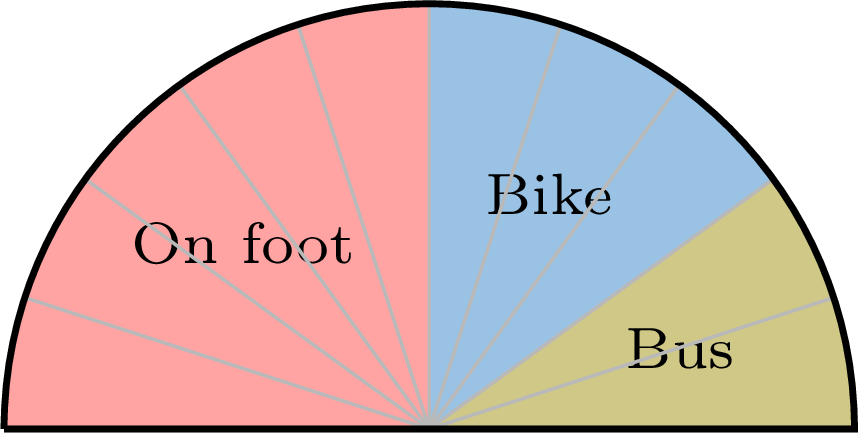
The half-disc stands for the \(40\) pupils, and one part out of \(10\) is \(40 \div 10 = 4\) pupils.
- On foot: 5 parts out of 10 of the half-disc, that is half of the total, so 20.
- Bike: 3 parts out of 10 of the half-disc, that is \(\frac{3}{10}\) of the total, so 12.
- Bus: 2 parts out of 10 of the half-disc, that is \(\frac{1}{5}\) of the total, so 8.
Shares, not numbers. These two pie charts look exactly the same: in both, reading takes a quarter of the disc. But the first one is about a class of \(20\) pupils and the second about a school of \(100\) pupils. A quarter of \(20\) is \(5\) pupils; a quarter of \(100\) is \(25\) pupils. The same sector can stand for very different numbers: shares can be compared on the discs, but to compare numbers between two pie charts, look at their totals first. 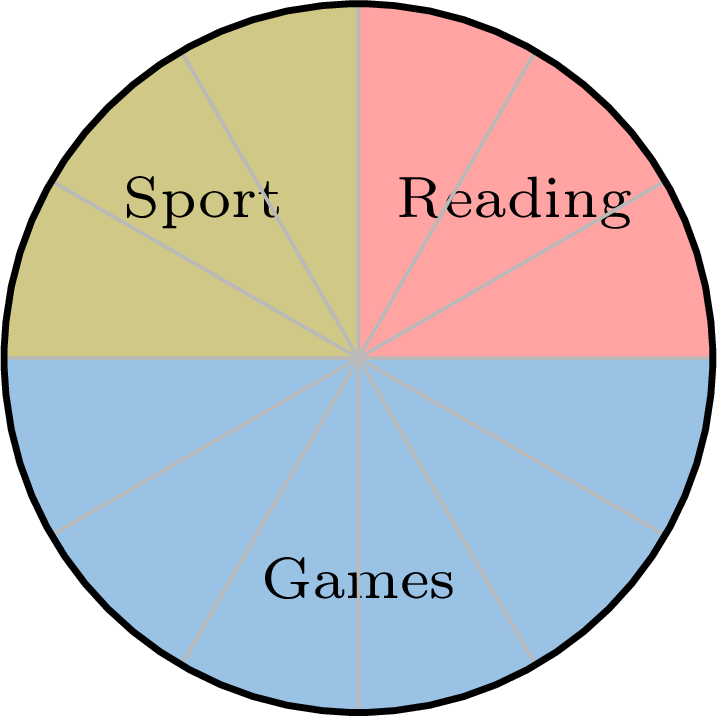
Skills to practice
- Judging Statements about Pie Charts
- Reading a Pie Chart
- Turning a Pie Chart into a Table
V
The Mean
Definition — The Mean
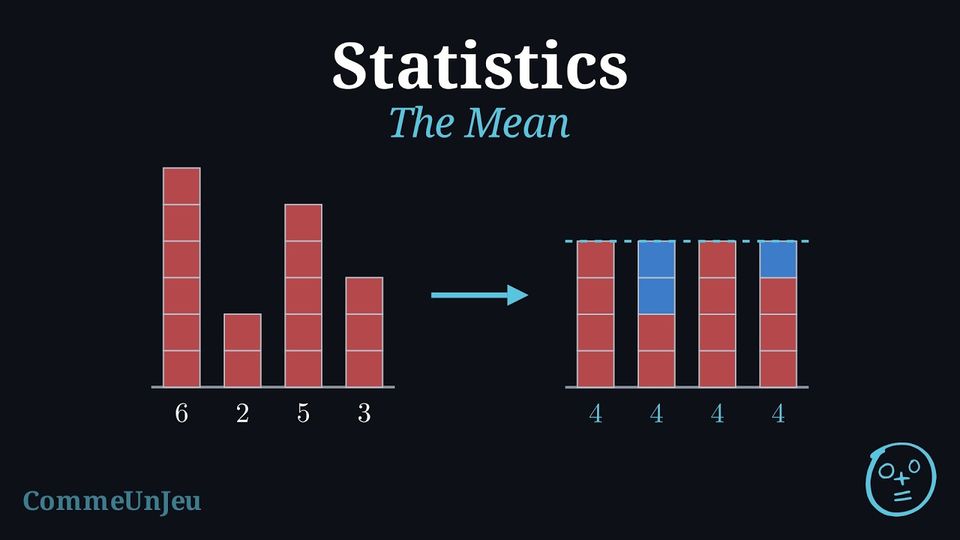
Four children build towers of cubes: \(6\), \(2\), \(5\) and \(3\) cubes. They move cubes from the tall towers to the short ones until all the towers are the same height. No cube is added or taken away, so the \(16\) cubes are shared out equally between the \(4\) towers: each tower ends with \(16 \div 4 = 4\) cubes. 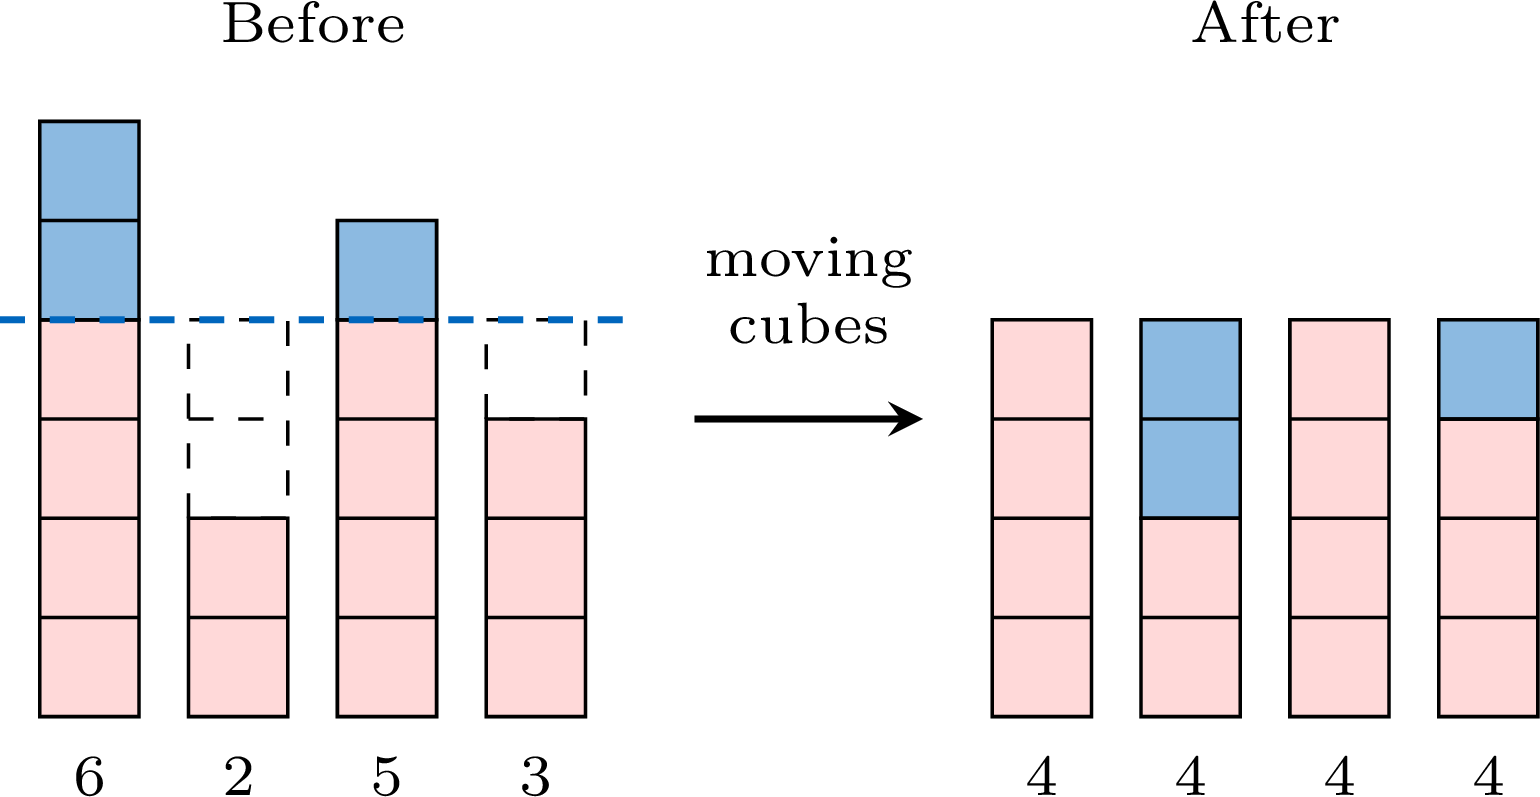
Method — Finding the Mean
- Add all the values: this gives the total. A value \(0\) is a value too: it adds nothing to the total, but it counts as one value.
- Count the values.
- Divide the total by the number of values. The result is the mean.
- Check: the mean lies between the smallest and the largest value. It is not always one of the values, and not always a whole number.
Example
In five matches, a team scored \(3\), \(1\), \(4\), \(0\) and \(2\) goals. Find the mean number of goals per match.
The \(0\) is a value: there are \(5\) matches, not \(4\). $$\begin{aligned}[t] \text{mean} &= (3 + 1 + 4 + 0 + 2) \div 5 && \text{(total} \div \text{number of values)}\\
&= 10 \div 5\\
&= 2. \end{aligned}$$ The mean is 2 goals per match: with \(2\) goals in each of the \(5\) matches, the team would have scored the same \(10\) goals. Check: \(2\) lies between \(0\) and \(4\).
Example
Leo scored \(12\), \(9\), \(15\) and \(10\) points in four basketball games. Find his mean score per game.
$$\begin{aligned}[t] \text{mean} &= (12 + 9 + 15 + 10) \div 4 && \text{(total} \div \text{number of values)}\\
&= 46 \div 4\\
&= 11.5. \end{aligned}$$ Leo's mean score is 11.5 points per game. The mean is not one of the four scores, and it is not a whole number: no game ended with \(11.5\) points, but \(4\) games of \(11.5\) points would make the same total, \(46\). Check: \(11.5\) lies between \(9\) and \(15\).
Skills to practice
- Understanding the Mean
- Calculating the Mean
- Solving Problems with the Mean
VI
The Median
Definition — The Median
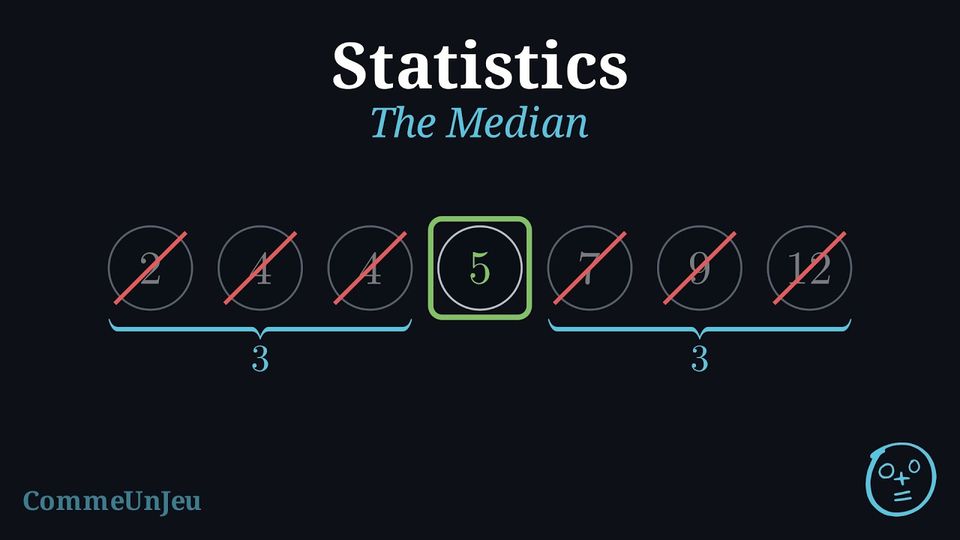
Five children, all of different heights, stand in a line from the shortest to the tallest. The child in the middle has two children shorter and two children taller: this child's height is the middle height.To find the median of a set of numbers, first write the values in order, from the smallest to the largest. The median is the middle of the ordered values: it splits the values into two groups of the same size, one on each side.
- With an odd number of values (\(3\), \(5\), \(7\), …), the median is the value in the middle.
- With an even number of values (\(2\), \(4\), \(6\), …), two values share the middle: the median is halfway between them. Add the two middle values and divide by \(2\).
Method — Finding the Median
- Write the values in order, from the smallest to the largest, and count them: the ordered list must have as many values as the data.
- Cross off the smallest and the largest value, then again the smallest and the largest of those left, until one or two values are left.
- One value left: it is the median. Two values left: the median is halfway between them, their total divided by \(2\).

Example
Seven children counted the books they read in one month: \(4\), \(9\), \(2\), \(7\), \(4\), \(12\) and \(5\). Find the median.
In order: \(2,\ 4,\ 4,\ 5,\ 7,\ 9,\ 12\) — seven values, as in the data. Seven is odd, so one value is in the middle: crossing off \(2\) and \(12\), then \(4\) and \(9\), then \(4\) and \(7\) leaves \(5\). $$2,\ 4,\ 4,\ \underline{5},\ 7,\ 9,\ 12$$ The median is 5 books: three children read fewer books, three read more. Taken in the order of the data, the middle value would be \(7\): that is why the values are put in order first.
Example
Six bean plants measure \(14\), \(9\), \(11\), \(20\), \(8\) and \(12\) centimetres. Find the median height.
In order: \(8,\ 9,\ 11,\ 12,\ 14,\ 20\) — six values. Six is even, so two values share the middle: \(11\) and \(12\). $$\begin{aligned}[t] \text{median} &= (11 + 12) \div 2 && \text{(halfway between the two middle values)}\\
&= 23 \div 2\\
&= 11.5. \end{aligned}$$ The median height is 11.5 cm: three plants are shorter, three are taller.
Skills to practice
- Recognising the Median
- Finding the Median
VII
The Range
Definition — The Range
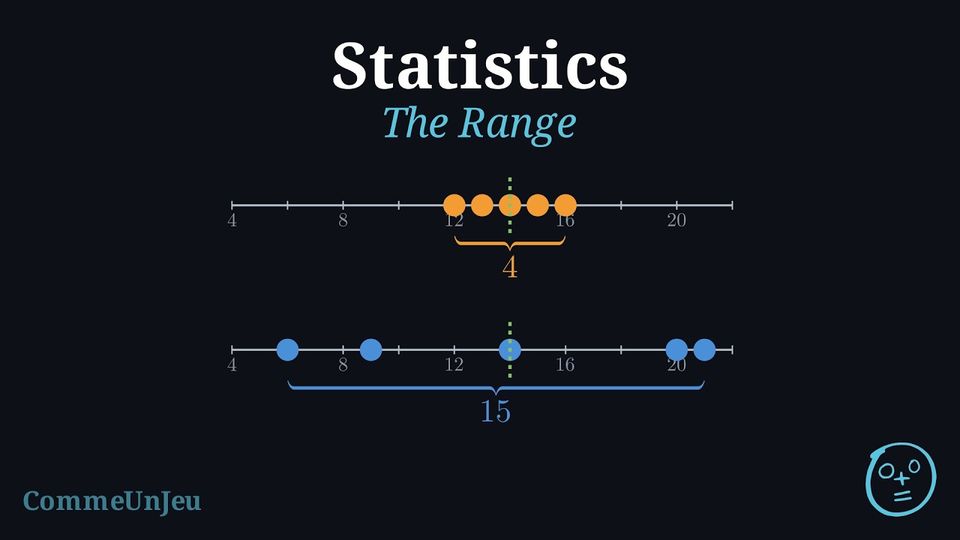
The range of a set of numbers is the largest value minus the smallest value: $$\text{range} = \text{largest value} - \text{smallest value}.$$ The range measures the spread of the data: a small range means that the values are close together, a large range that they are spread out. The range is the distance between the smallest and the largest value: it does not tell what a typical value is. Example
Mia and Sam each threw a ball five times. Their throws, in metres: - Mia: \(12\), \(15\), \(14\), \(13\), \(16\);
- Sam: \(6\), \(20\), \(14\), \(9\), \(21\).
Mia: the total is \(12 + 15 + 14 + 13 + 16 = 70\), so the mean is \(70 \div 5 = 14\) m; the range is \(16 - 12 = 4\) m.
Sam: the total is \(6 + 20 + 14 + 9 + 21 = 70\), so the mean is \(70 \div 5 = 14\) m; the range is \(21 - 6 = 15\) m. 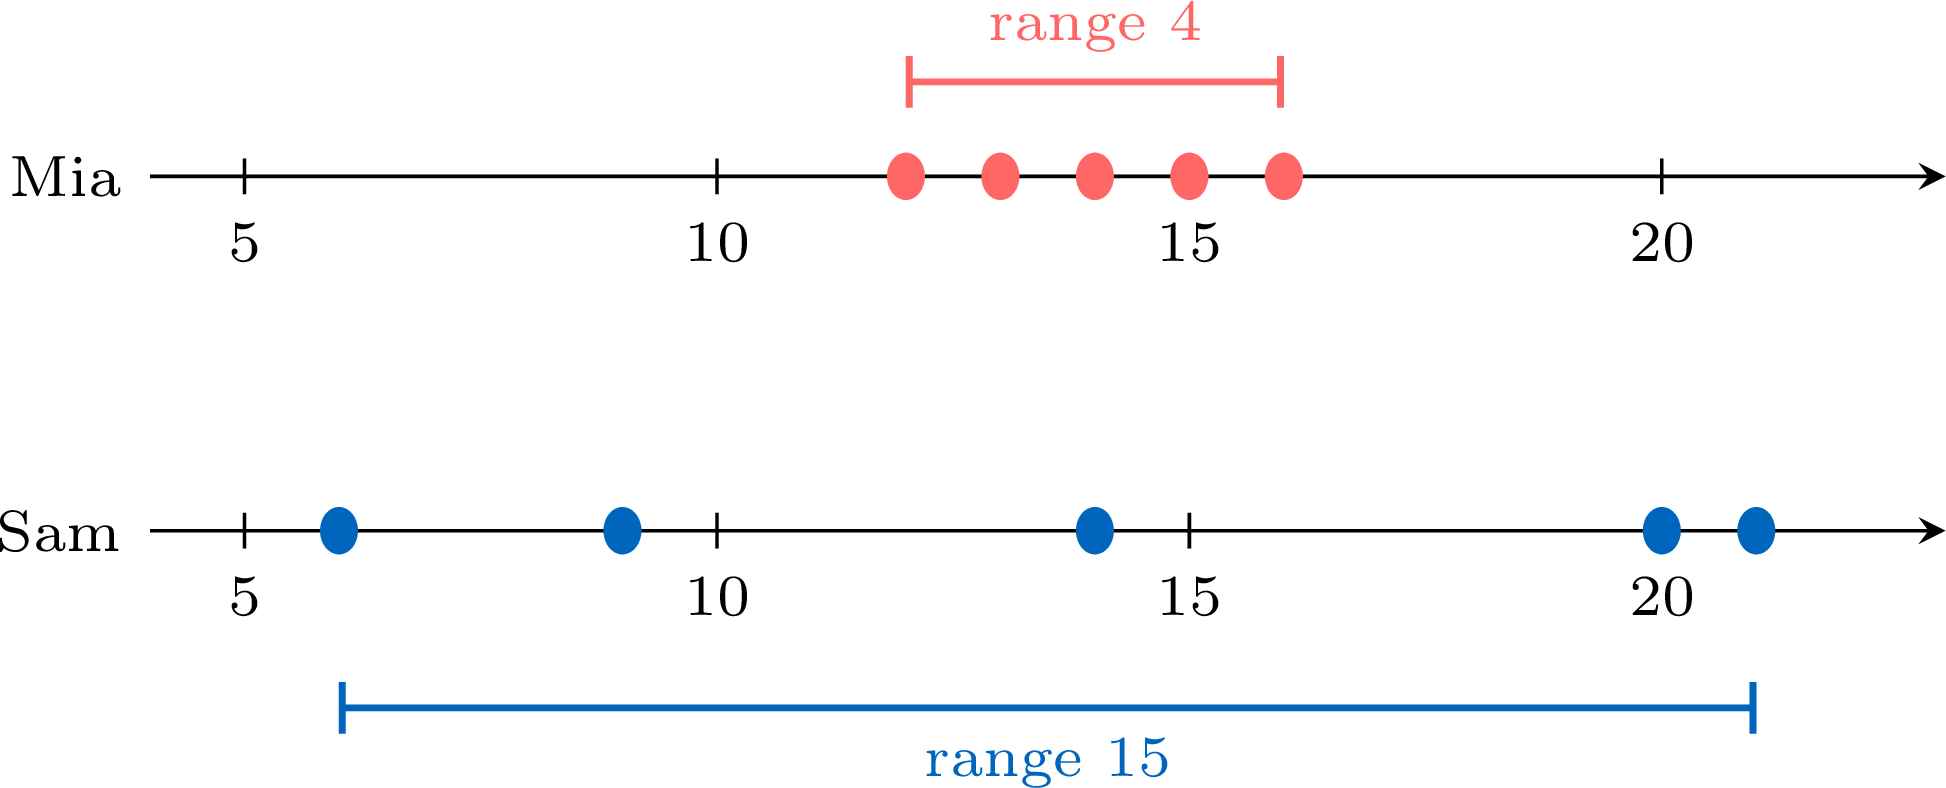
The two children have the same mean, \(14\) m, but Mia's throws are close together (range \(4\) m) and Sam's are spread out (range \(15\) m): Mia throws more regularly. The mean alone could not show this difference; the range does.
Sam: the total is \(6 + 20 + 14 + 9 + 21 = 70\), so the mean is \(70 \div 5 = 14\) m; the range is \(21 - 6 = 15\) m.
Mode, Mean, Median and Range
The mode, the mean, the median and the range are four measures: each one sums up a whole set of data in a short answer.
- The mode is the value that occurs most often (there can be more than one mode, or none). It also works for words, even words that cannot be put in order: the favourite pet, the size a shop sells most.
- The mean shares the total out equally. It uses every value, so one value far from the others pulls it towards that value.
- The median is the middle of the ordered data: it only looks at the values in the middle. With three values or more, making the largest value much larger does not change it.
- The range does not give a typical value: it tells how spread out the values are.
Skills to practice
- Comparing Spread and Choosing a Measure
- Finding the Range
- Choosing and Comparing Measures
VIII
The Spreadsheet
Definition — Spreadsheet and Cells
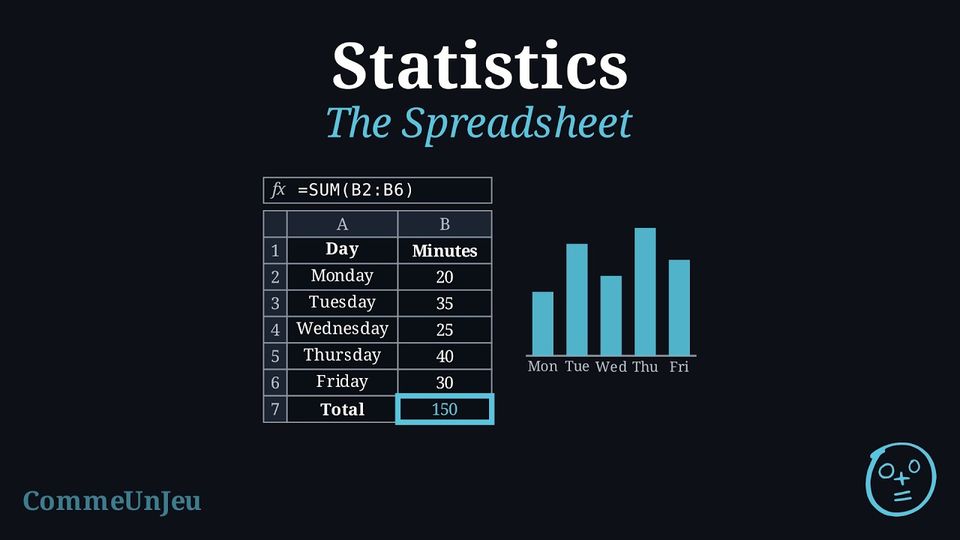
A spreadsheet is a computer program that shows a grid of boxes called cells. The columns are named by letters (A, B, C, …) and the rows by numbers (1, 2, 3, …). A cell is named by the letter of its column followed by the number of its row: the cell B3 is in column B and in row 3. A cell can hold a word, a number or a formula. 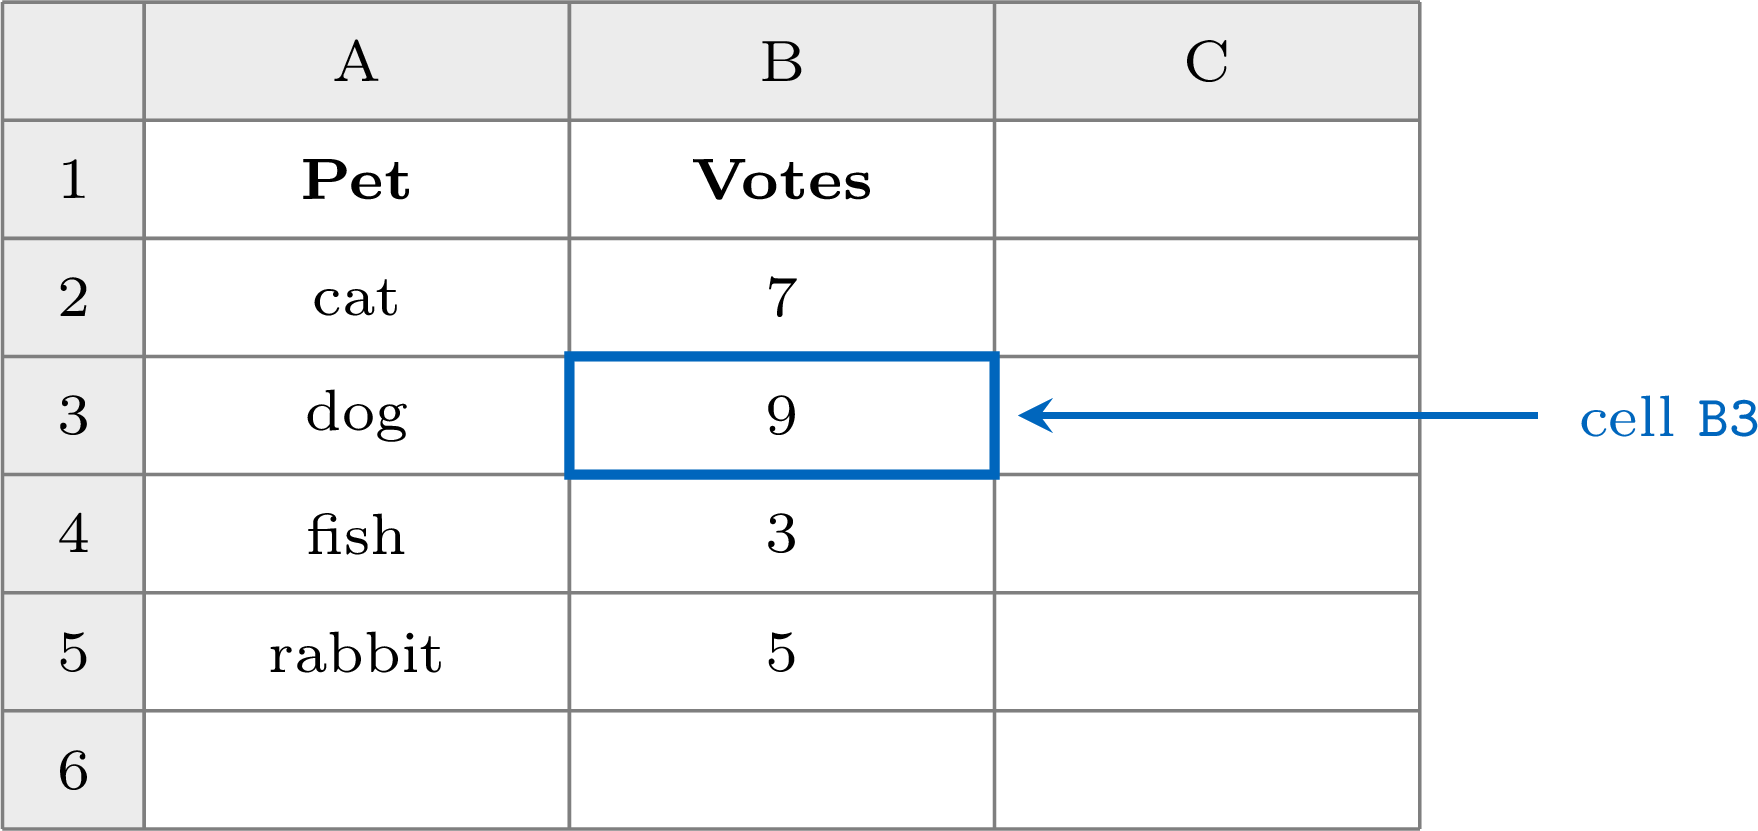
Method — Writing a Formula
- Type the data, one value in each cell: the names (the days, the pets…) in one column and their numbers in the next column, with a title at the top of each column, in row 1.
- Click the cell where the result must appear.
- Type a formula. A formula always starts with the sign
=:-
=B2+B3adds the numbers of the cellsB2andB3; -
=SUM(B2:B6)adds all the numbers fromB2toB6(B2:B6means the five cellsB2,B3,B4,B5andB6); -
=AVERAGE(B2:B6)gives the mean of these numbers.
-
- Press Enter: the cell shows the result. When the cell is selected, its formula can be read in the formula bar, above the grid.
- When a number used by a formula changes, the spreadsheet computes the result again by itself.
- To draw a bar chart, select the names and their numbers with the two titles, and nothing else (no total, no mean), then choose a bar chart: each name gets a bar, and each number gives the height of its bar.
Example
Every day of a school week, a class writes down in a spreadsheet how many minutes it spent reading. The teacher types =SUM(B2:B6) in the cell B7 and =AVERAGE(B2:B6) in the cell B8. The grid below is not what the screen shows: it shows what the teacher typed in each cell. On the screen, once Enter is pressed, each of these two cells shows its result instead. 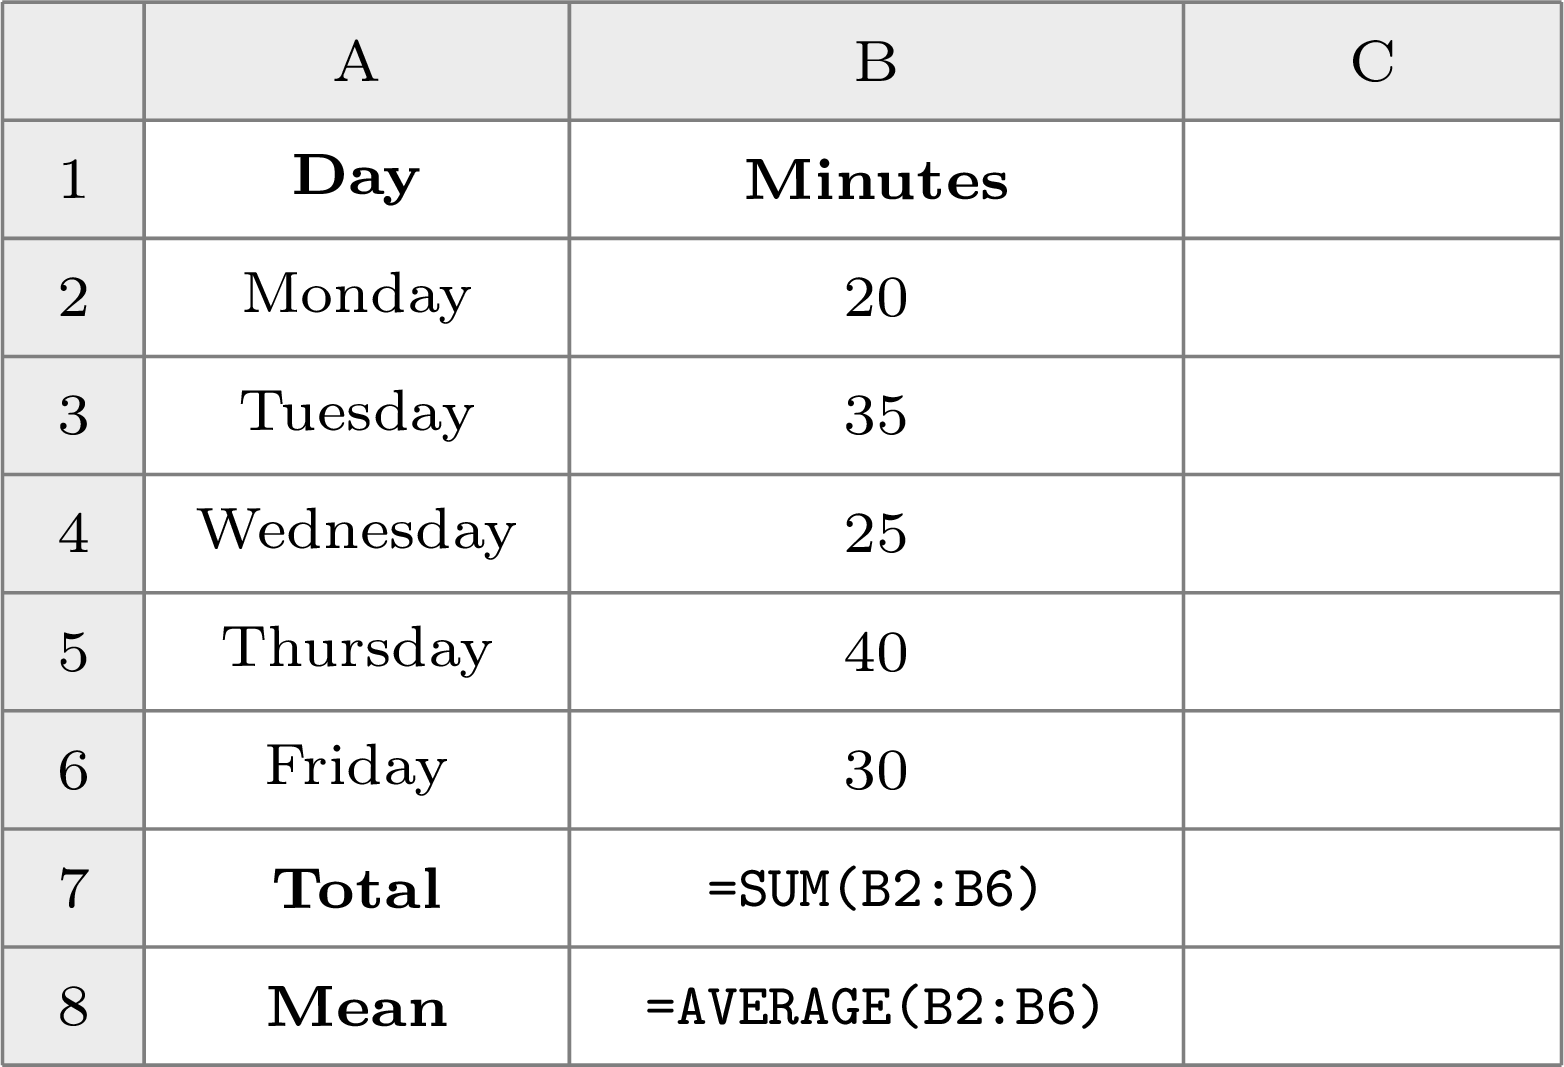
- What do the cells
B7andB8show after pressing Enter? - The class made a mistake: on Tuesday it read for \(45\) minutes, not \(35\). The number in
B3is changed to \(45\). What doB7andB8show now? - How can the class draw a bar chart of its reading time?
-
B7adds the five cells: \(20 + 35 + 25 + 40 + 30 = 150\).B8shows their mean: \(150 \div 5 = 30\). The cells show \(150\) and \(30\); the formula=SUM(B2:B6)can still be read in the formula bar whenB7is selected.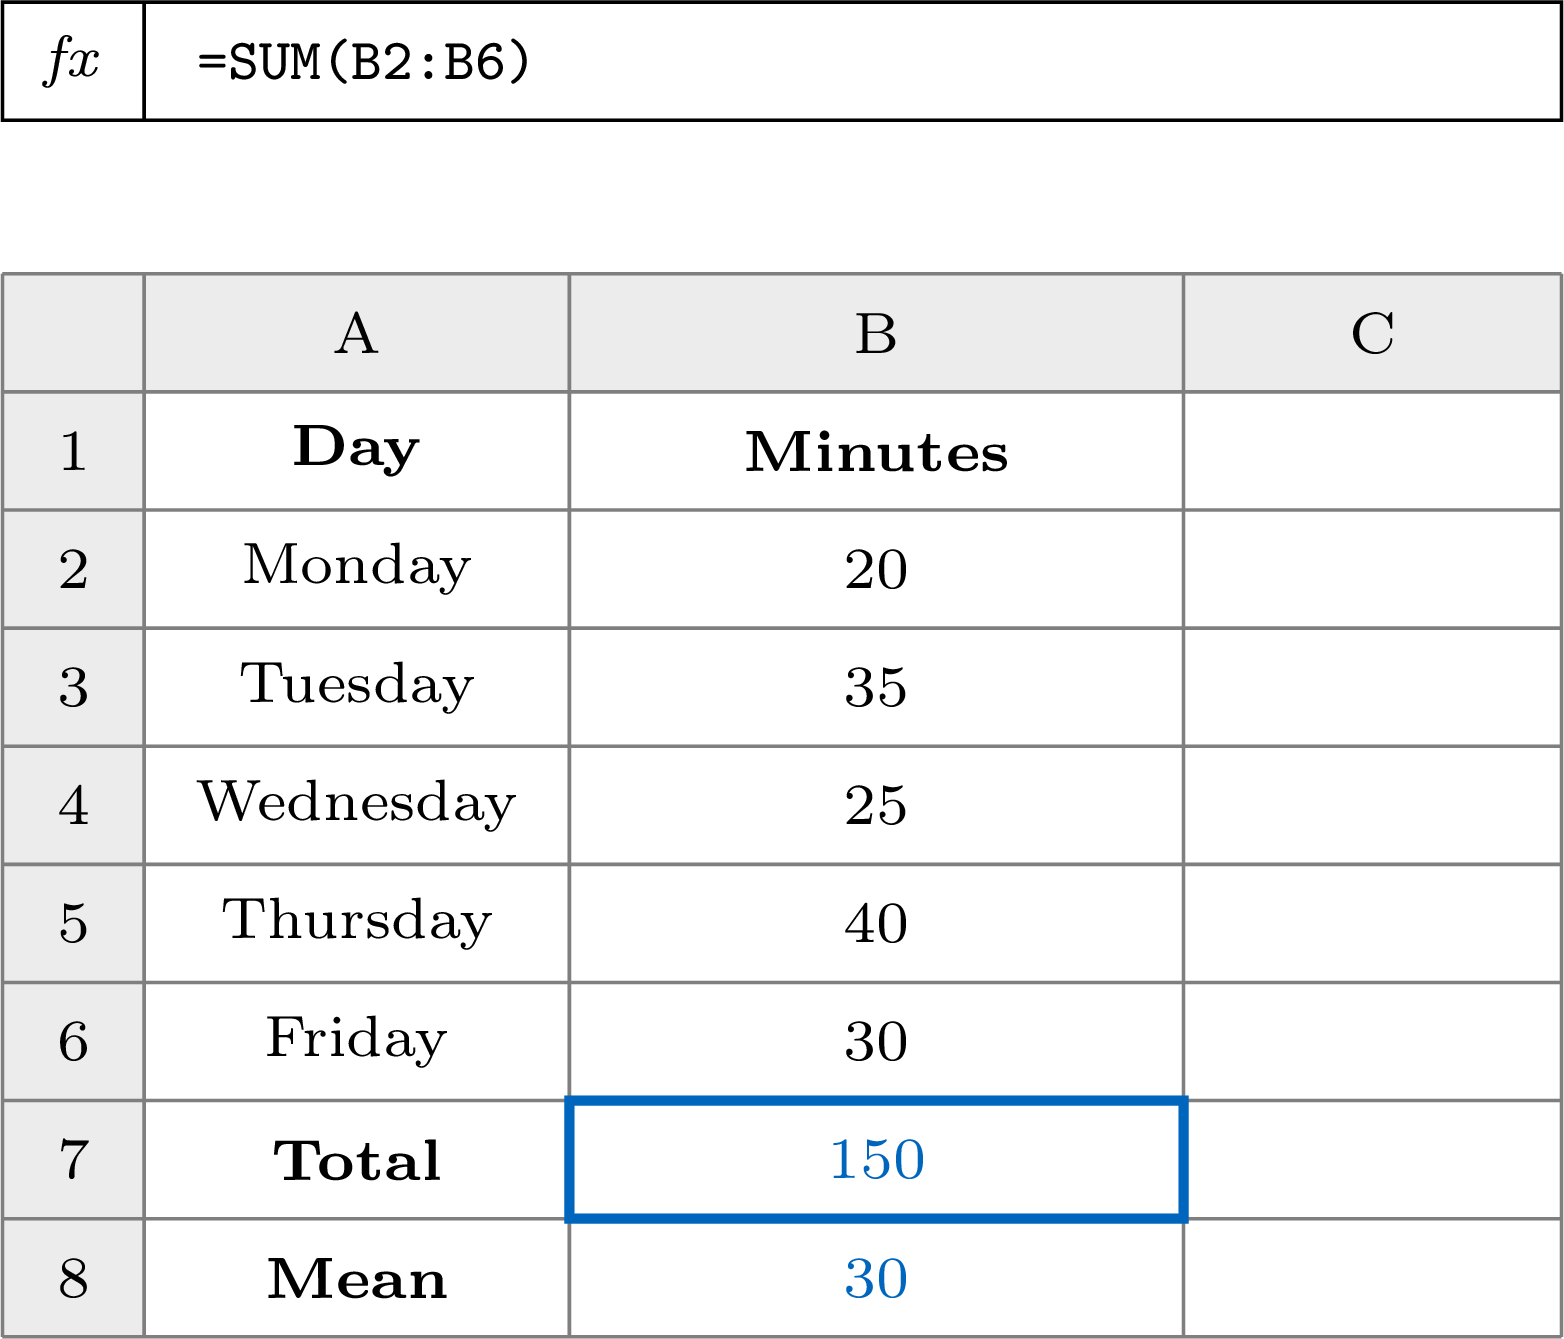
- Nothing has to be typed again: the spreadsheet computes again by itself. The new total is \(150 - 35 + 45 = 160\), so
B7shows \(160\) andB8shows \(160 \div 5 = 32\). - Select the cells from
A1toB6(the days and the minutes, with their titles) and choose a bar chart. Each day gets a bar whose height is its number of minutes; if a number changes, its bar changes too. With \(45\) minutes on Tuesday: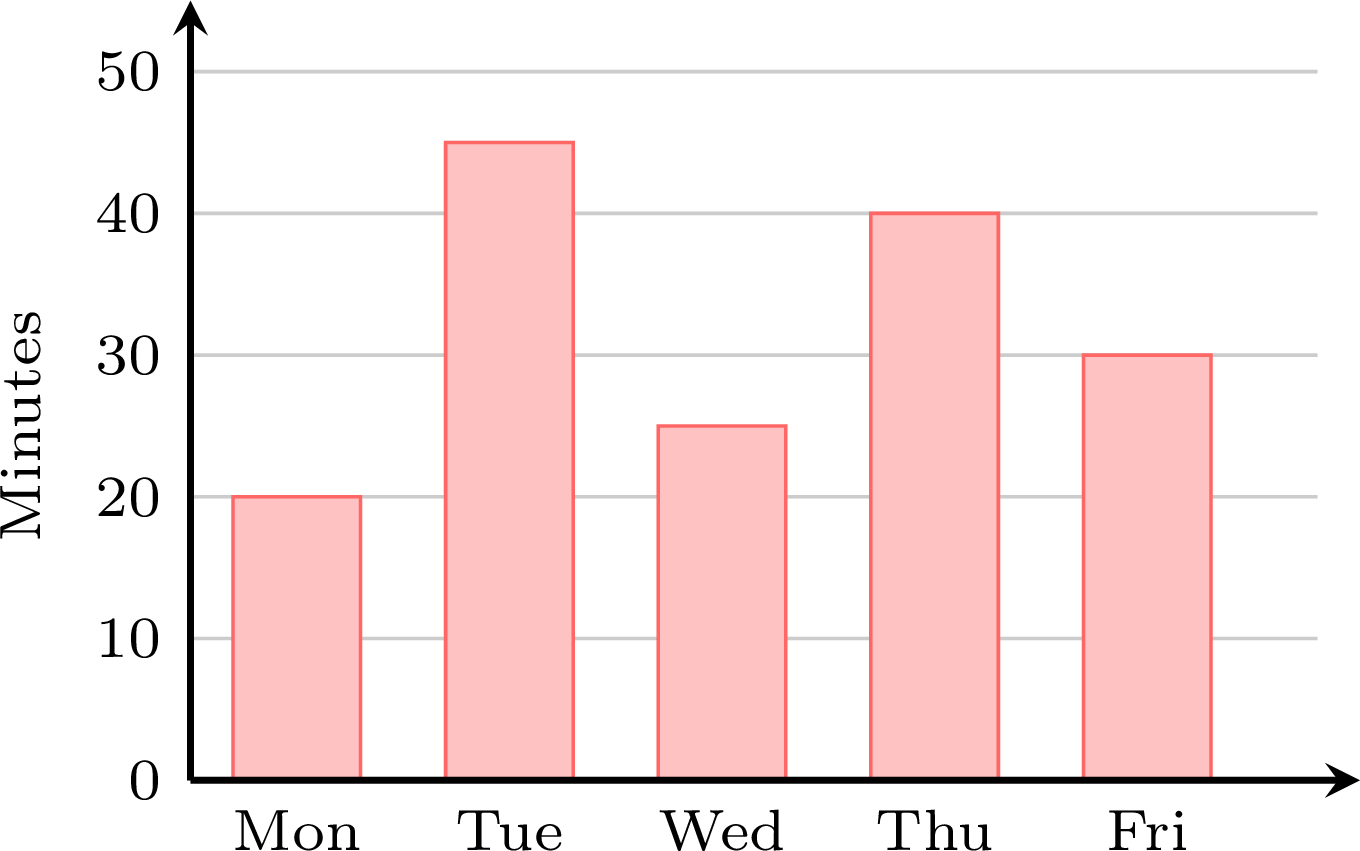
Skills to practice
- Reading a Spreadsheet
- Predicting What a Formula Shows
- Writing and Checking Formulas
IX
Going further
Skills to practice
- Conducting a Full Investigation
- Solving Two-Step Problems with Charts
- Quiz
Jump to section