International Baccalaureate · PYP 4
Data Handling
I
Survey Questions
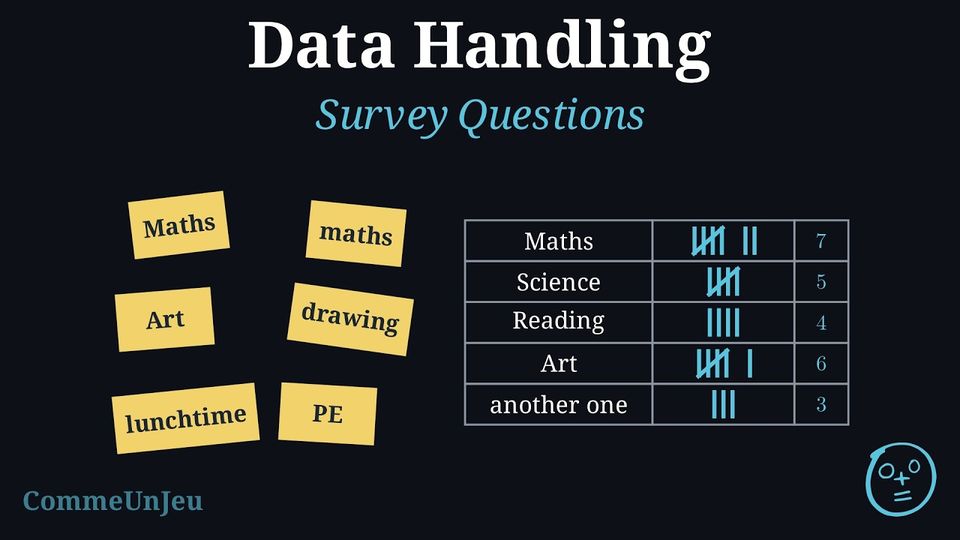
Definition — Open and Closed Questions
When we plan a survey, the type of question shapes the answers we collect. - A closed question offers a fixed set of answers to choose from (for example: yes/no, or a list of options). Its answers are easy to count and to put in a table.
- An open question lets people answer in their own words. Its answers are rich but harder to sort and count.
Definition — Rating Scale
A rating scale is a closed question whose answers are put in order, to measure how much the people who answer like something. A common example offers five answers, in this order: “dislike a lot”, “dislike a little”, “it's okay”, “like a little”, “like a lot”. Because the options are ordered, the bars of the bar chart keep that order, from one end of the scale to the other, and the results can be compared. Method — Writing a Good Survey Question
Before asking a survey question, we check it on five points. - It is clear: everyone understands it in the same way. “Which fruit do you like best?” is clear; “What do you think about food?” is too vague to answer.
- It asks one thing at a time: “Do you like apples and bananas?” asks two things at once, and a “yes” does not say which one. We ask two questions instead.
- It does not push towards an answer: “Don't you agree that football is the best sport?” pushes people to say “yes”. “What is your favourite sport?” leaves every answer free.
- Its answers can be counted: a list of choices, or a scale from “dislike a lot” to “like a lot”, gives answers that go straight into a tally chart.
- It has an “Other” box: when the list of choices may miss someone's answer, we add “Other: …”. Then everyone can answer, and every answer is counted once.
Skills to practice
- Asking Good Survey Questions
- Writing and Judging Survey Questions
II
Sorting Larger Numbers and Shapes
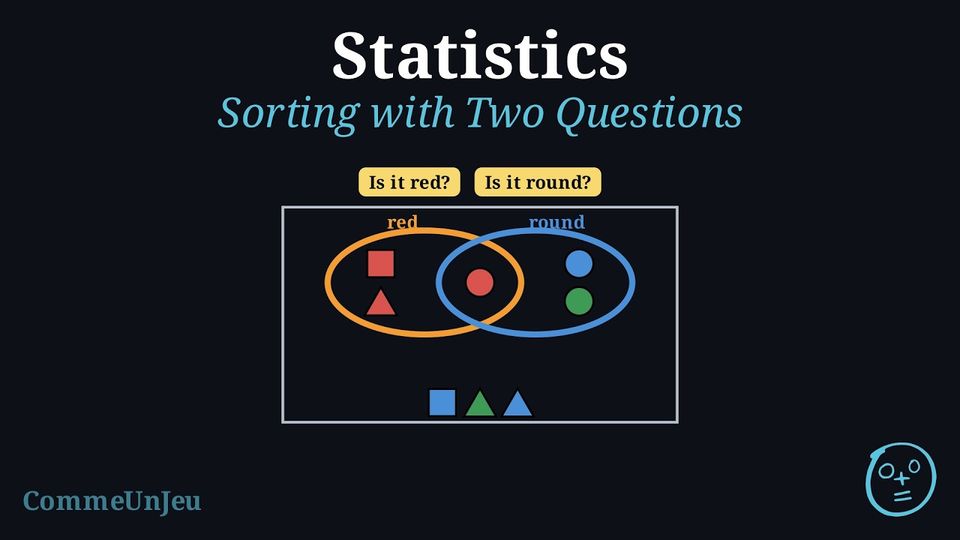
Method — Placing an Object with Two Questions
- Ask the first question, then the second: each object gets two answers.
- Find its place from the two answers:
- yes and yes: the overlap, or the box where both properties meet;
- yes and no: inside the first loop only, or the box “first property, not the second”;
- no and yes: inside the second loop only, or the box “second property, not the first”;
- no and no: outside both loops, or the box of neither property.
- Check: every object is placed once, and the four groups together hold all the objects.
Skills to practice
- Sorting Larger Numbers and Shapes
III
Scaled Pictographs and Line Plots
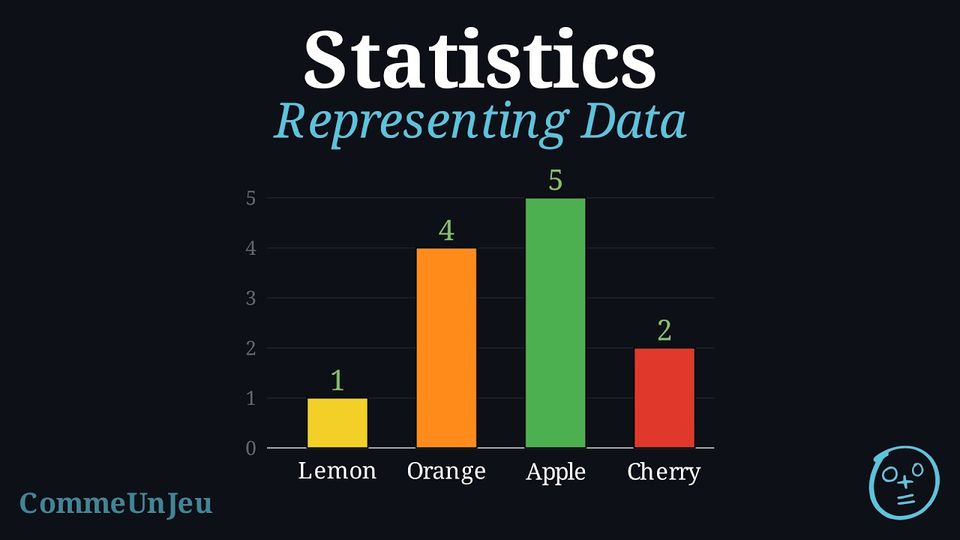
Example
When the numbers are large, the key can stand for more items. This pictograph shows how many books four classes read, where one picture is worth 5 books. 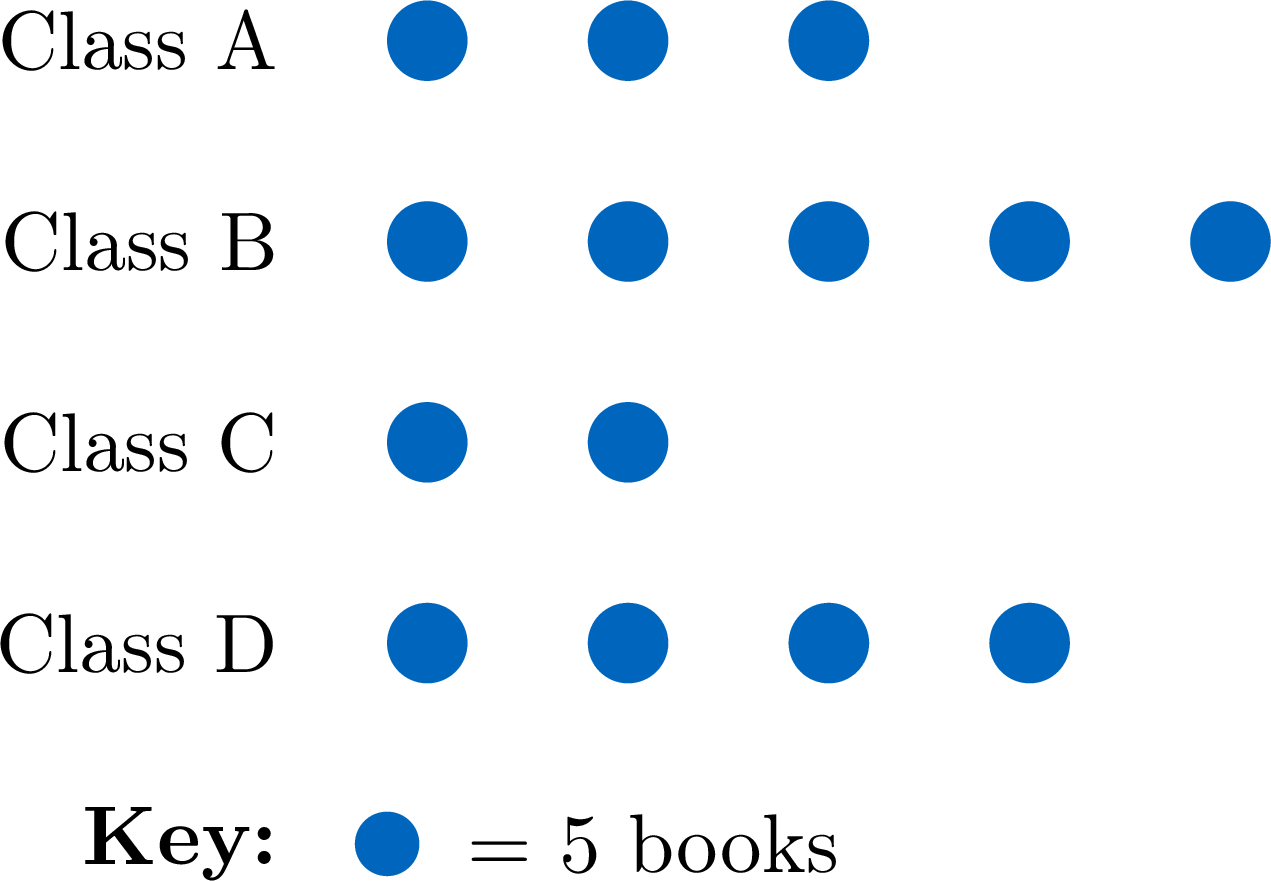
- Class A read \(3 \times 5 = \mathbf{15}\) books.
- Class B read the most: \(5 \times 5 = \mathbf{25}\) books.
- Altogether the four classes read \(15 + 25 + 10 + 20 = \mathbf{70}\) books.
Example
A class of 20 students recorded how many books each read last month. The line plot below shows the results. 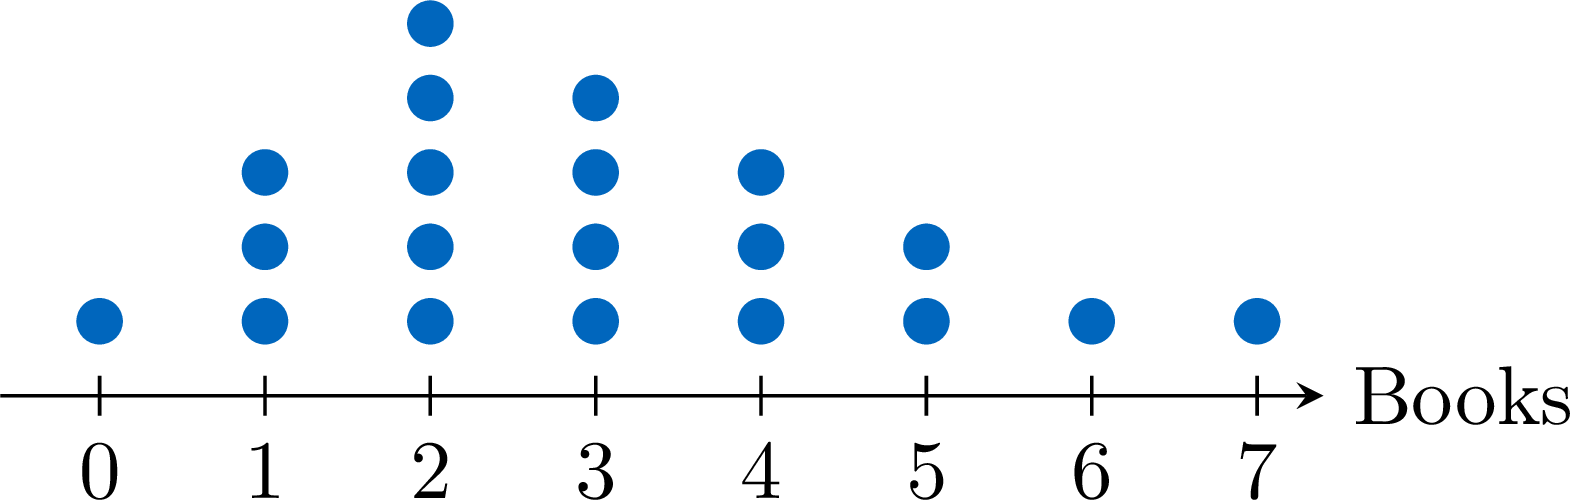
- The most common number of books read is 2 (the tallest stack: 5 students).
- Adding the dots gives \(1+3+5+4+3+2+1+1 = \mathbf{20}\) students in all.
Skills to practice
- Reading Scaled Pictographs, Rating-Scale Charts and Line Plots
IV
The Mode
Definition — The Mode
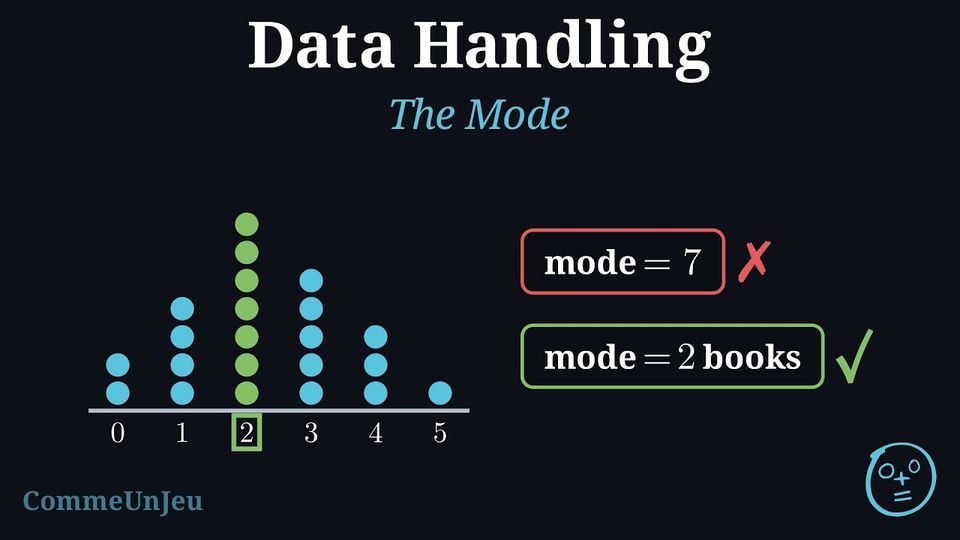
A class records how many books each child read last month. On the line plot of these data, the tallest stack is above \(2\): reading \(2\) books is the most common answer. This most common value has a name.The mode of a set of data is the value, or the category, that occurs most often.
- The mode is a value of the data (a number of books, a pet, a colour), never the number of times it occurs.
- When some values are tied for the biggest count and the other values occur less often, each tied value is a mode: with two tied values, the data has two modes.
- When every value occurs the same number of times, even if there are only two values, no value is more common than the others: the data has no mode.
Method — Finding the Mode
- From a list: count how many times each value occurs (a tally chart helps), then choose the value with the biggest count.
- From a tally chart or a table: choose the row with the biggest total.
- From a bar chart: choose the tallest bar. From a line plot: choose the tallest stack.
- Answer with the value, not with its count: the mode is “dog”, not “7”.
- Look for a tie: two values with the biggest count, the others occurring less often, give two modes; the same count for every value gives no mode.
Example
Fifteen children say how many pets they have at home: $$1,\ 0,\ 2,\ 1,\ 3,\ 1,\ 0,\ 2,\ 1,\ 4,\ 2,\ 1,\ 0,\ 1,\ 2.$$ Find the mode of these data.
We count each value with a tally chart, one mark for each child.
Check: \(3 + 6 + 4 + 1 + 1 = 15\) children. The biggest total is \(6\), for the value \(1\). The mode is 1 pet: having one pet is the most common answer. The answer is not \(6\): \(6\) is the number of children who gave that answer.
| Pets | Tally Marks | Total |
| \(0\) |  | 3 |
| \(1\) | 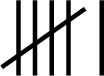 | 6 |
| \(2\) |  | 4 |
| \(3\) |  | 1 |
| \(4\) | | 1 |
Example
A class votes for its favourite sport. 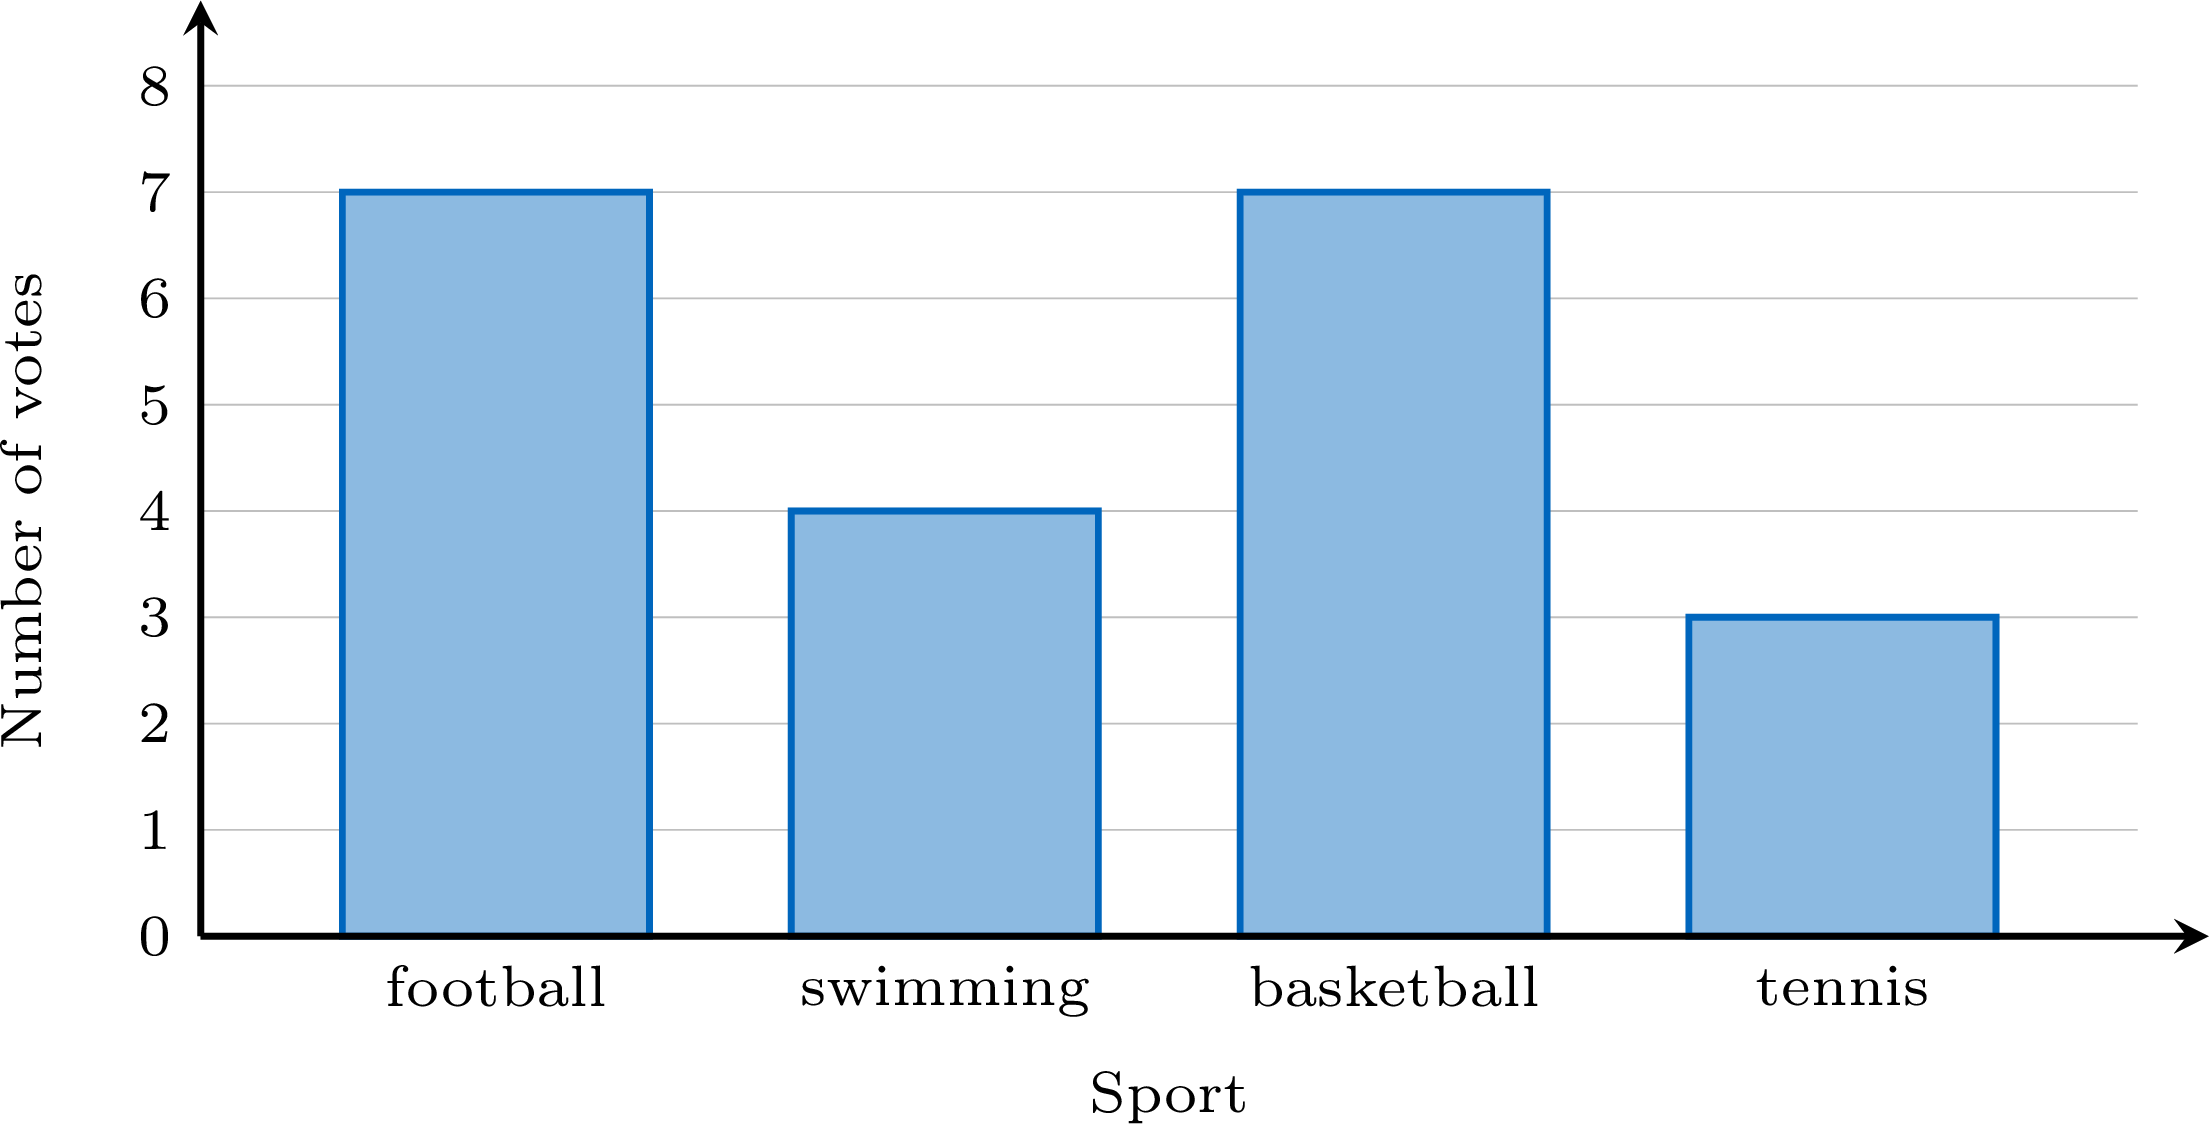
Two bars are the tallest, and both reach \(7\): football and basketball. They are tied for the biggest count, so the data has two modes: football and basketball. If each sport had received the same number of votes, the data would have no mode.
Skills to practice
- Recognising the Mode
- Finding the Mode
V
Points on a Graph and the Curve
Definition — A Point for Each Measurement
To show how a quantity changes, we draw two lines that cross: one horizontal and one vertical. Each one carries what it measures, written along it — here the months of the year across, and the temperature up. Together they make a graph. On the upright line the numbers are written every five, and each small square is worth one degree. Each measurement becomes one point: go across to its month, go up to its temperature, and mark the place where the two meet. Careful: this point is not one of the stacked dots of a line plot — each one here carries two readings at once, the month and the temperature. 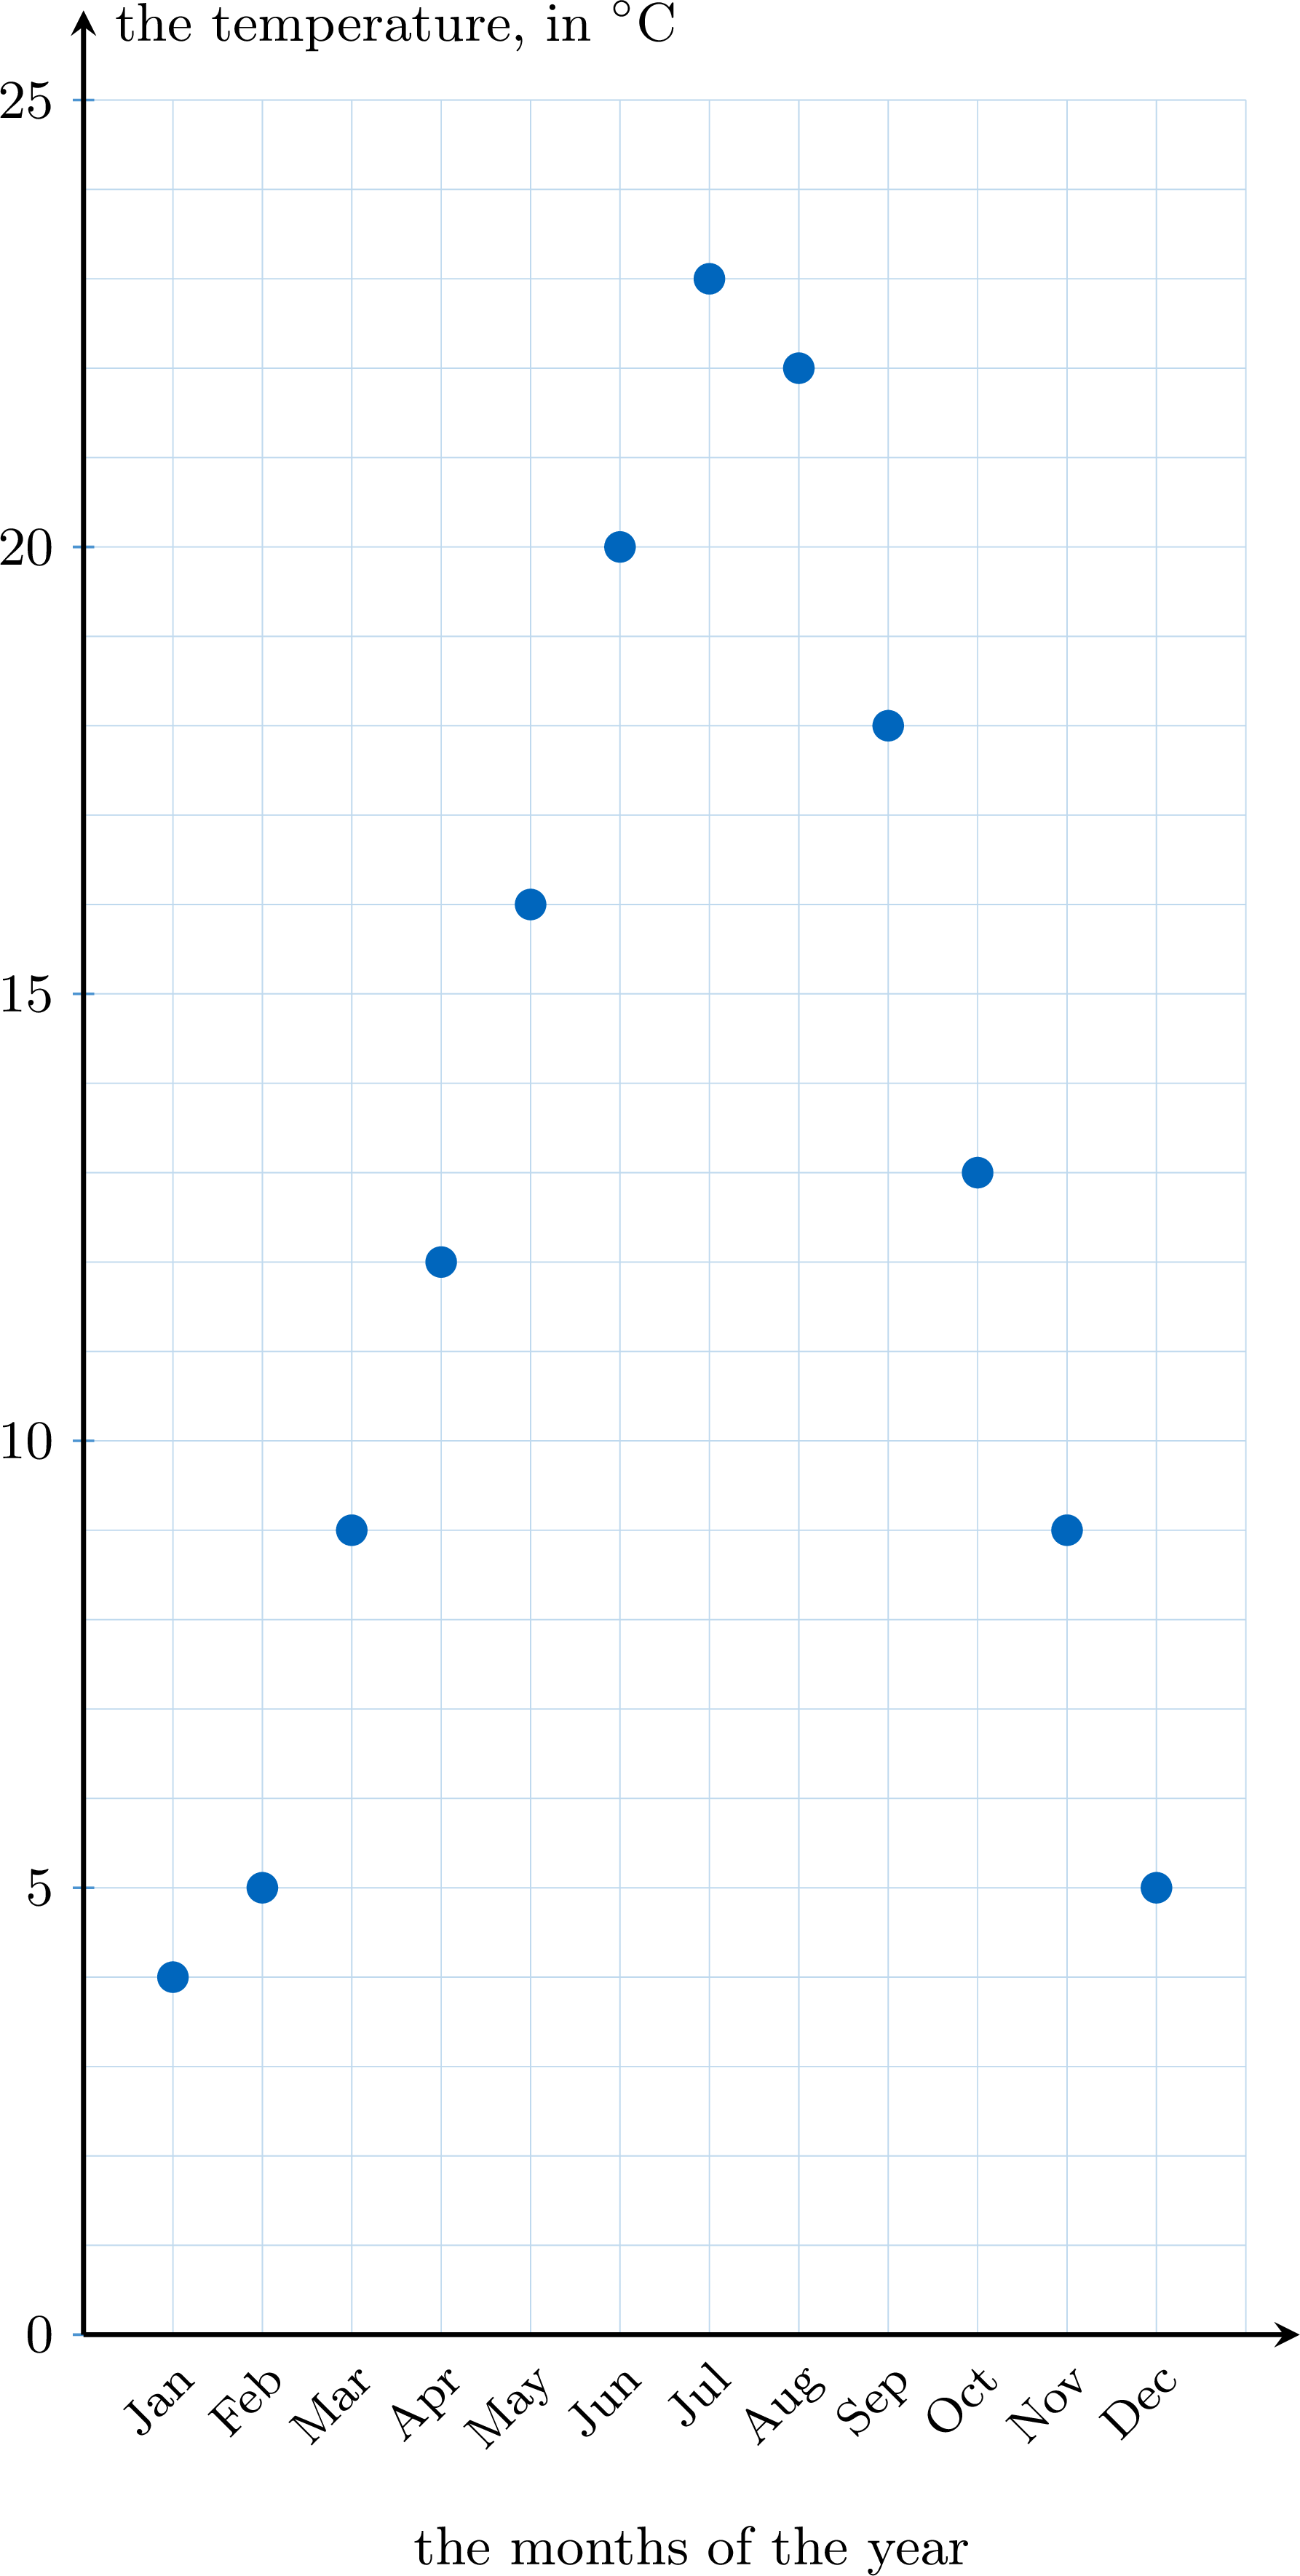
Method — Placing the Points, then Drawing the Curve
- Read the table one measurement at a time. For each one: find its place on the horizontal line, go straight up to its value on the vertical line, and mark the point.
- Join the points in order, from left to right, with straight segments. What you obtain is the curve.
- Check one point back: pick one of the points you placed, read its two values, and find those same two values in the table.
Example
Here are six measurements. How do we turn them into points on a graph? | Month | Jan | Feb | Mar | Apr | May | Jun |
| Temperature (\(^\circ\)C) | 4 | 5 | 9 | 12 | 16 | 20 |
One measurement, one point. For January: go across to January, then up to \(4\), and mark. For February: across to February, up to \(5\), mark. And so on for the six columns of the table. Then join them from left to right — and the curve rises, because the temperature rises from winter to summer. 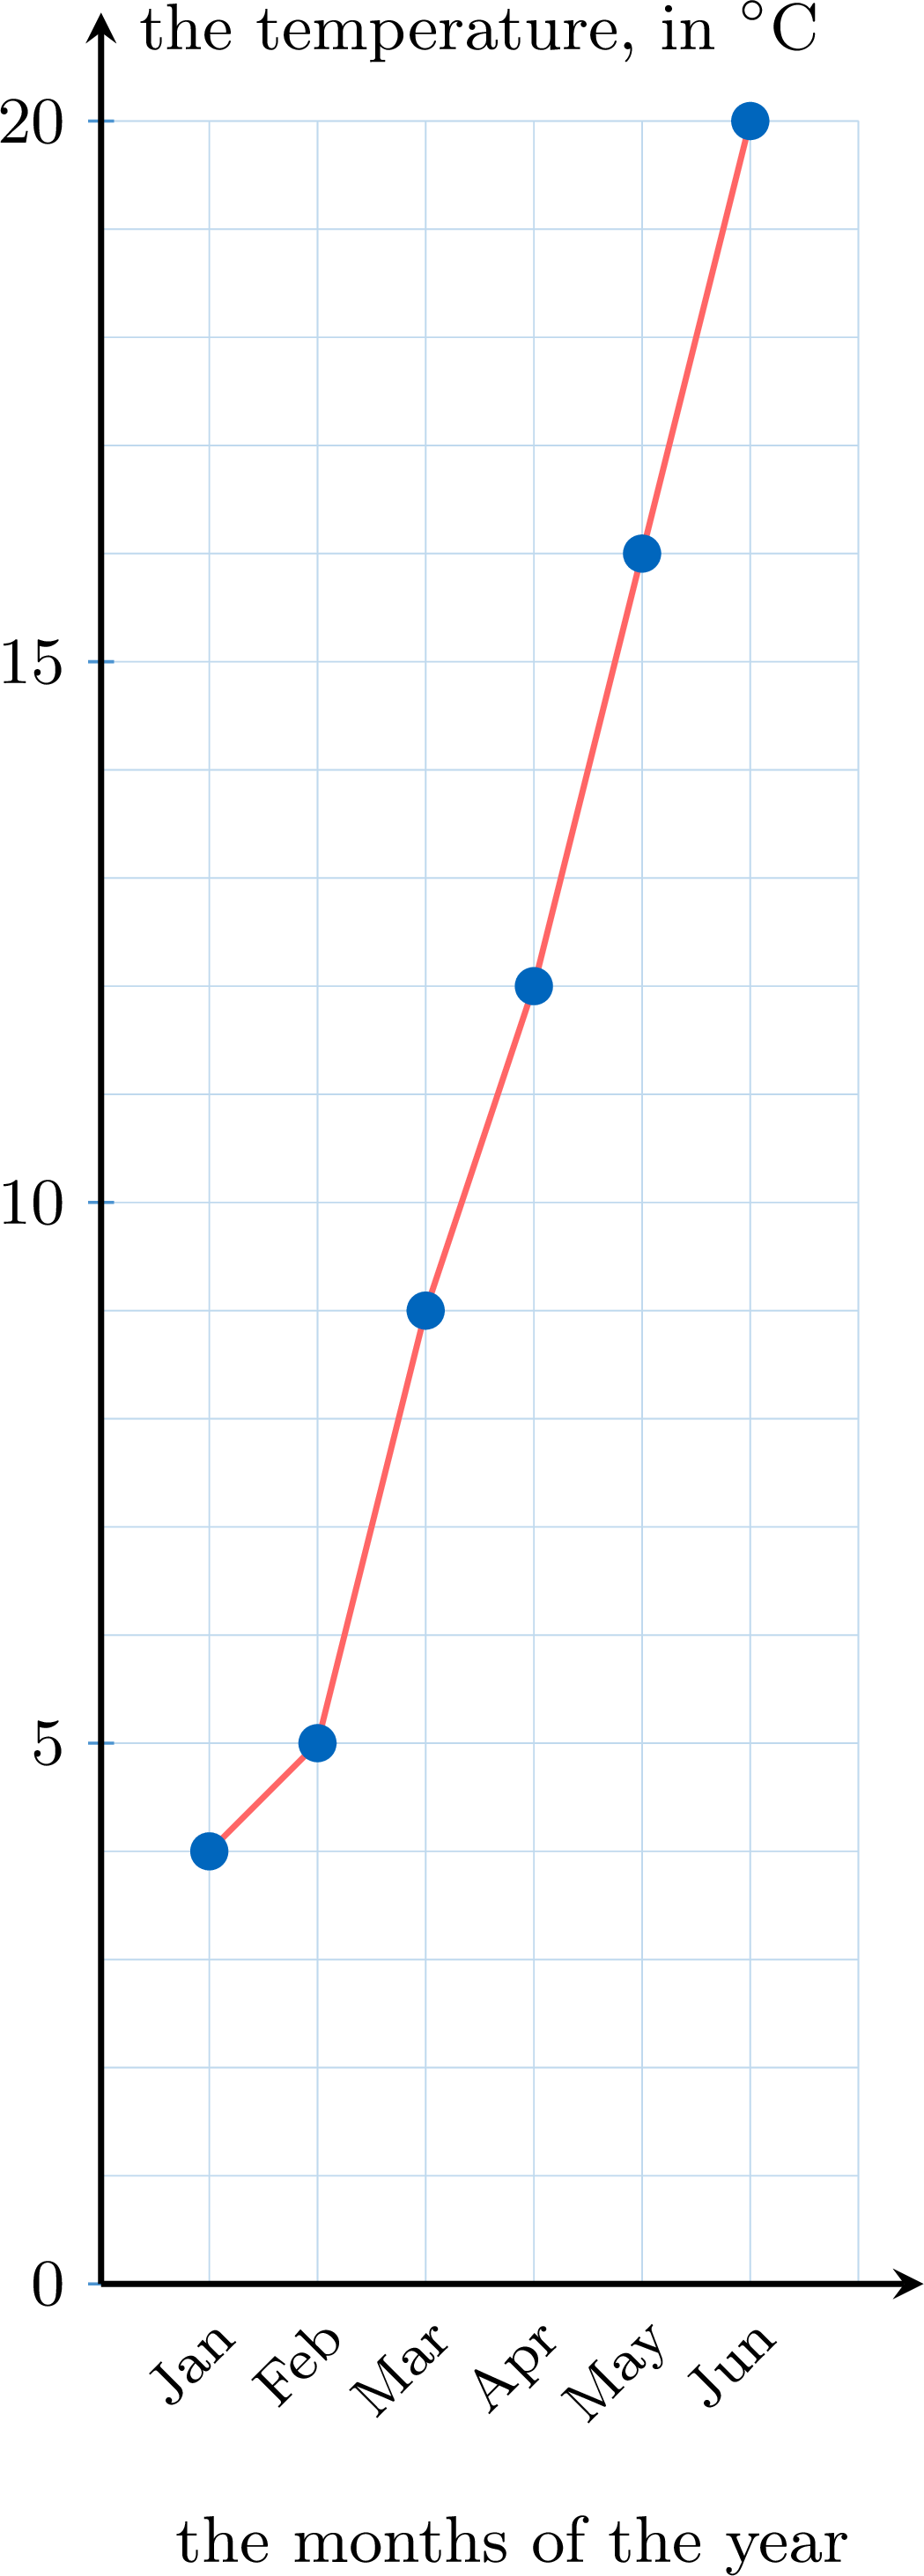
Proposition — What the Curve Shows, and What It Does Not
The points alone already say every measurement. Joining them adds something the points do not show at a glance: the shape of the change — where it rises, where it falls, where it turns round. 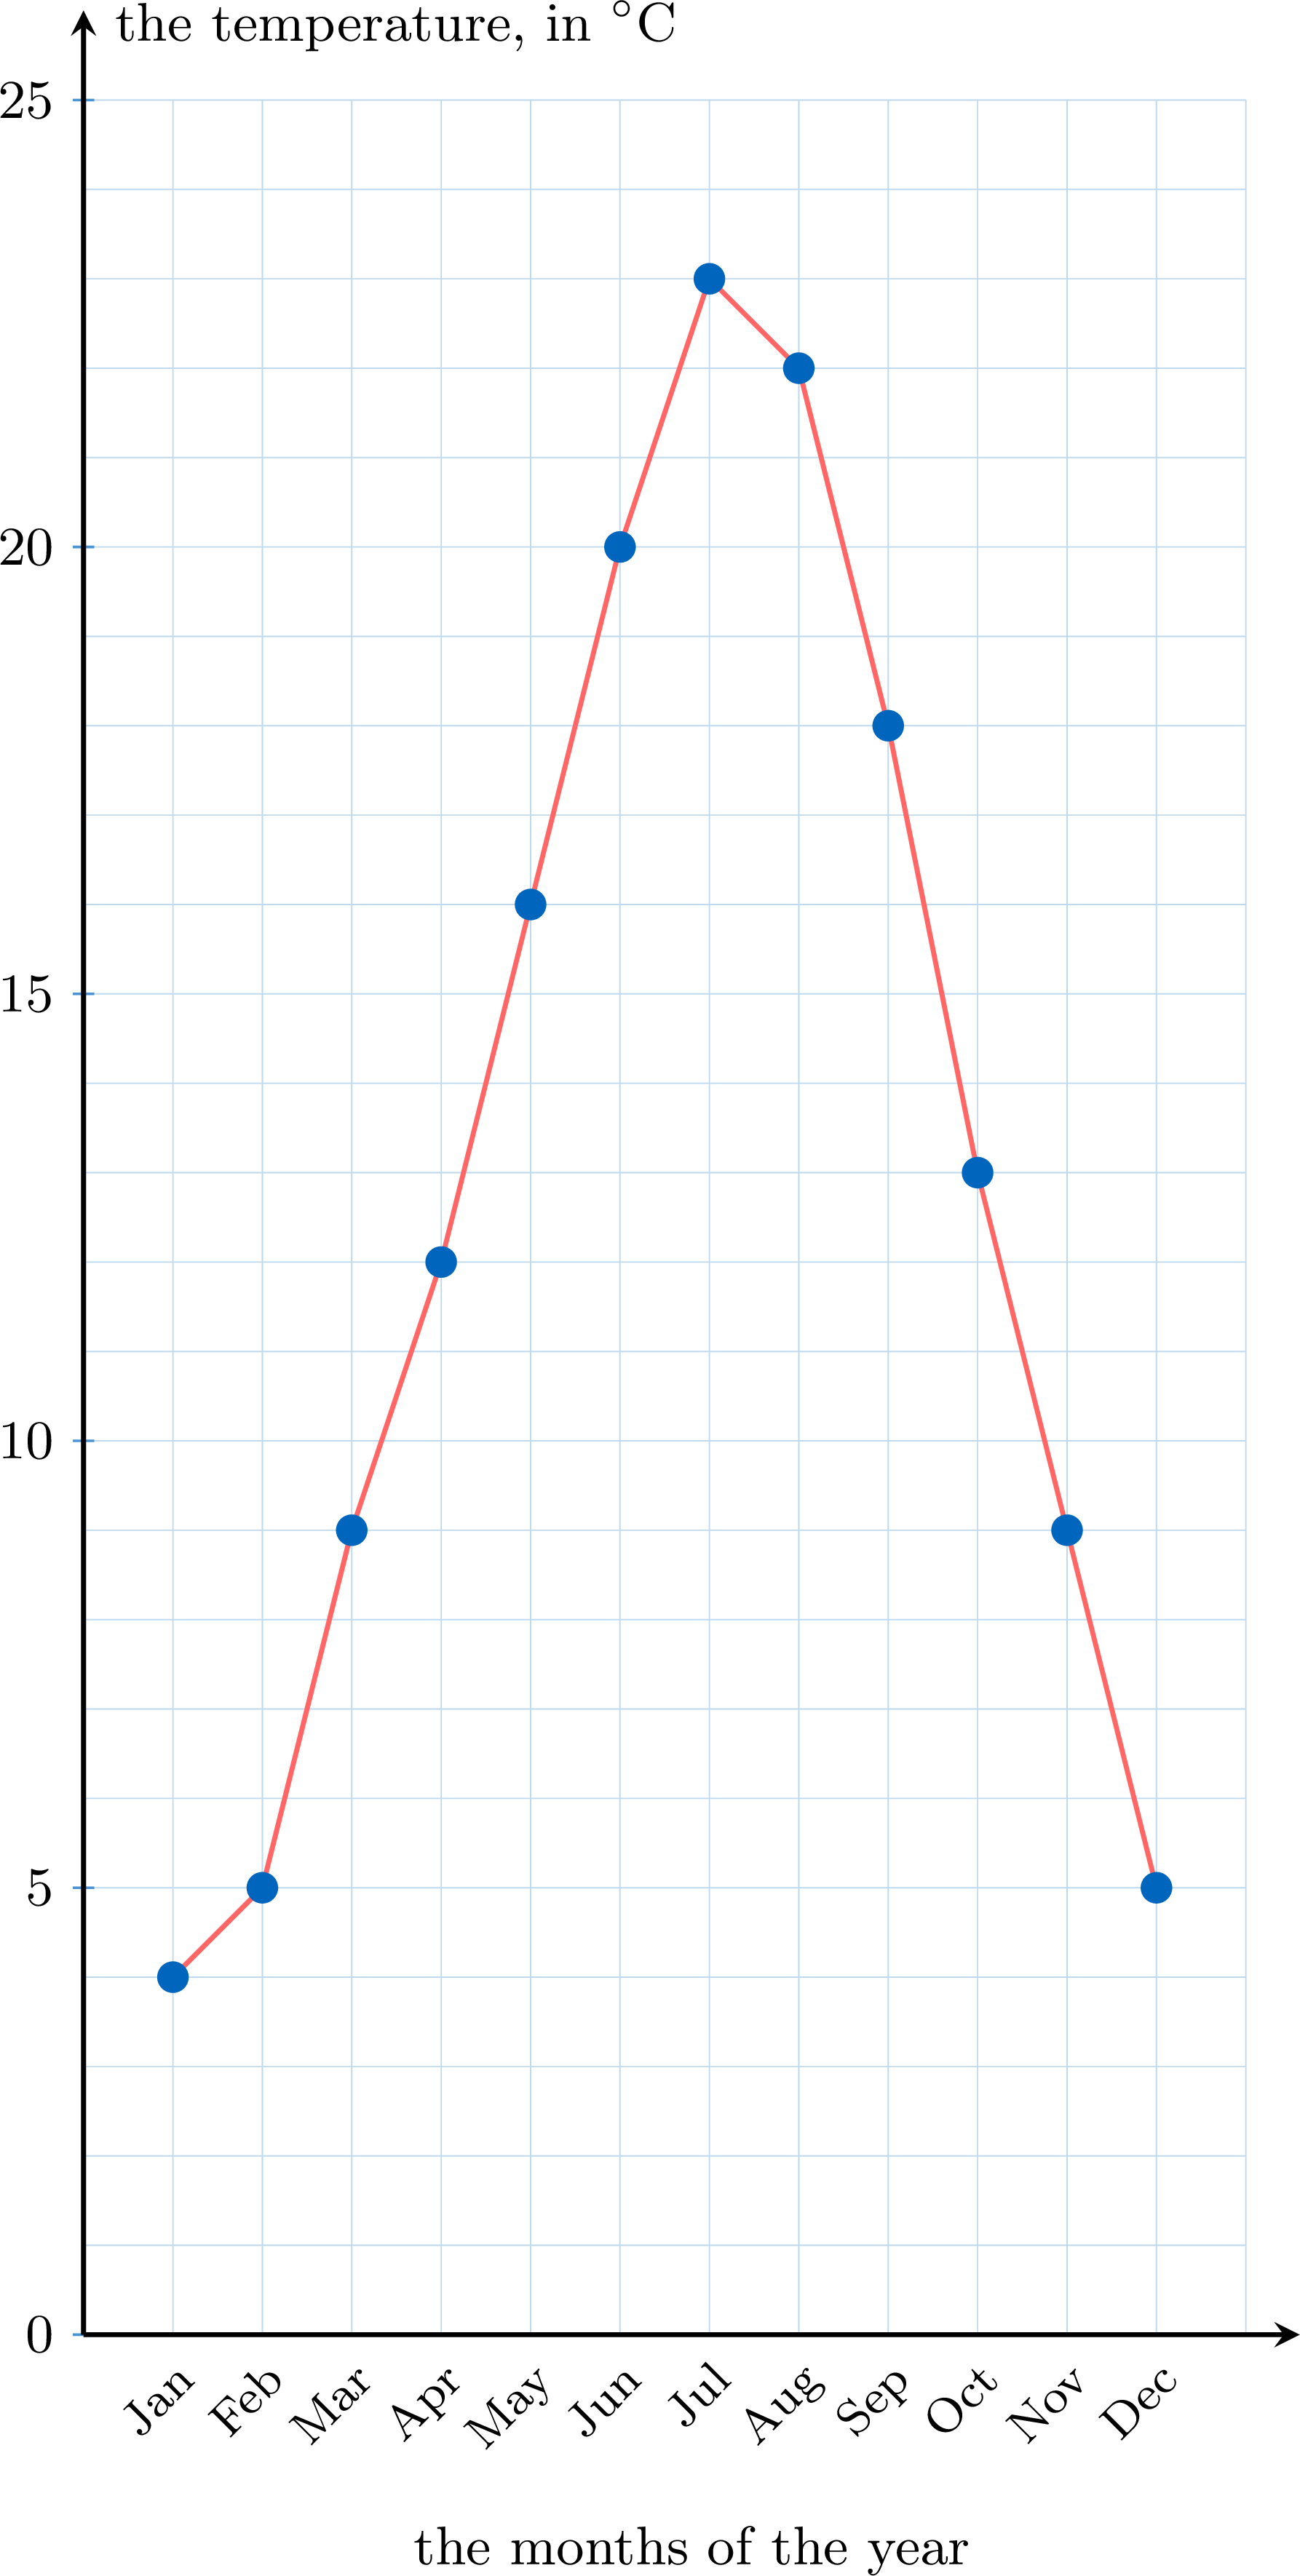
Example
On this curve, in which month was the highest temperature recorded, and what was it?
The highest temperature was recorded in July: \(23\) \(^\circ\)C. We read it in two moves: the highest point of the curve, then straight down to the horizontal line for the month, and straight across to the vertical line for the temperature. Notice that the curve rises from January to July and falls afterwards — that shape is what the points alone did not show at a glance. 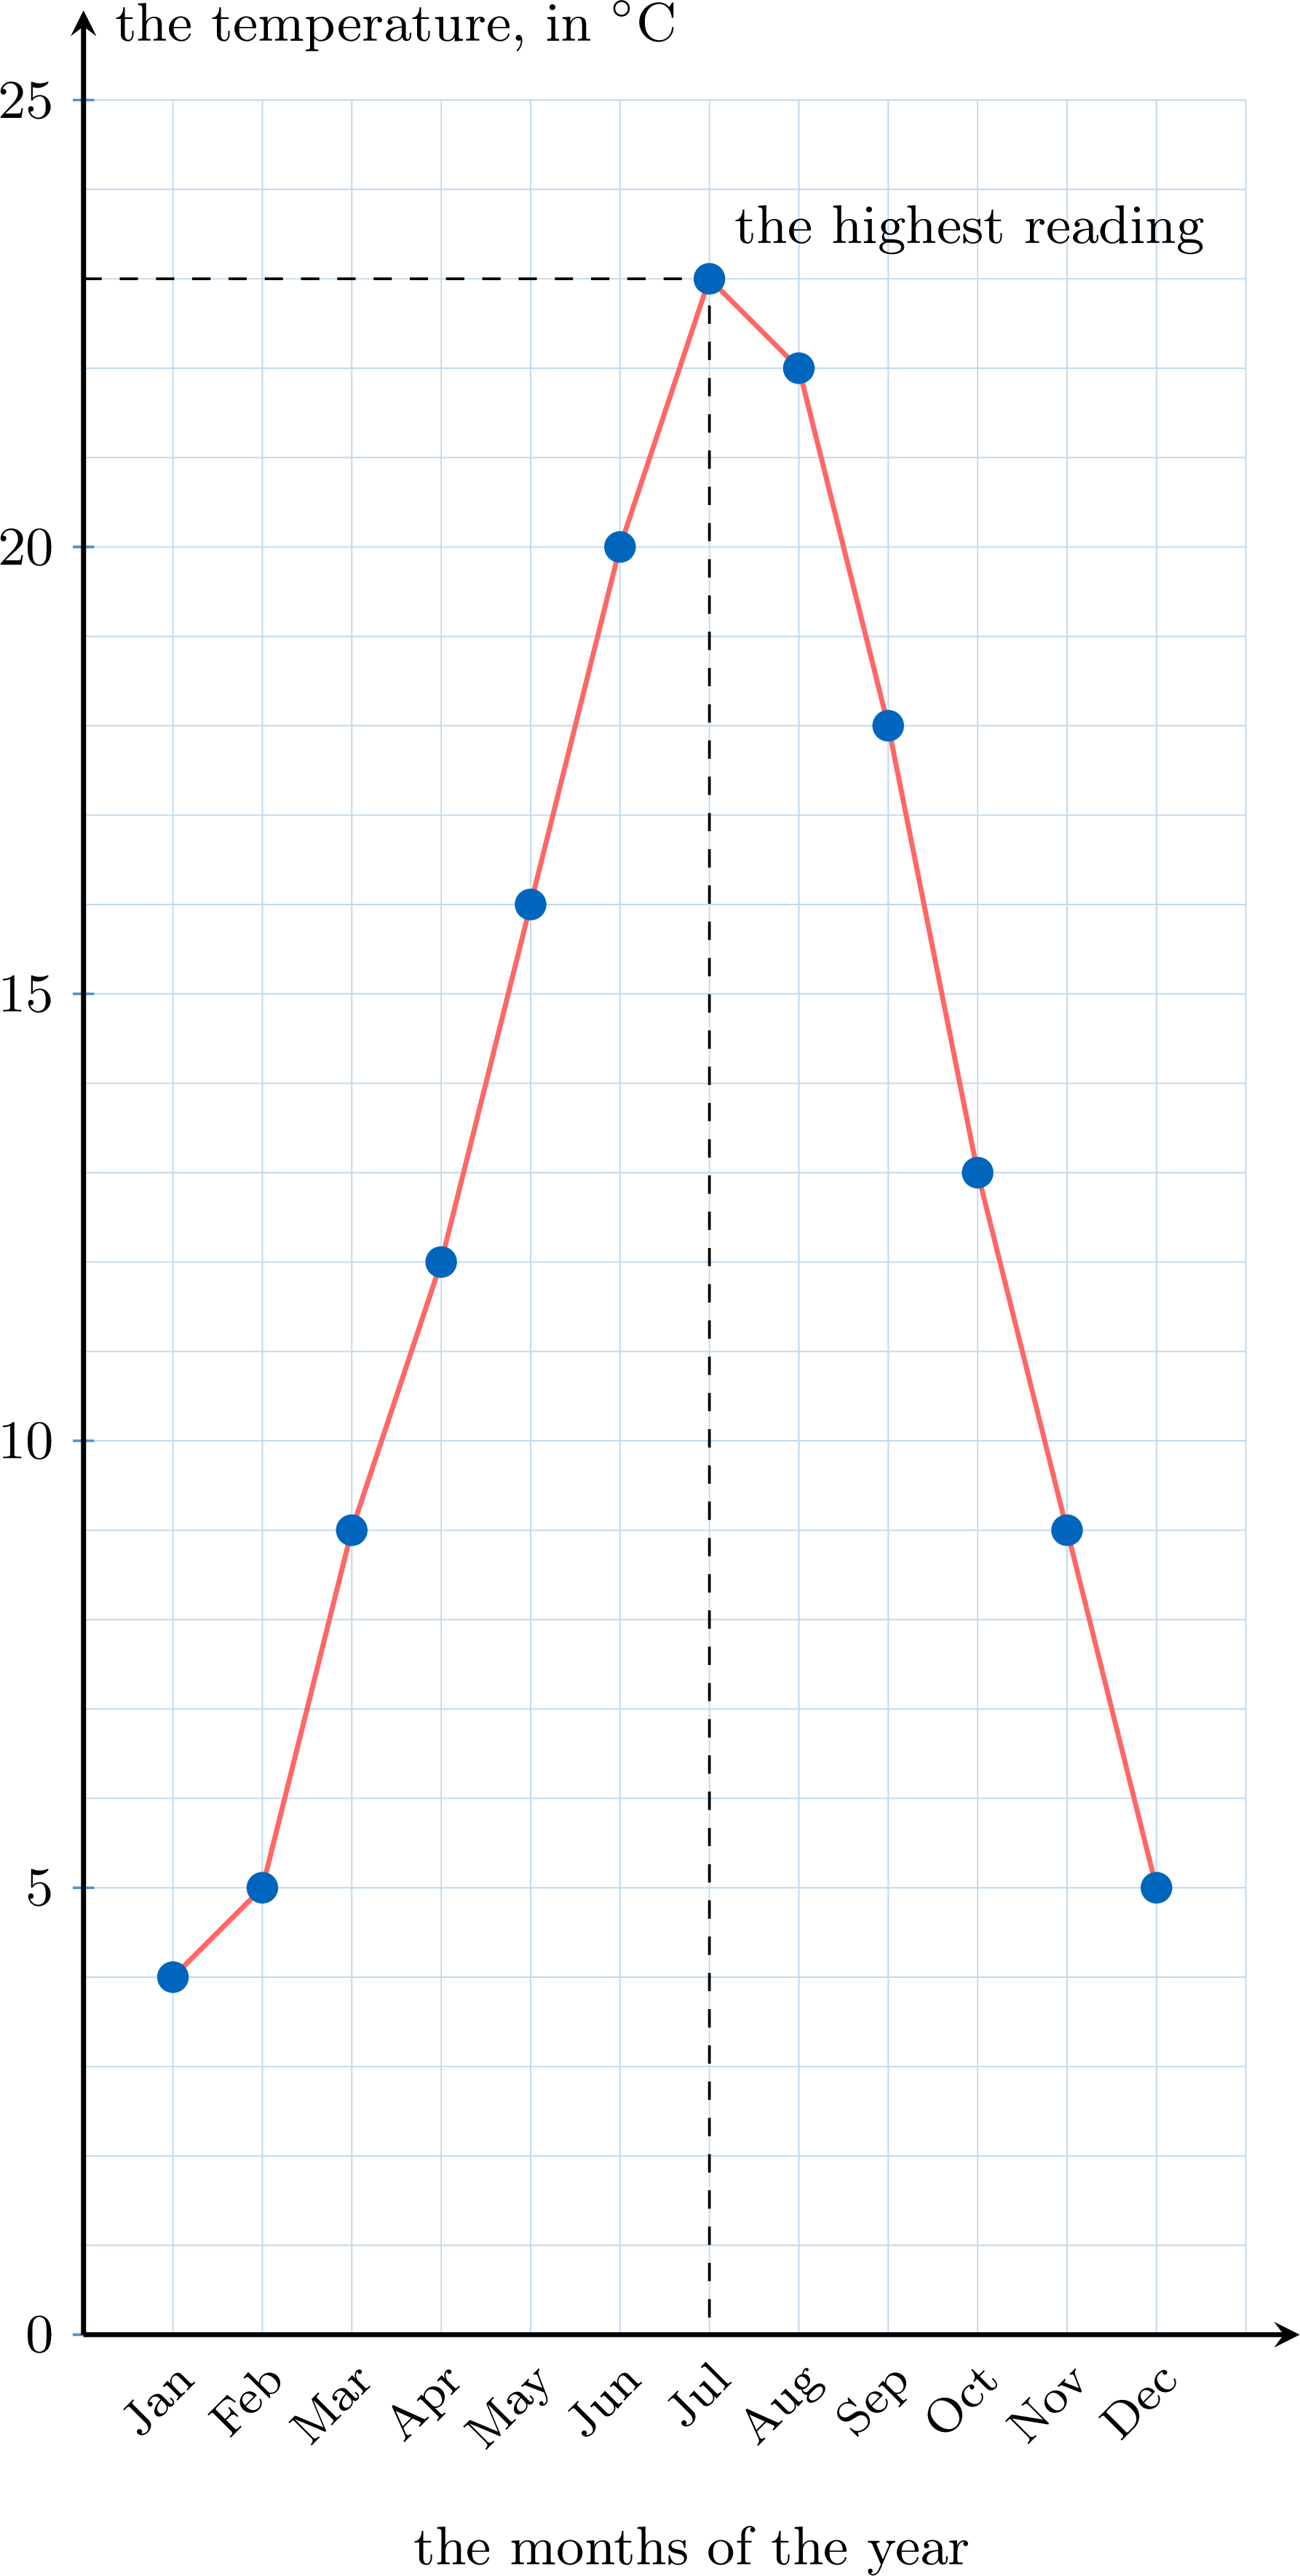
Skills to practice
- Reading a Curve
- Placing the Points and Drawing the Curve
VI
Going further
Skills to practice
- Running a Full Investigation
- Quiz
Jump to section