International Baccalaureate · MYP 2
Coordinates and Straight-Line Graphs
I
Plotting the Points of a Table
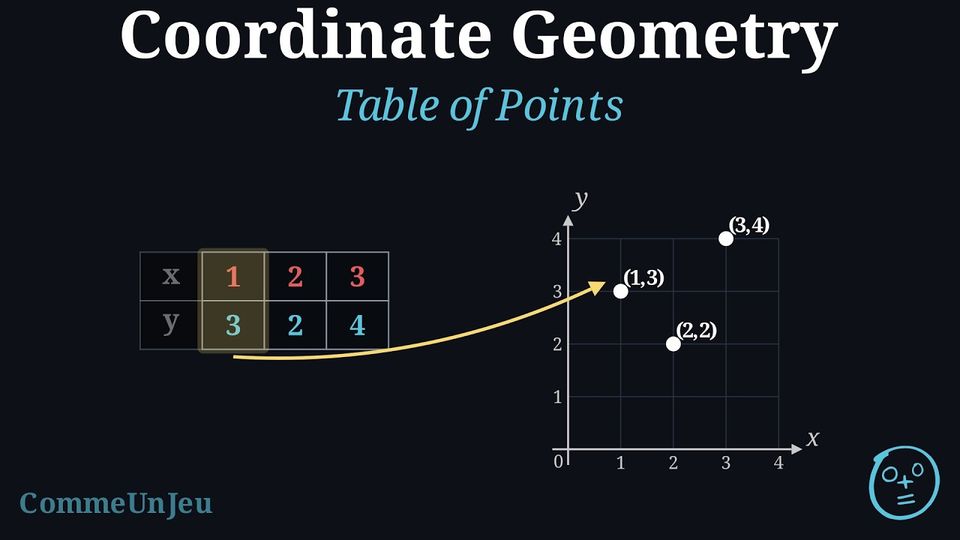
Definition — Coordinates of a Point
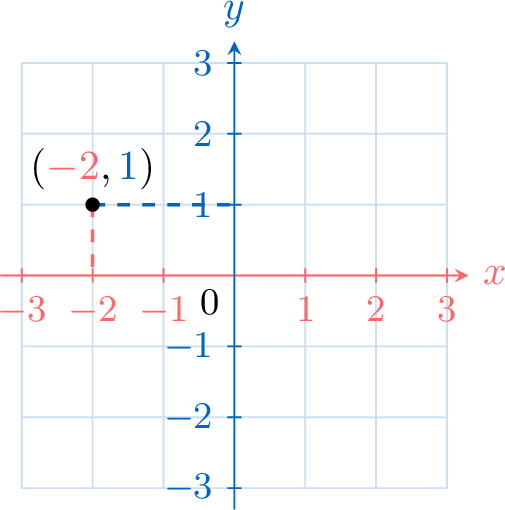
The coordinates of a point are an ordered pair of numbers (the order matters), written as \((x, y)\), where \(x\) is the \(x\)-coordinate and \(y\) is the \(y\)-coordinate: - The \(x\)-coordinate indicates the horizontal position along the \(x\)-axis, with positive numbers to the right of the origin and negative numbers to the left.
- The \(y\)-coordinate indicates the vertical position along the \(y\)-axis, with positive numbers above the origin and negative numbers below.
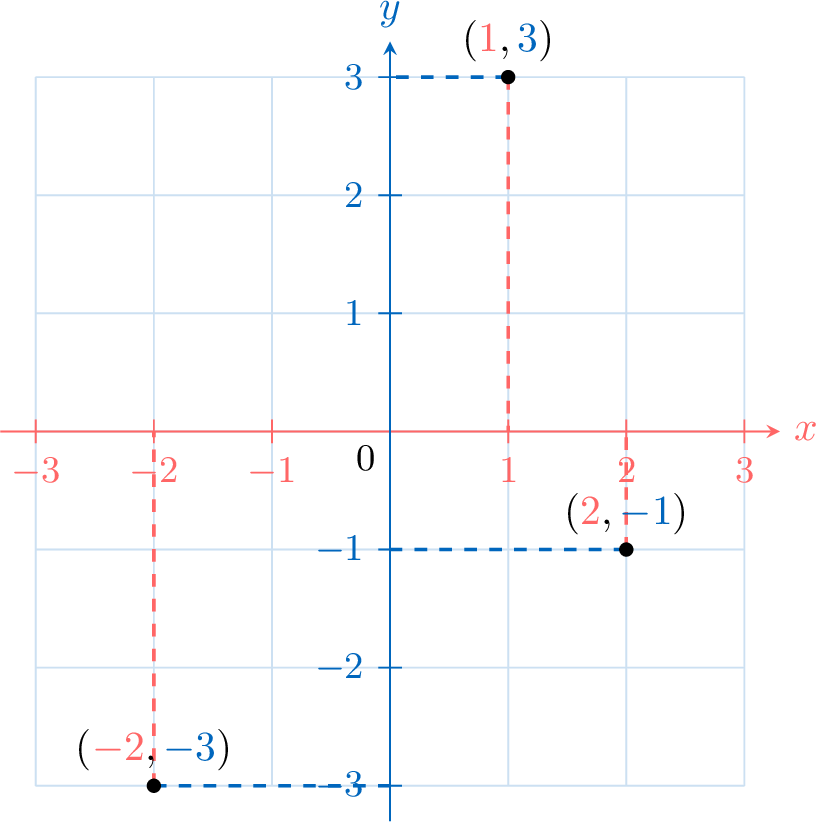
Definition — Table of Points
A table of points lists the coordinates of several points in a coordinate plane. - The first row represents the \(x\)-coordinates.
- The second row represents the \(y\)-coordinates.
Example
| \(\textcolor{colordef}{x}\) | \(\textcolor{colordef}{-2}\) | \(\textcolor{colordef}{1}\) | \(\textcolor{colordef}{2}\) |
| \(\textcolor{colorprop}{y}\) | \(\textcolor{colorprop}{-3}\) | \(\textcolor{colorprop}{3}\) | \(\textcolor{colorprop}{-1}\) |
Skills to practice
- Matching Tables and Graphs
- Filling a Table of Points from a Graph
- Plotting Points from a Table
II
Reading Values from a Graph
Example
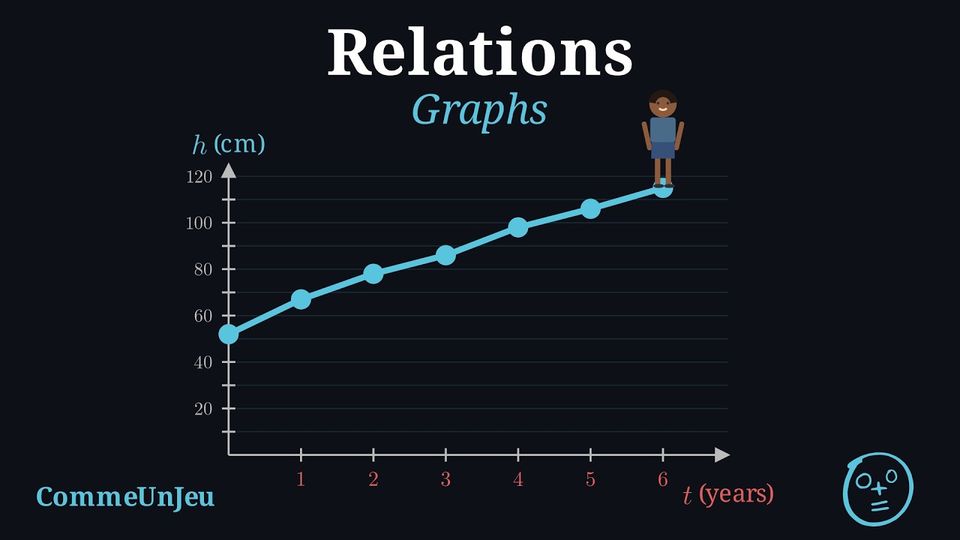
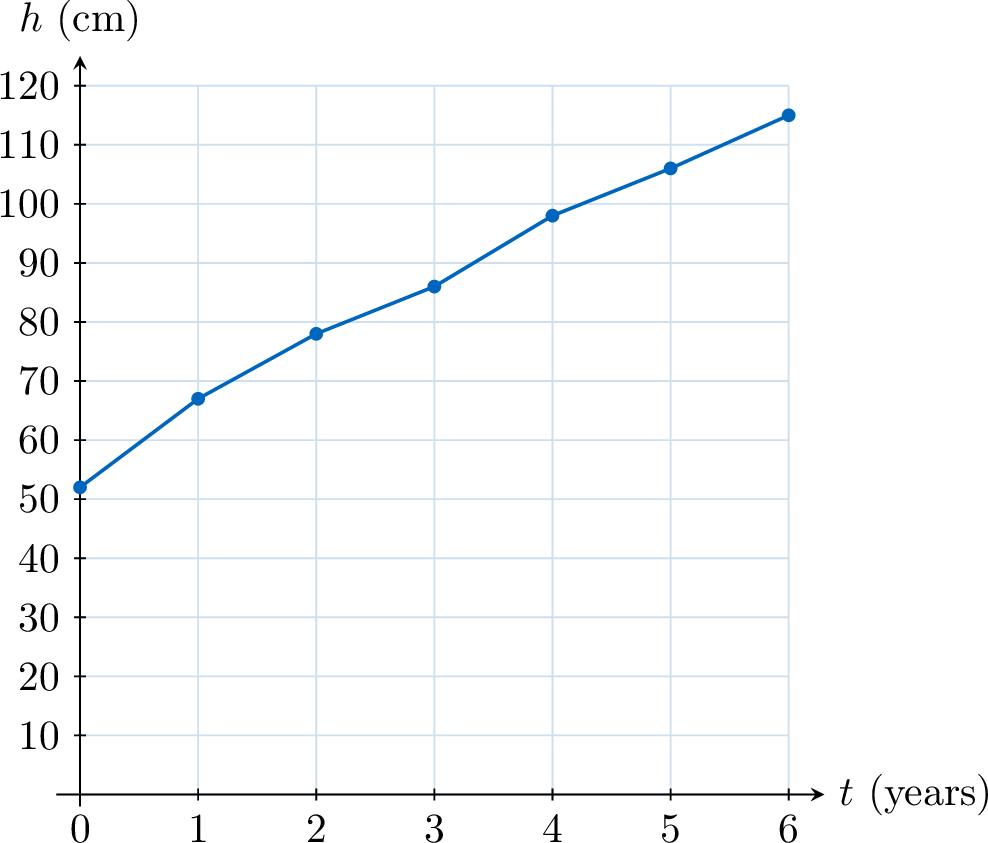
Plot the line graph of Hugo's height at each age, using the data below: | \(\textcolor{colordef}{t\text{ (years)}}\) | \(0\) | \(1\) | \(2\) | \(3\) | \(4\) | \(5\) | \(6\) |
| \(\textcolor{colorprop}{h\text{ (cm)}}\) | \(52\) | \(67\) | \(78\) | \(86\) | \(98\) | \(106\) | \(115\) |
- First, plot the points \((0,52)\), \((1,67)\), \((2,78)\), \((3,86)\), \((4,98)\), \((5,106)\), \((6,115)\) in a coordinate plane.
- Then, connect the points in order with straight line segments to form the line graph.
Method — Finding a Value on a Line Graph
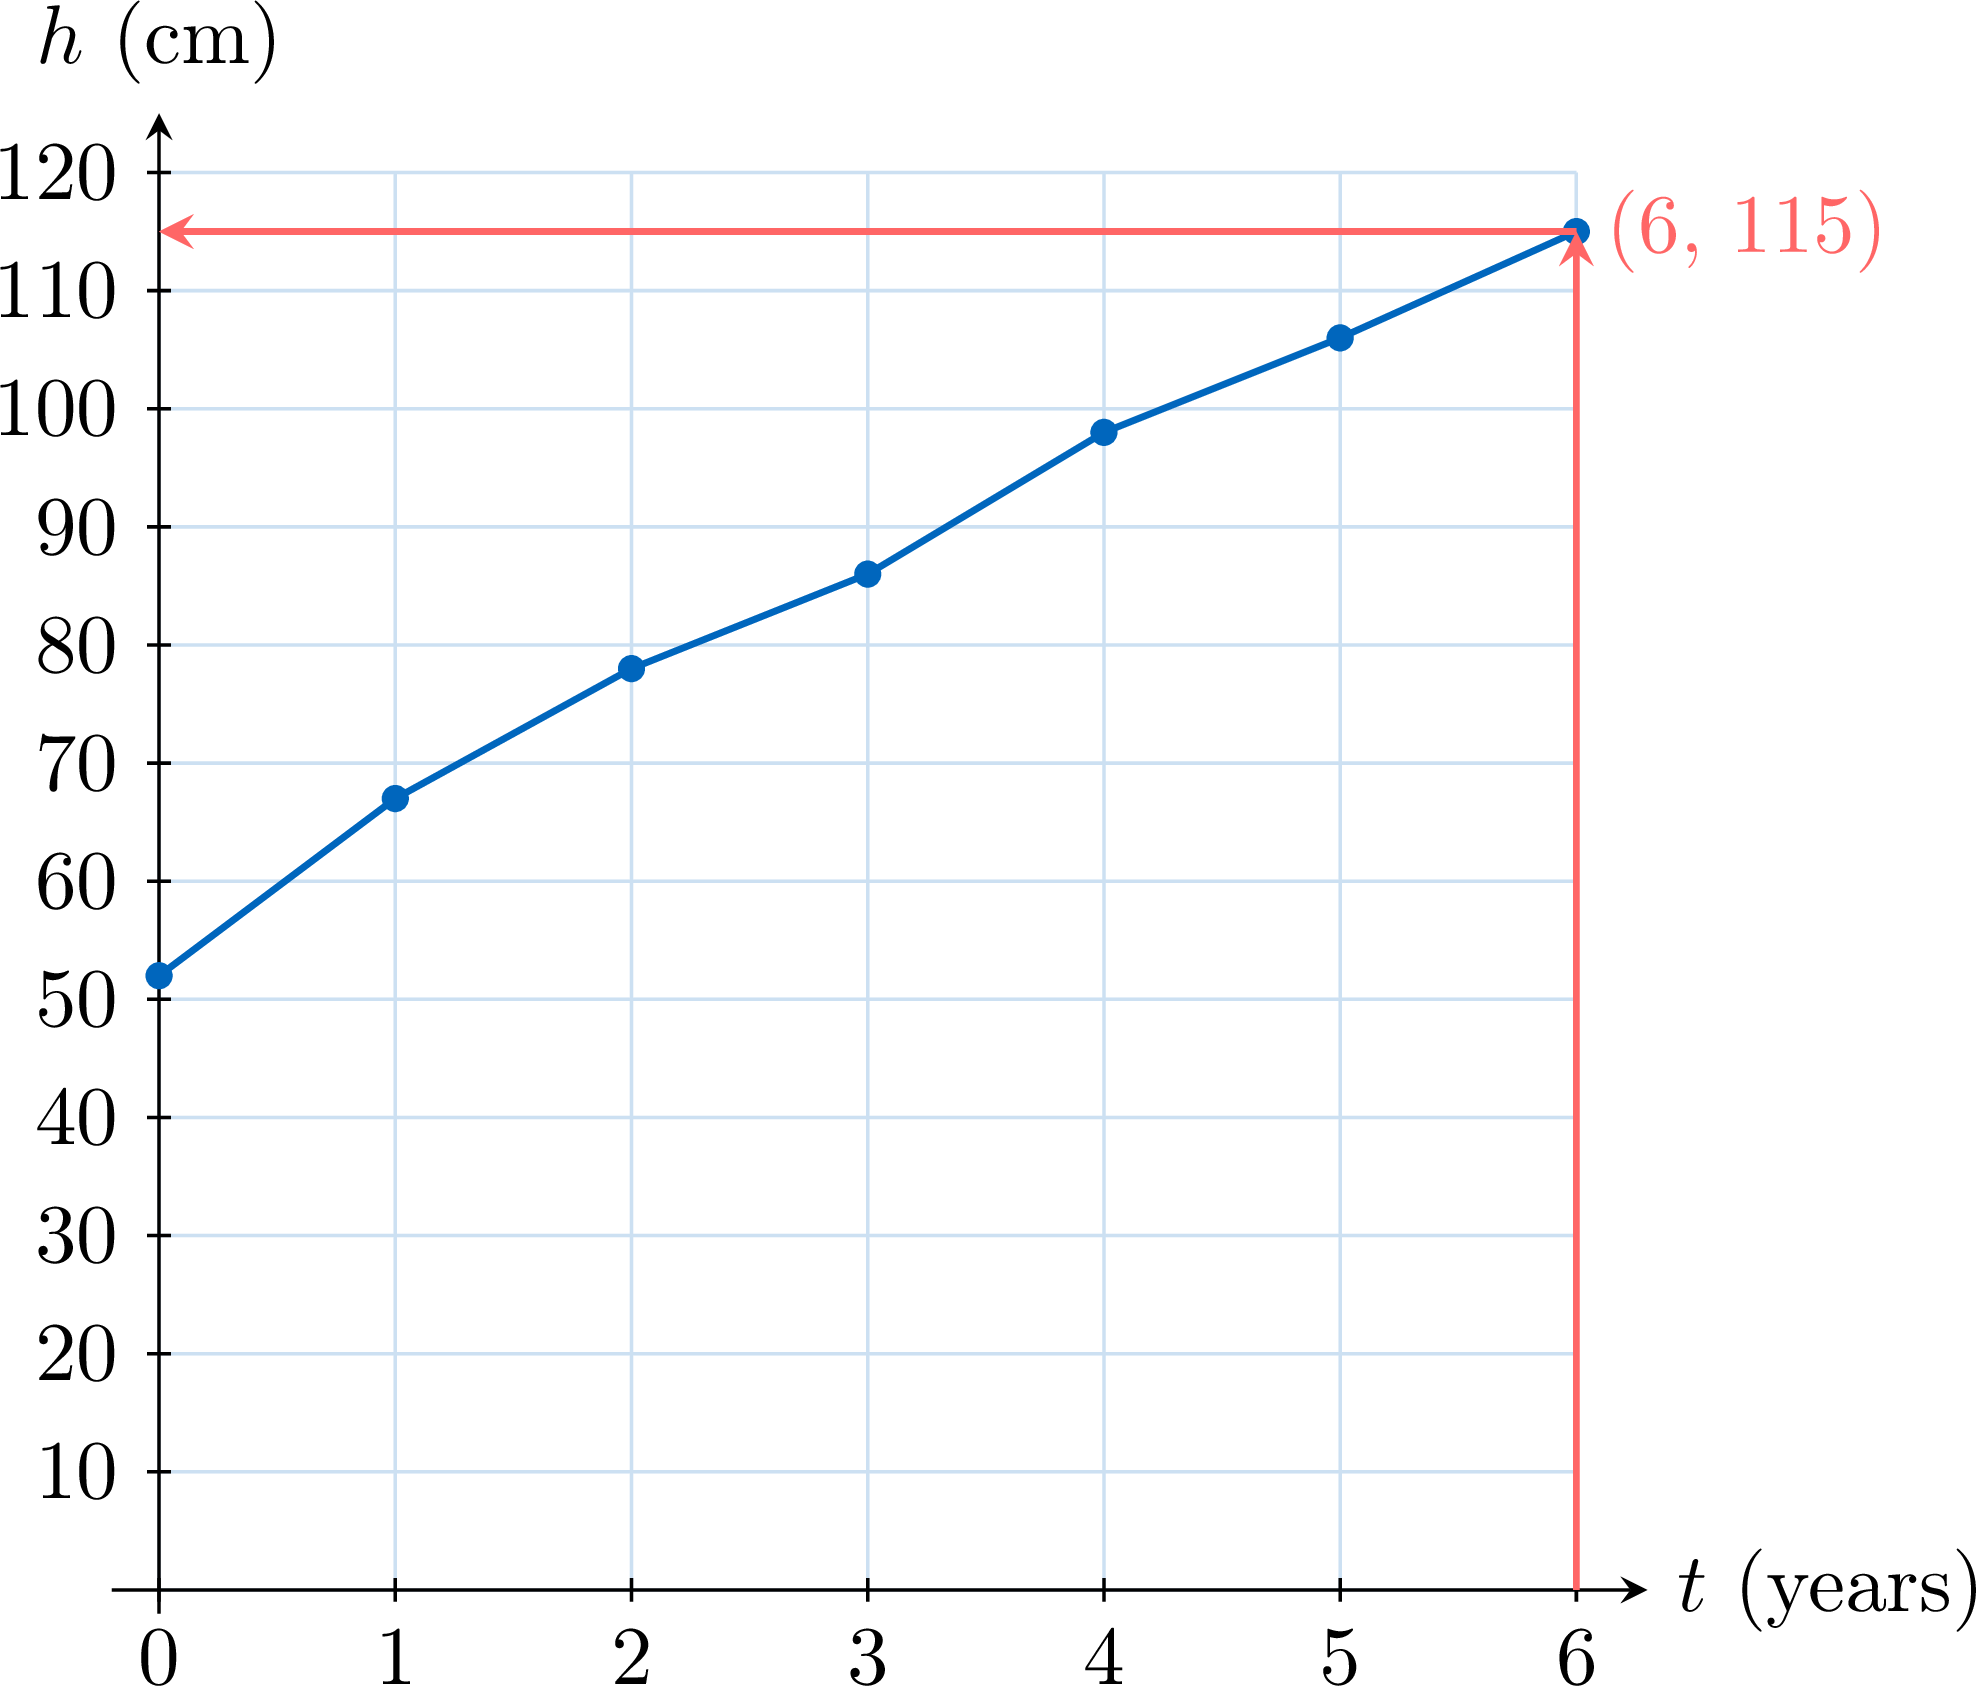
To read on a line graph the value that matches a value of the horizontal axis: - Locate the value on the horizontal axis. For example, to find Hugo's height at \(t=6\) years, find \(6\) on the \(t\)-axis.
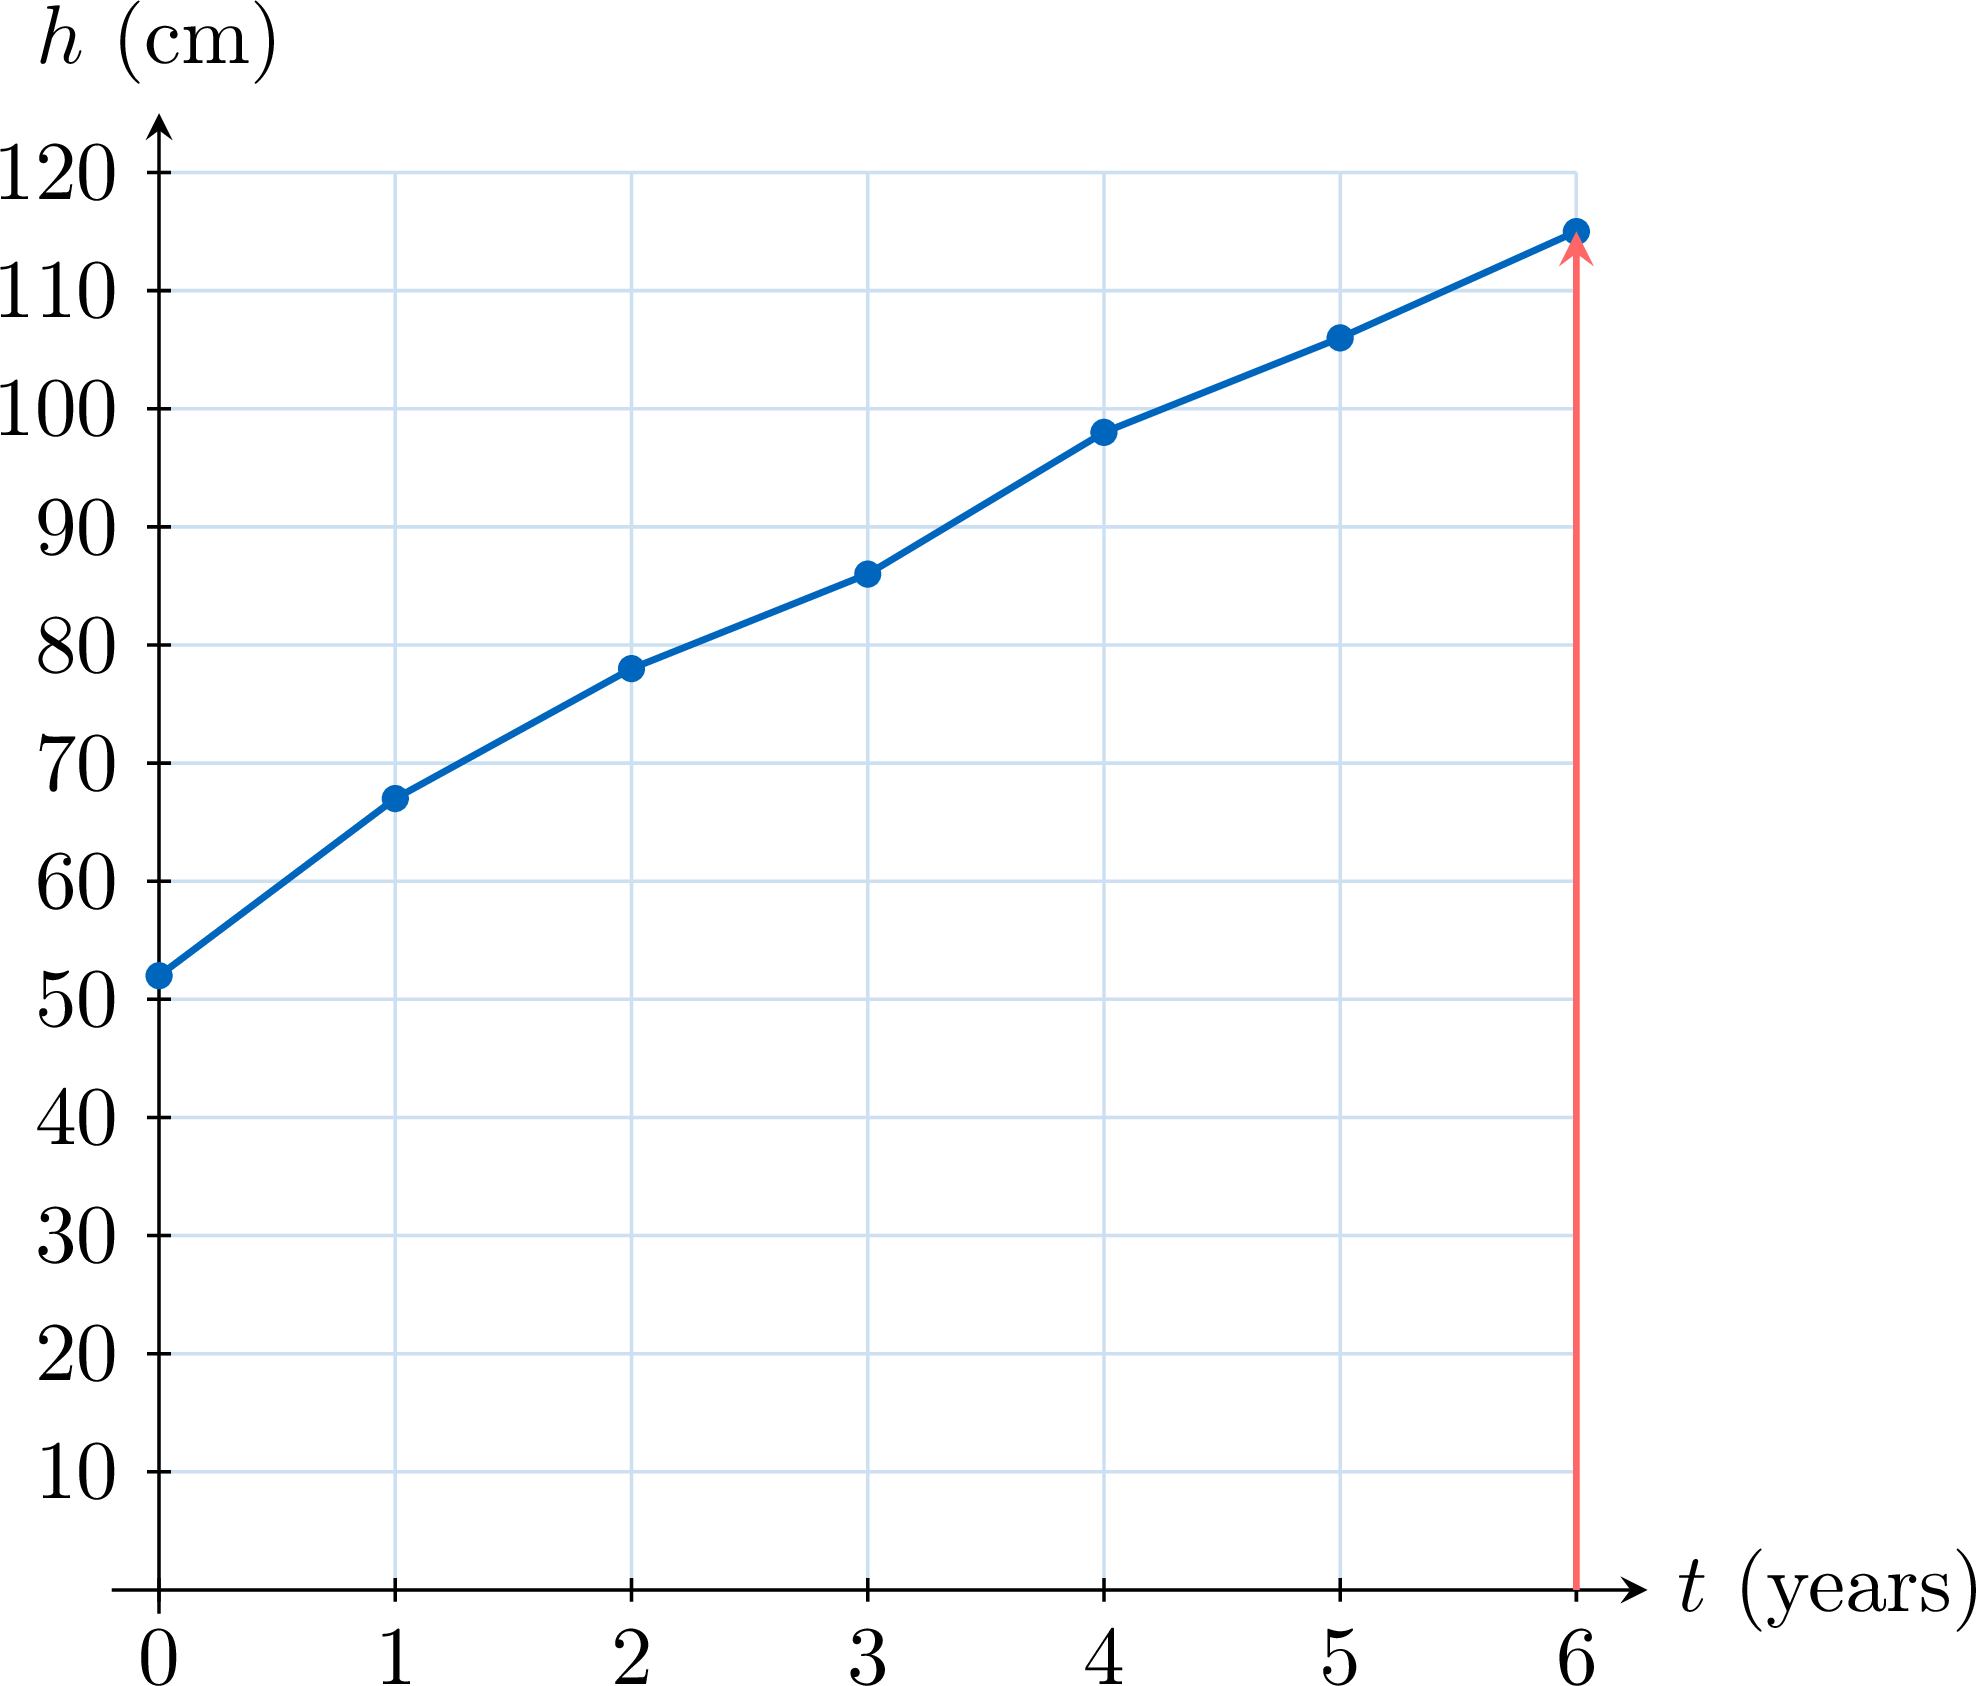
- Move vertically to the graph: draw a vertical line upward from this value until it meets the line graph.
- Read the value on the vertical axis: from the meeting point, move horizontally to the vertical axis and read the value there.
Skills to practice
- Reading Values from a Graph
III
Graphing a Line from a Table of Values
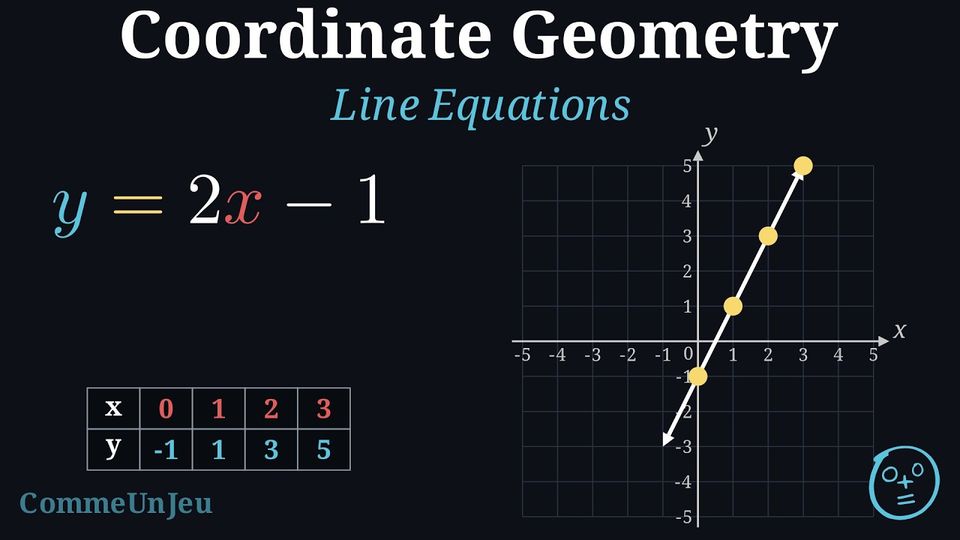
An equation like \(\textcolor{colorprop}{y}=2\textcolor{colordef}{x}-1\) describes a relationship between the variables \(\textcolor{colordef}{x}\) and \(\textcolor{colorprop}{y}\). For any value of \(\textcolor{colordef}{x}\) we choose, the equation tells us the corresponding value of \(\textcolor{colorprop}{y}\).
We can use this to find coordinates \((\textcolor{colordef}{x}, \textcolor{colorprop}{y})\) for points that satisfy the equation.
Each pair in the table, for example \((0,-1)\) or \((3,5)\), makes the equation \(\textcolor{colorprop}{y}=2\textcolor{colordef}{x}-1\) true. When we plot these points on a coordinate plane, we see they all lie on the same straight line. The equation \(\textcolor{colorprop}{y}=2\textcolor{colordef}{x}-1\) is the equation of this line, because it is true for every point on the line (and only for the points on this line). 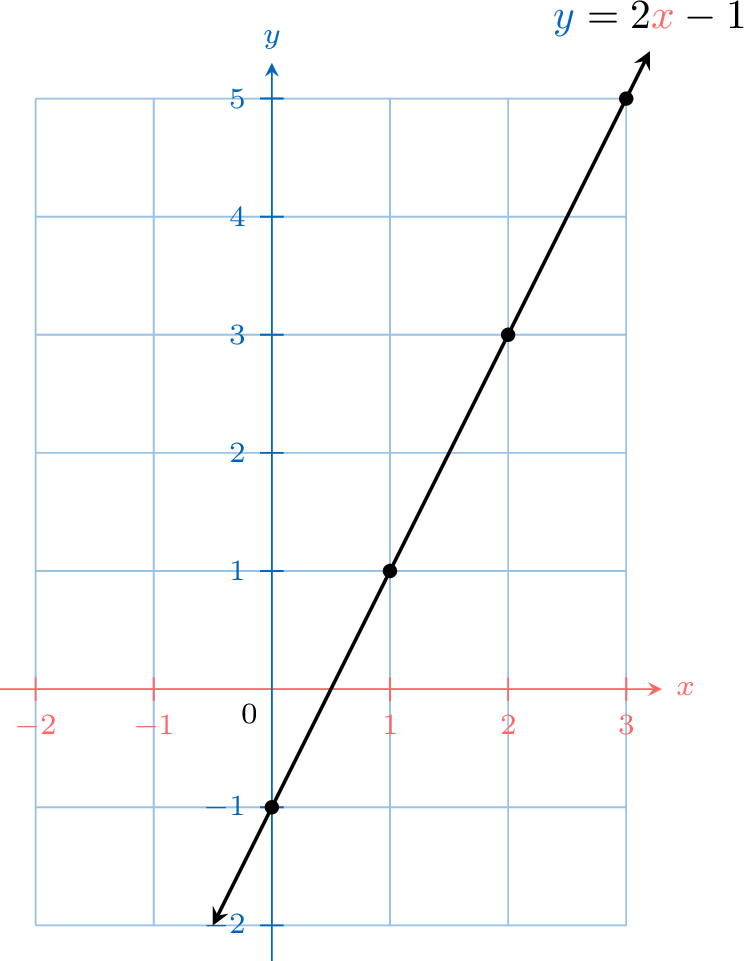
We can use this to find coordinates \((\textcolor{colordef}{x}, \textcolor{colorprop}{y})\) for points that satisfy the equation.
- If \(\textcolor{colordef}{x} = \textcolor{colordef}{1}\), then \(\textcolor{colorprop}{y} = 2(\textcolor{colordef}{1}) - 1 = \textcolor{colorprop}{1}\). This gives us the point \((1, 1)\).
- If \(\textcolor{colordef}{x} = \textcolor{colordef}{2}\), then \(\textcolor{colorprop}{y} = 2(\textcolor{colordef}{2}) - 1 = \textcolor{colorprop}{3}\). This gives us the point \((2, 3)\).
| \(\textcolor{colordef}{x}\) | \(\textcolor{colordef}{0}\) | \(\textcolor{colordef}{1}\) | \(\textcolor{colordef}{2}\) | \(\textcolor{colordef}{3}\) |
| \(\textcolor{colorprop}{y}\) | \(\textcolor{colorprop}{-1}\) | \(\textcolor{colorprop}{1}\) | \(\textcolor{colorprop}{3}\) | \(\textcolor{colorprop}{5}\) |
Example
The equation \(y = -3x + 1\) gives the value of \(y\) for each value of \(x\). - Complete a table of values for \(x = -1\), \(0\) and \(2\), then plot the points and draw the line.
- Do the points \((1, -2)\) and \((2, -4)\) lie on this line?
- Replace \(x\) by each value in the equation.
- For \(x = -1\): $$\begin{aligned}[t] y &= -3 \times (-1) + 1 \\ &= 3 + 1 \\ &= 4 \end{aligned}$$
- For \(x = 0\): $$\begin{aligned}[t] y &= -3 \times 0 + 1 \\ &= 1 \end{aligned}$$
- For \(x = 2\): $$\begin{aligned}[t] y &= -3 \times 2 + 1 \\ &= -6 + 1 \\ &= -5 \end{aligned}$$
\(x\) \(-1\) \(0\) \(2\) \(y\) \(4\) \(1\) \(-5\) 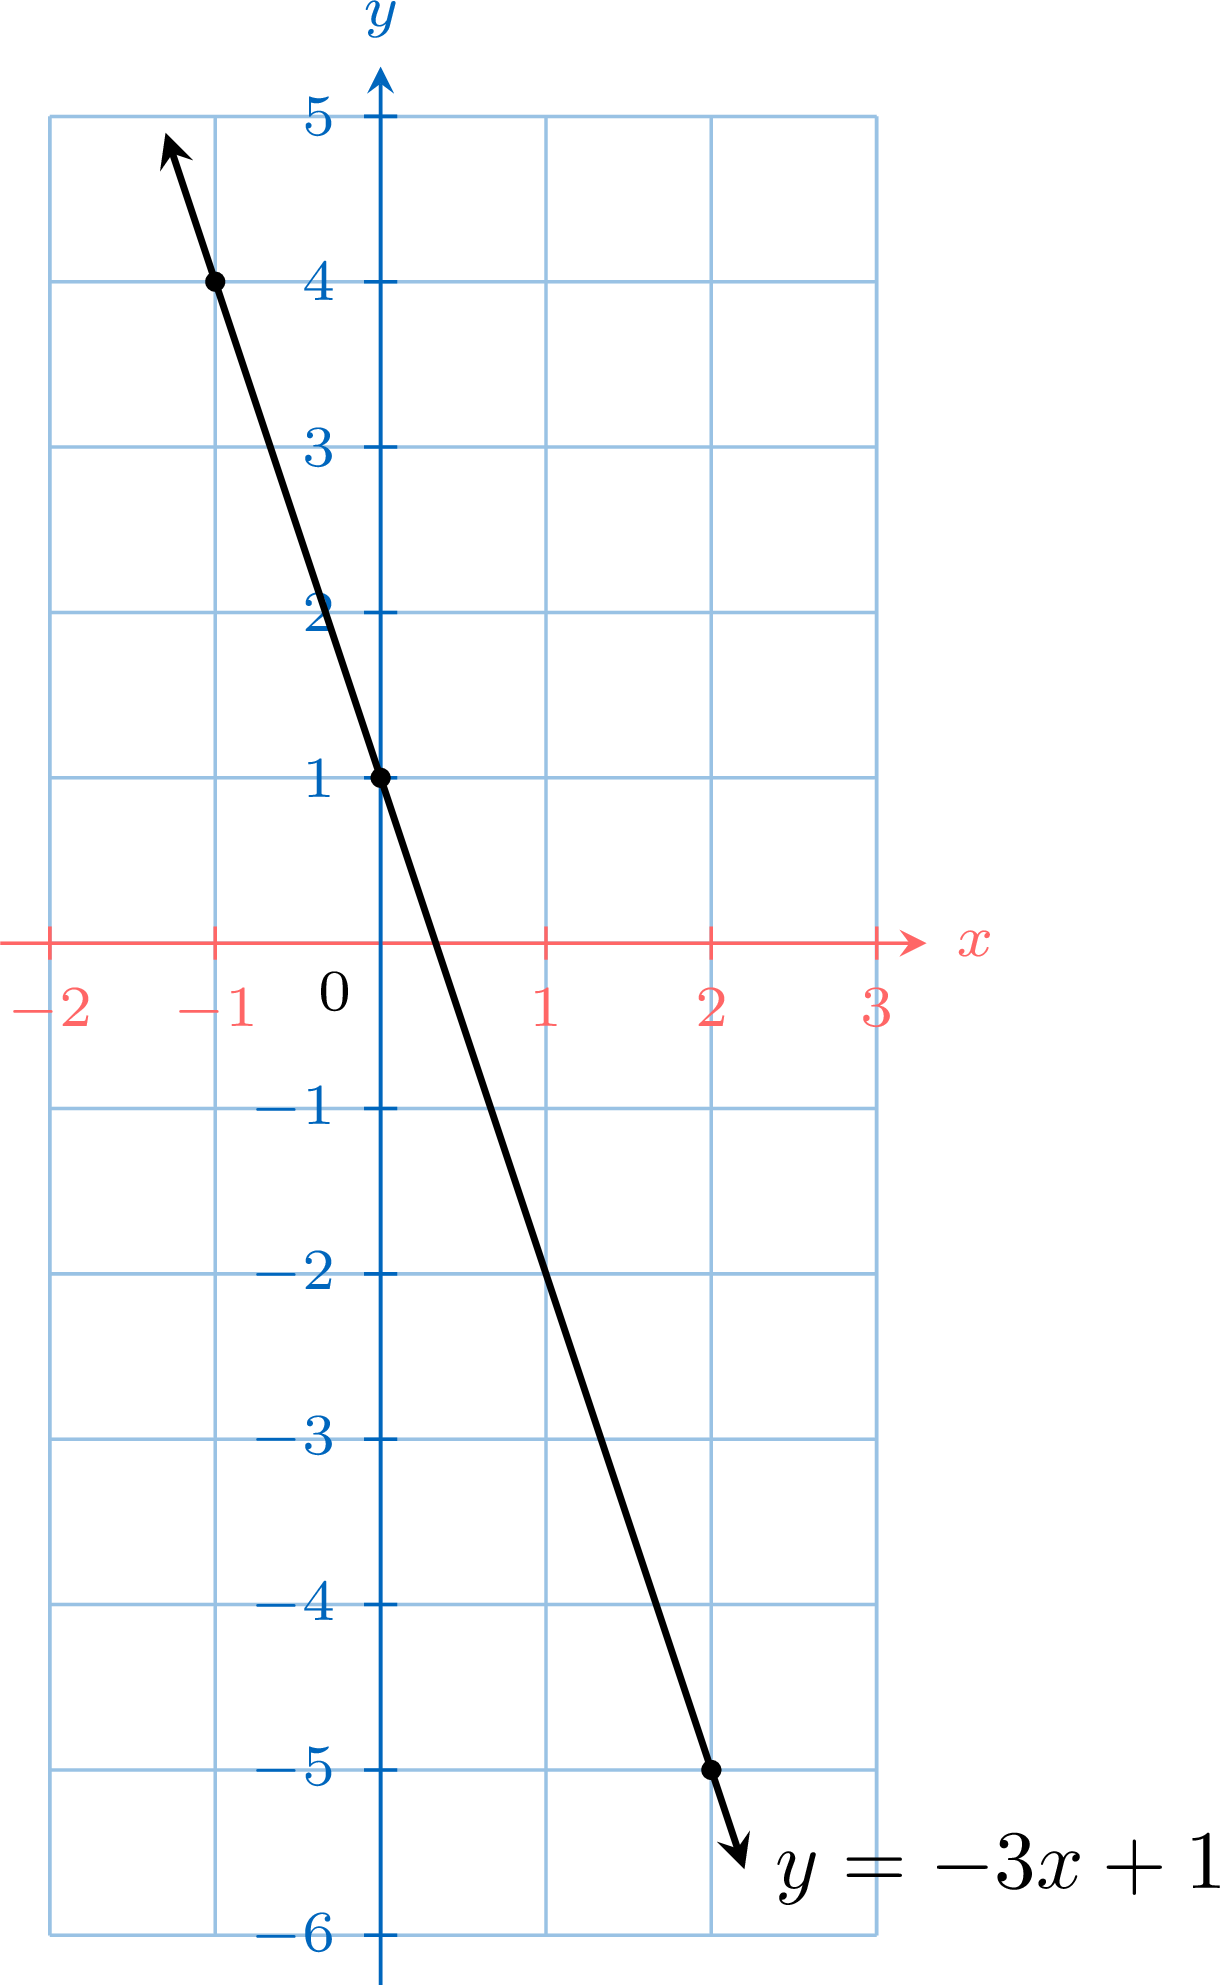
- Replace \(x\) by the first coordinate, then compare the result with the second coordinate.
- For \((1, -2)\): $$\begin{aligned}[t] y &= -3 \times 1 + 1 \\ &= -2 \end{aligned}$$ This is the second coordinate: the point \((1, -2)\) lies on the line.
- For \((2, -4)\): $$\begin{aligned}[t] y &= -3 \times 2 + 1 \\ &= -6 + 1 \\ &= -5 \end{aligned}$$ and \(-5 \neq -4\): the point \((2, -4)\) does not lie on the line.
Skills to practice
- Deciding Whether a Point Is on a Line
- Completing Tables of Values and Finding Points
- Graphing a Line from Two Points
IV
From a Formula to a Graph
Definition — In Terms Of
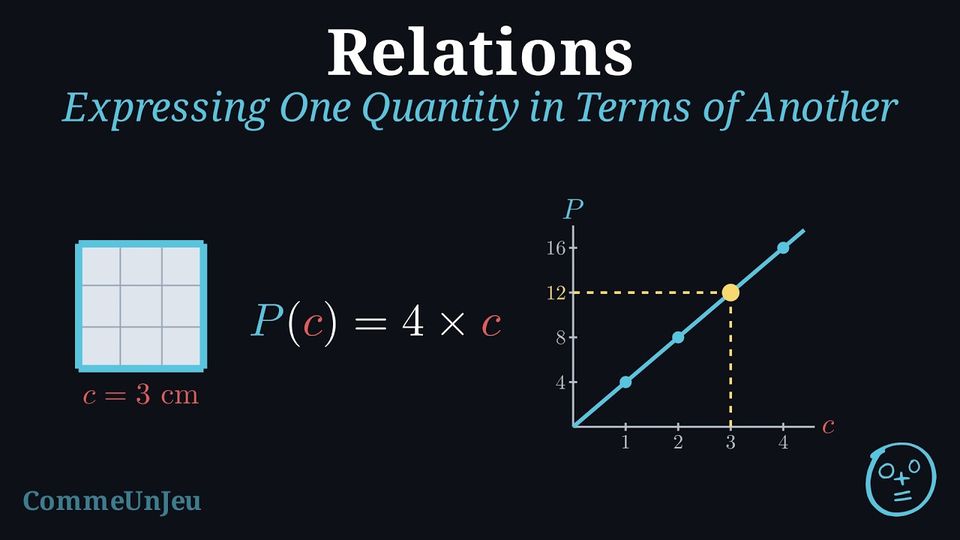
When two quantities are linked, so that each value of the first determines exactly one value of the second, we say that the second quantity is expressed in terms of the first.Example. The perimeter of a square is expressed in terms of the length of its side: once the side is chosen, the perimeter is determined.
Method — From a Formula to a Graph
To represent by a graph a quantity given by a formula: - Choose a few values of the starting quantity, from the smallest to the largest that make sense.
- Compute the matching values with the formula, and gather them in a table.
- Place one point per column of the table, the starting quantity on the horizontal axis.
- Join or not: the points are joined only if the starting quantity can take every value in between (a length, a duration) — with a ruler when the points are aligned, by a smooth curve when they are not; if it only takes whole values (a number of objects), the points stay isolated.
Example
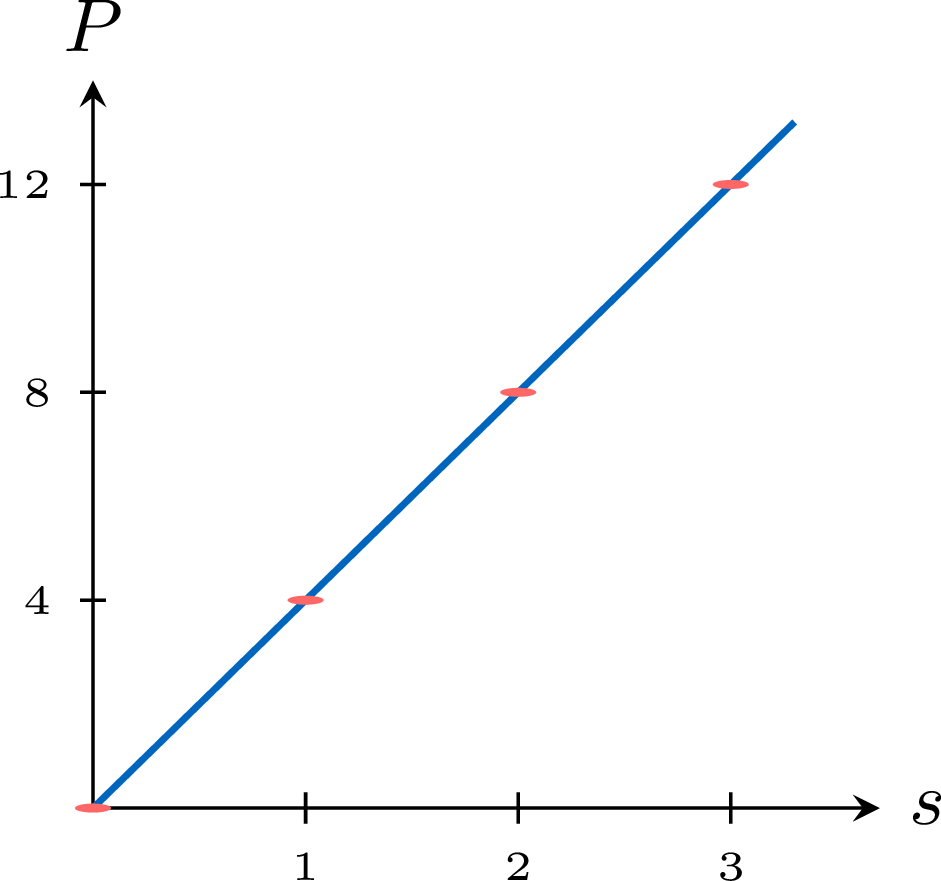
The perimeter of a square of side \(s\) (in cm) is \(P = 4 \times s\). Represent \(P\) in terms of \(s\) by a graph, for \(s\) from \(0\) to \(3\). Then say what would change for the price \(12 \times n\) of \(n\) concert tickets. | \(s\) (cm) | \(0\) | \(1\) | \(2\) | \(3\) |
| \(P = 4 \times s\) (cm) | \(0\) | \(4\) | \(8\) | \(12\) |
Skills to practice
- Drawing a Graph from a Formula
V
Going further
Skills to practice
- Reasoning with Graphs
- Solving Problems with Graphs
- Investigating Patterns in Tables and Graphs
- Quiz
Jump to section