International Baccalaureate · MYP 1
Line Graphs
I
Tables of Two Quantities
Definition — Table
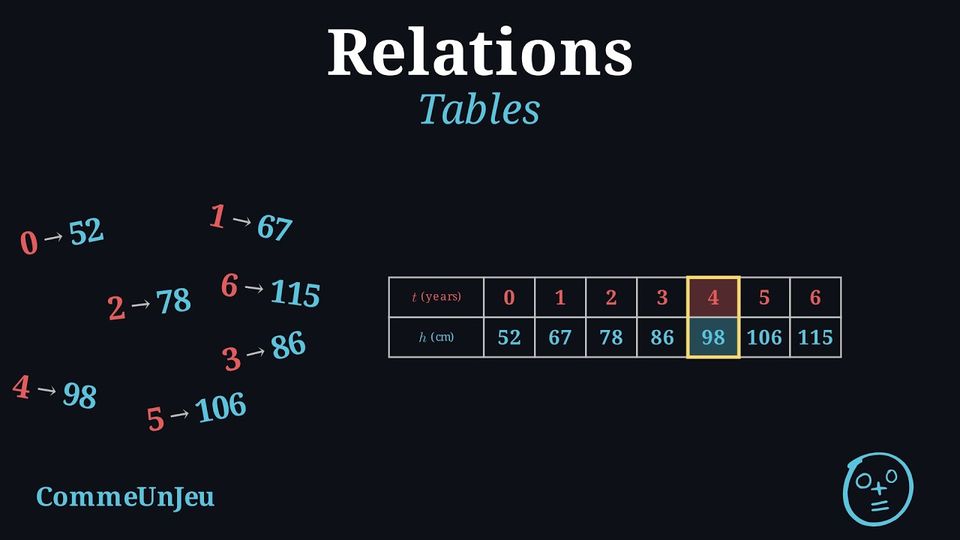
A table is used to organise data so that it is easier to display and study how two variables are linked. Usually, one row (or column) is used for the first variable and another row (or column) for the second variable. Example
Hugo's height at each age is given in the following table: | \(\textcolor{colordef}{t\text{ (years)}}\) | \(0\) | \(1\) | \(2\) | \(3\) | \(4\) | \(5\) | \(6\) |
| \(\textcolor{colorprop}{h\text{ (cm)}}\) | \(52\) | \(67\) | \(78\) | \(86\) | \(98\) | \(106\) | \(115\) |
Hugo's height at \(4\) years old is \(\textcolor{colorprop}{98}\) centimetres.
Skills to practice
- Reading Tables of Two Quantities
II
Line Graphs
Method — Plotting a Line Graph from a Table
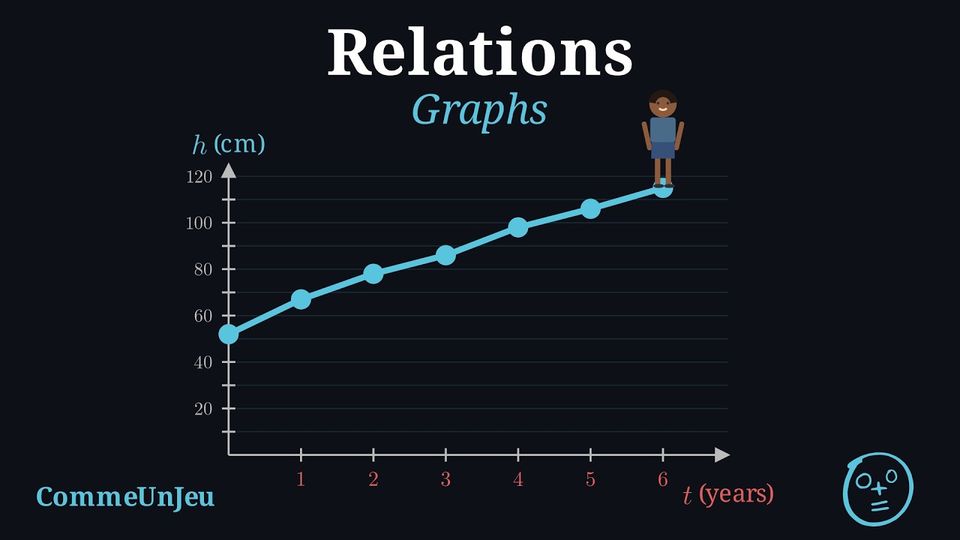
In a coordinate plane: - we plot each point \((\textcolor{colordef}{x},\textcolor{colorprop}{y})\) from the table,
- we connect the points in order with straight line segments.
Example
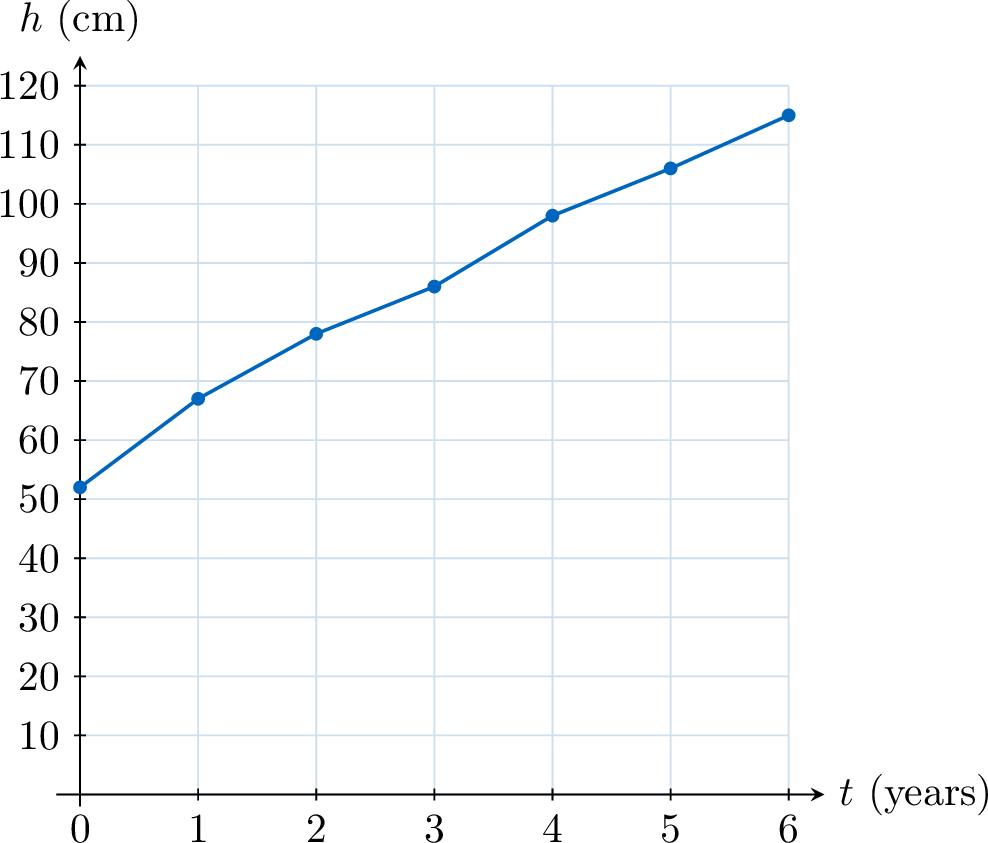
Plot the line graph of Hugo's height at each age, using the data below: | \(\textcolor{colordef}{t\text{ (years)}}\) | \(0\) | \(1\) | \(2\) | \(3\) | \(4\) | \(5\) | \(6\) |
| \(\textcolor{colorprop}{h\text{ (cm)}}\) | \(52\) | \(67\) | \(78\) | \(86\) | \(98\) | \(106\) | \(115\) |
- First, plot the points \((0,52)\), \((1,67)\), \((2,78)\), \((3,86)\), \((4,98)\), \((5,106)\), \((6,115)\) in a coordinate plane.
- Then, connect the points in order with straight line segments to form the line graph.
Example
The line graph below shows the noon temperature measured each day of one week. 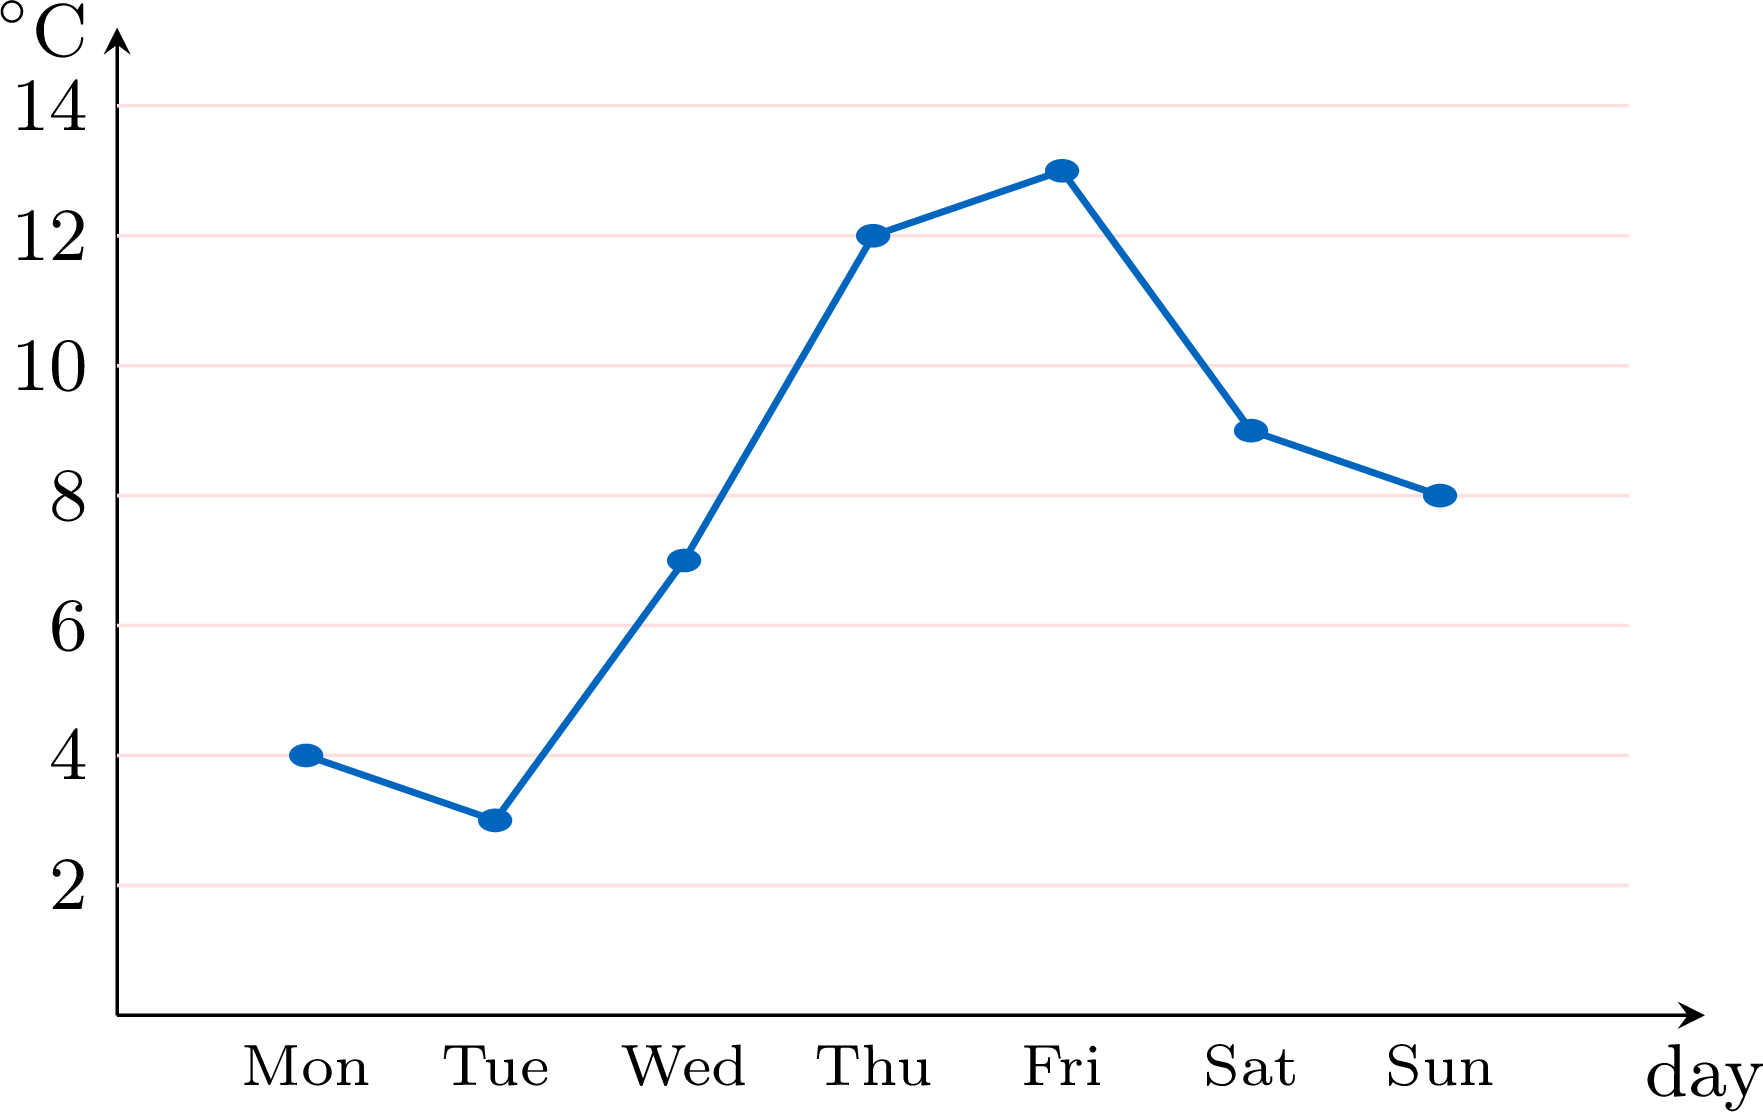
The highest point is on Friday: \(13\,^\circ\)C. To find the steepest rise, read the three rises: Tuesday \(\to\) Wednesday climbs from \(3\) to \(7\) (\(+4\)), Wednesday \(\to\) Thursday from \(7\) to \(12\) (\(+5\)), Thursday \(\to\) Friday from \(12\) to \(13\) (\(+1\)): the biggest rise is between Wednesday and Thursday. 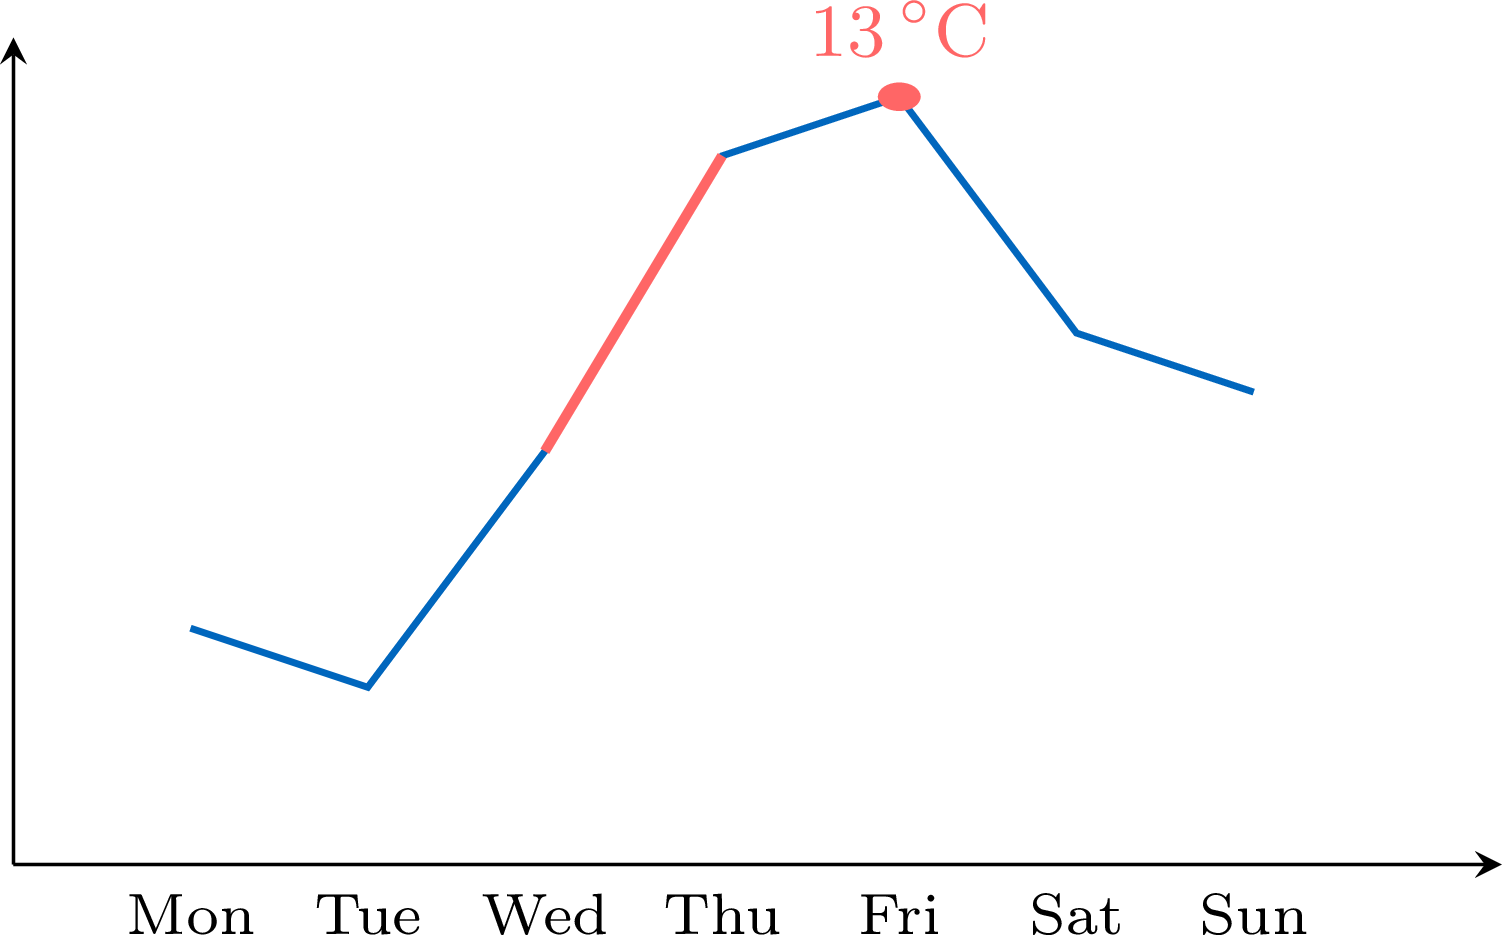
Skills to practice
- Plotting and Reading Line Graphs
- Reading Line Graphs of Data
- Building Line Graphs
III
Distance-Time Graphs
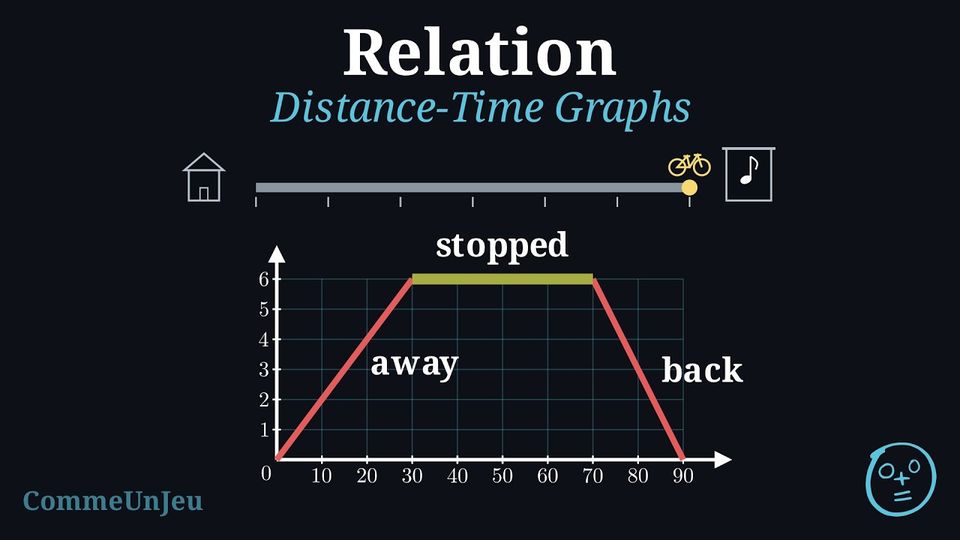
A distance-time graph, also called a travel graph, tells the story of a journey. The time is placed on the horizontal axis and the distance from the starting place on the vertical axis. The time goes on by itself, while the distance depends on the time: the quantity that depends on the other goes up, on the vertical axis. In these graphs, each journey follows a route that leads straight away from the starting place and, when it comes back, comes back the same way, so the distance from the start changes exactly as the traveller moves.
Each point of the graph is read as a sentence: the point \((2, 25)\) says “after \(2\) hours, the traveller is \(25\) km from home”. 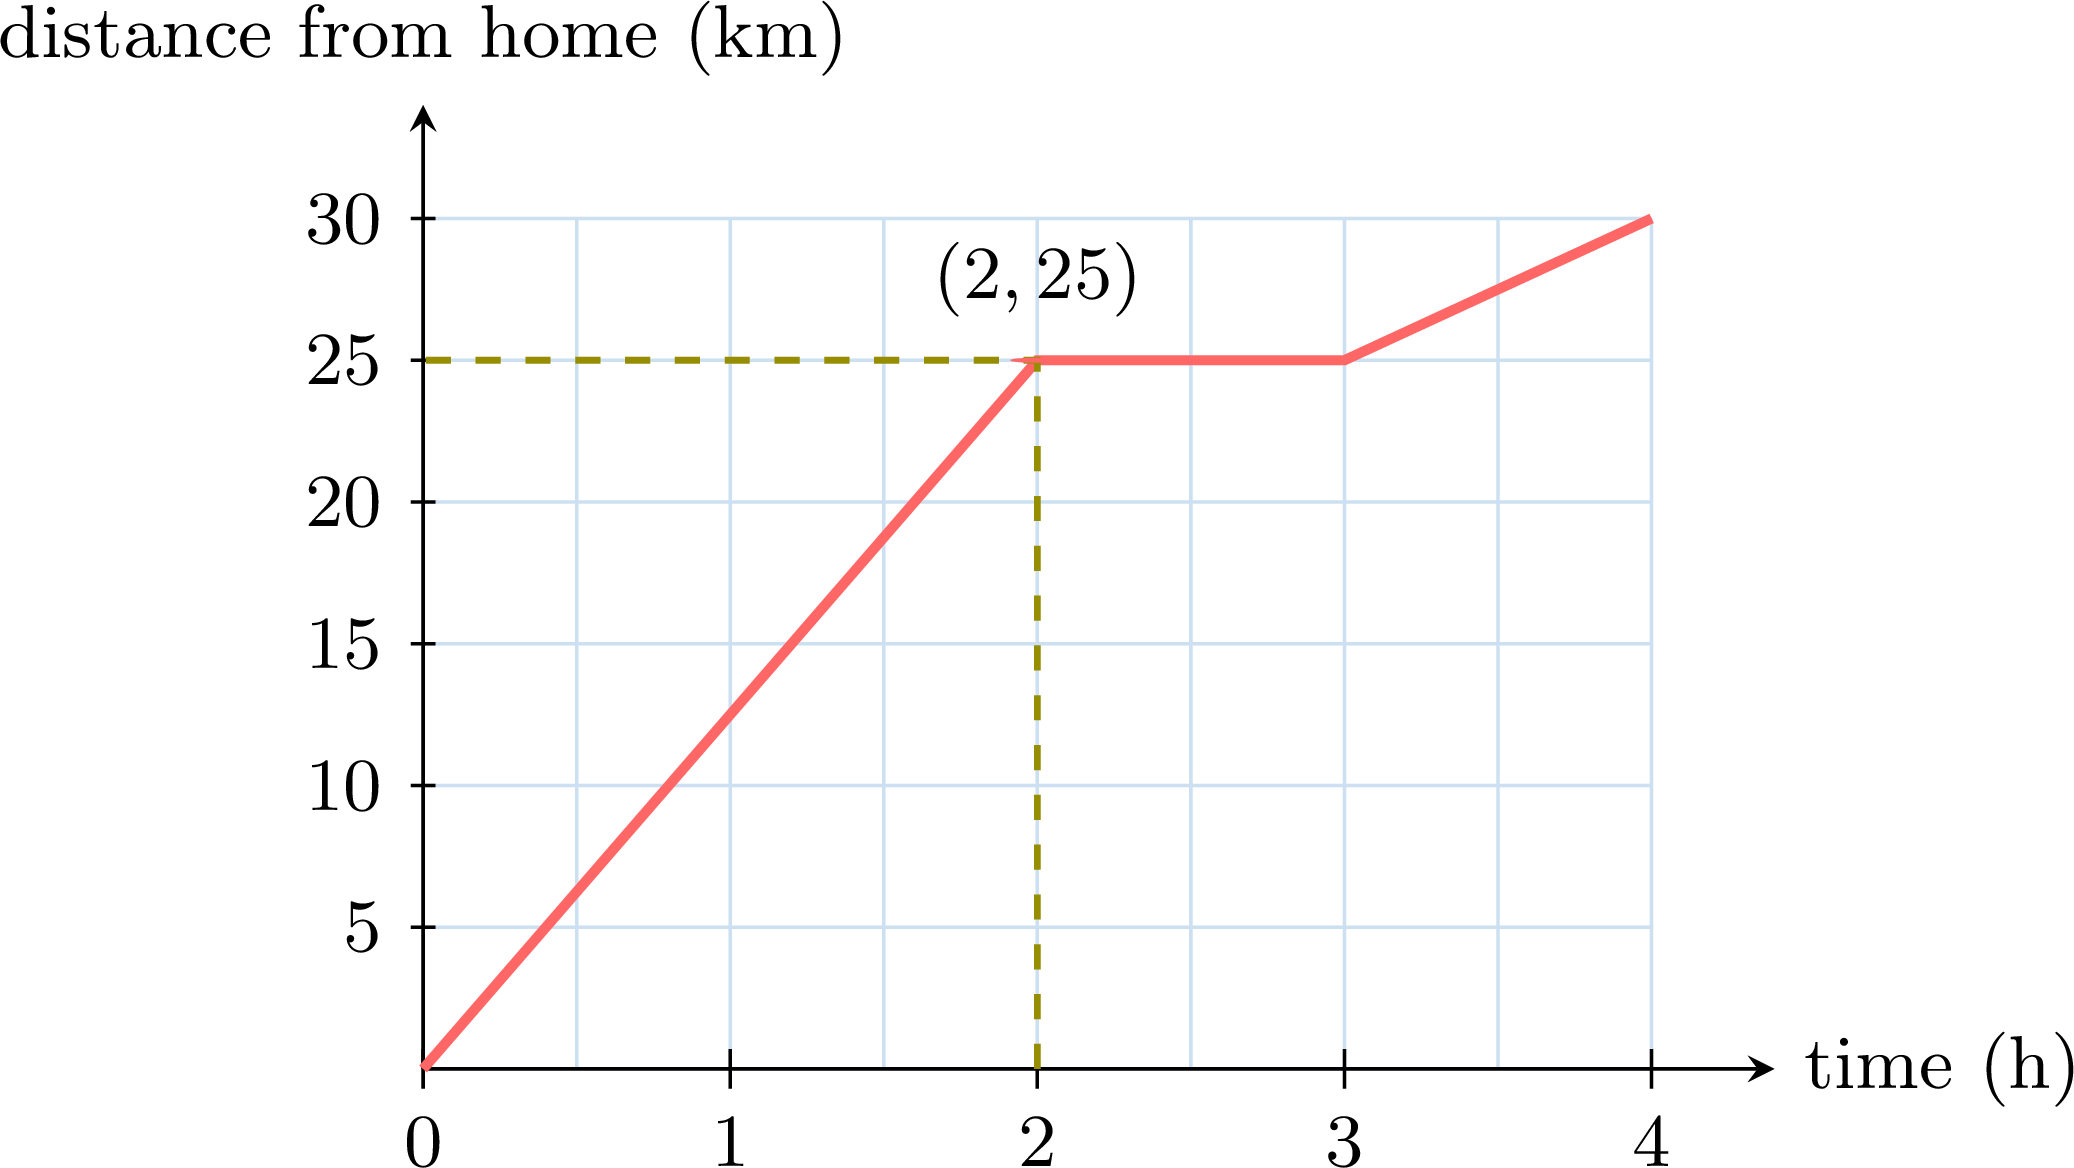
Each point of the graph is read as a sentence: the point \((2, 25)\) says “after \(2\) hours, the traveller is \(25\) km from home”.
Method — Reading a Distance-Time Graph
- Read the axes first: the quantity on each axis, its unit, and the value of one step of each scale.
- A part that rises: the traveller moves away from the start.
- A flat part: the traveller has stopped — the time passes, the distance does not change. The length of the flat part along the time axis is the length of the stop.
- A part that falls: the traveller comes back towards the start, and is back at the start when the graph reaches \(0\).
- Steeper means faster: in the same time, a steeper part covers a greater distance. To compare two parts, compare the distances they cover in the same time, for example in one hour. The distance covered in one hour is the speed, in km/h.
- Distance from the start is not distance travelled: after a return trip the graph is back at \(0\), but the traveller has covered the way there plus the way back.
Example
Chloe cycles from home to a lake along a straight road, and comes back by the same road. The graph gives her distance from home during the day. 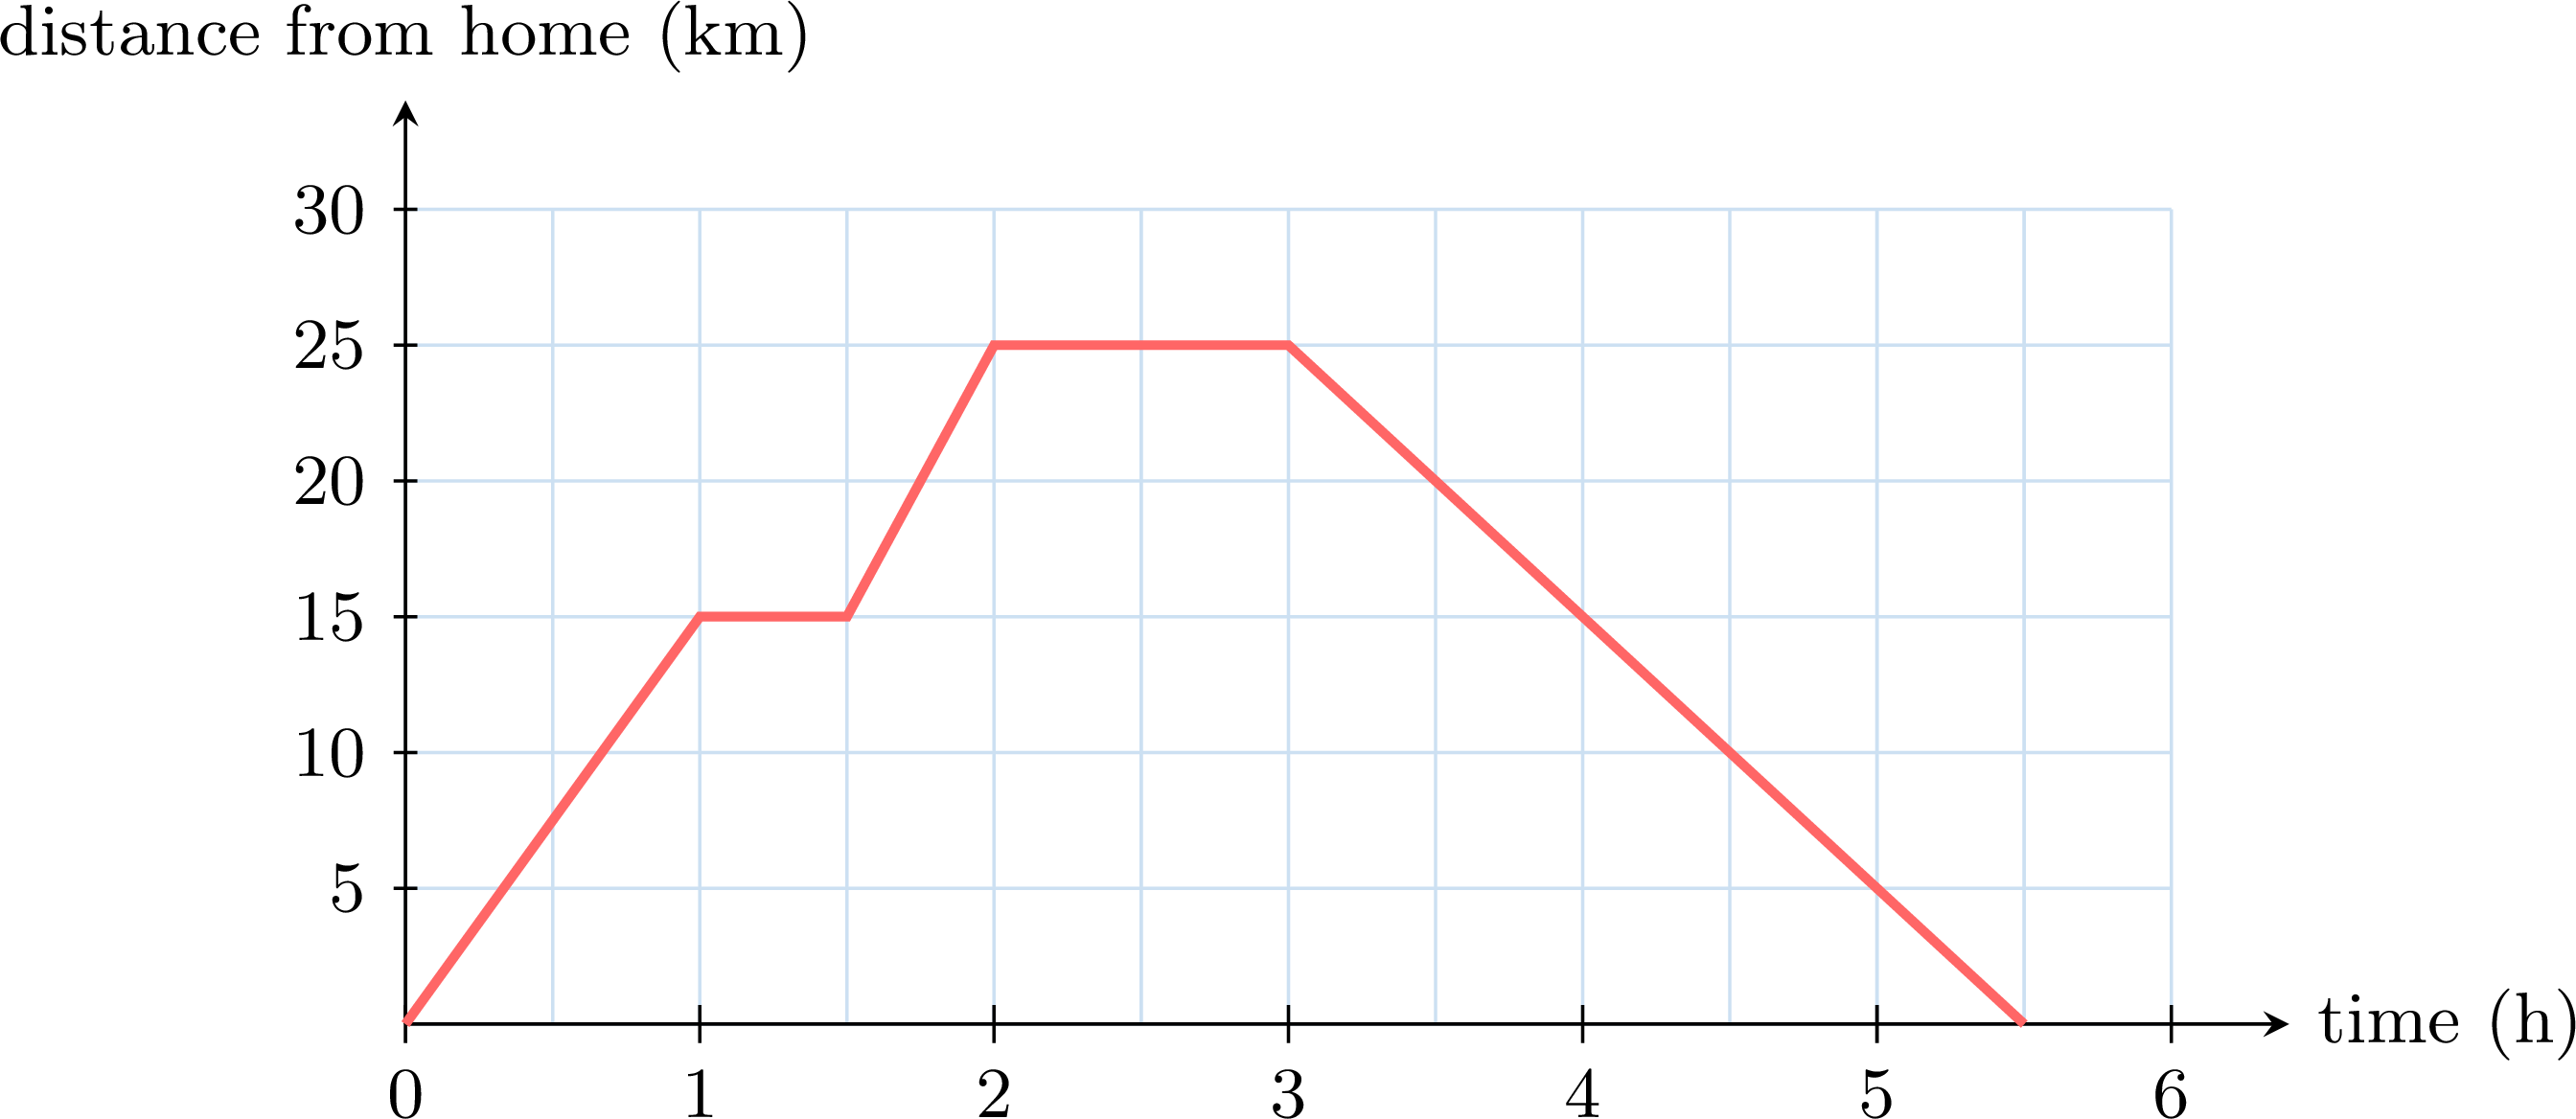
- How far from home is Chloe after \(1\) hour?
- When does she stop, and how long does each stop last?
- Is she faster during the first hour or between \(1\) h \(30\) min and \(2\) h?
- After how long is she back home?
- What total distance does she cycle?
One step of the time axis is half an hour, one step of the distance axis is \(5\) km. 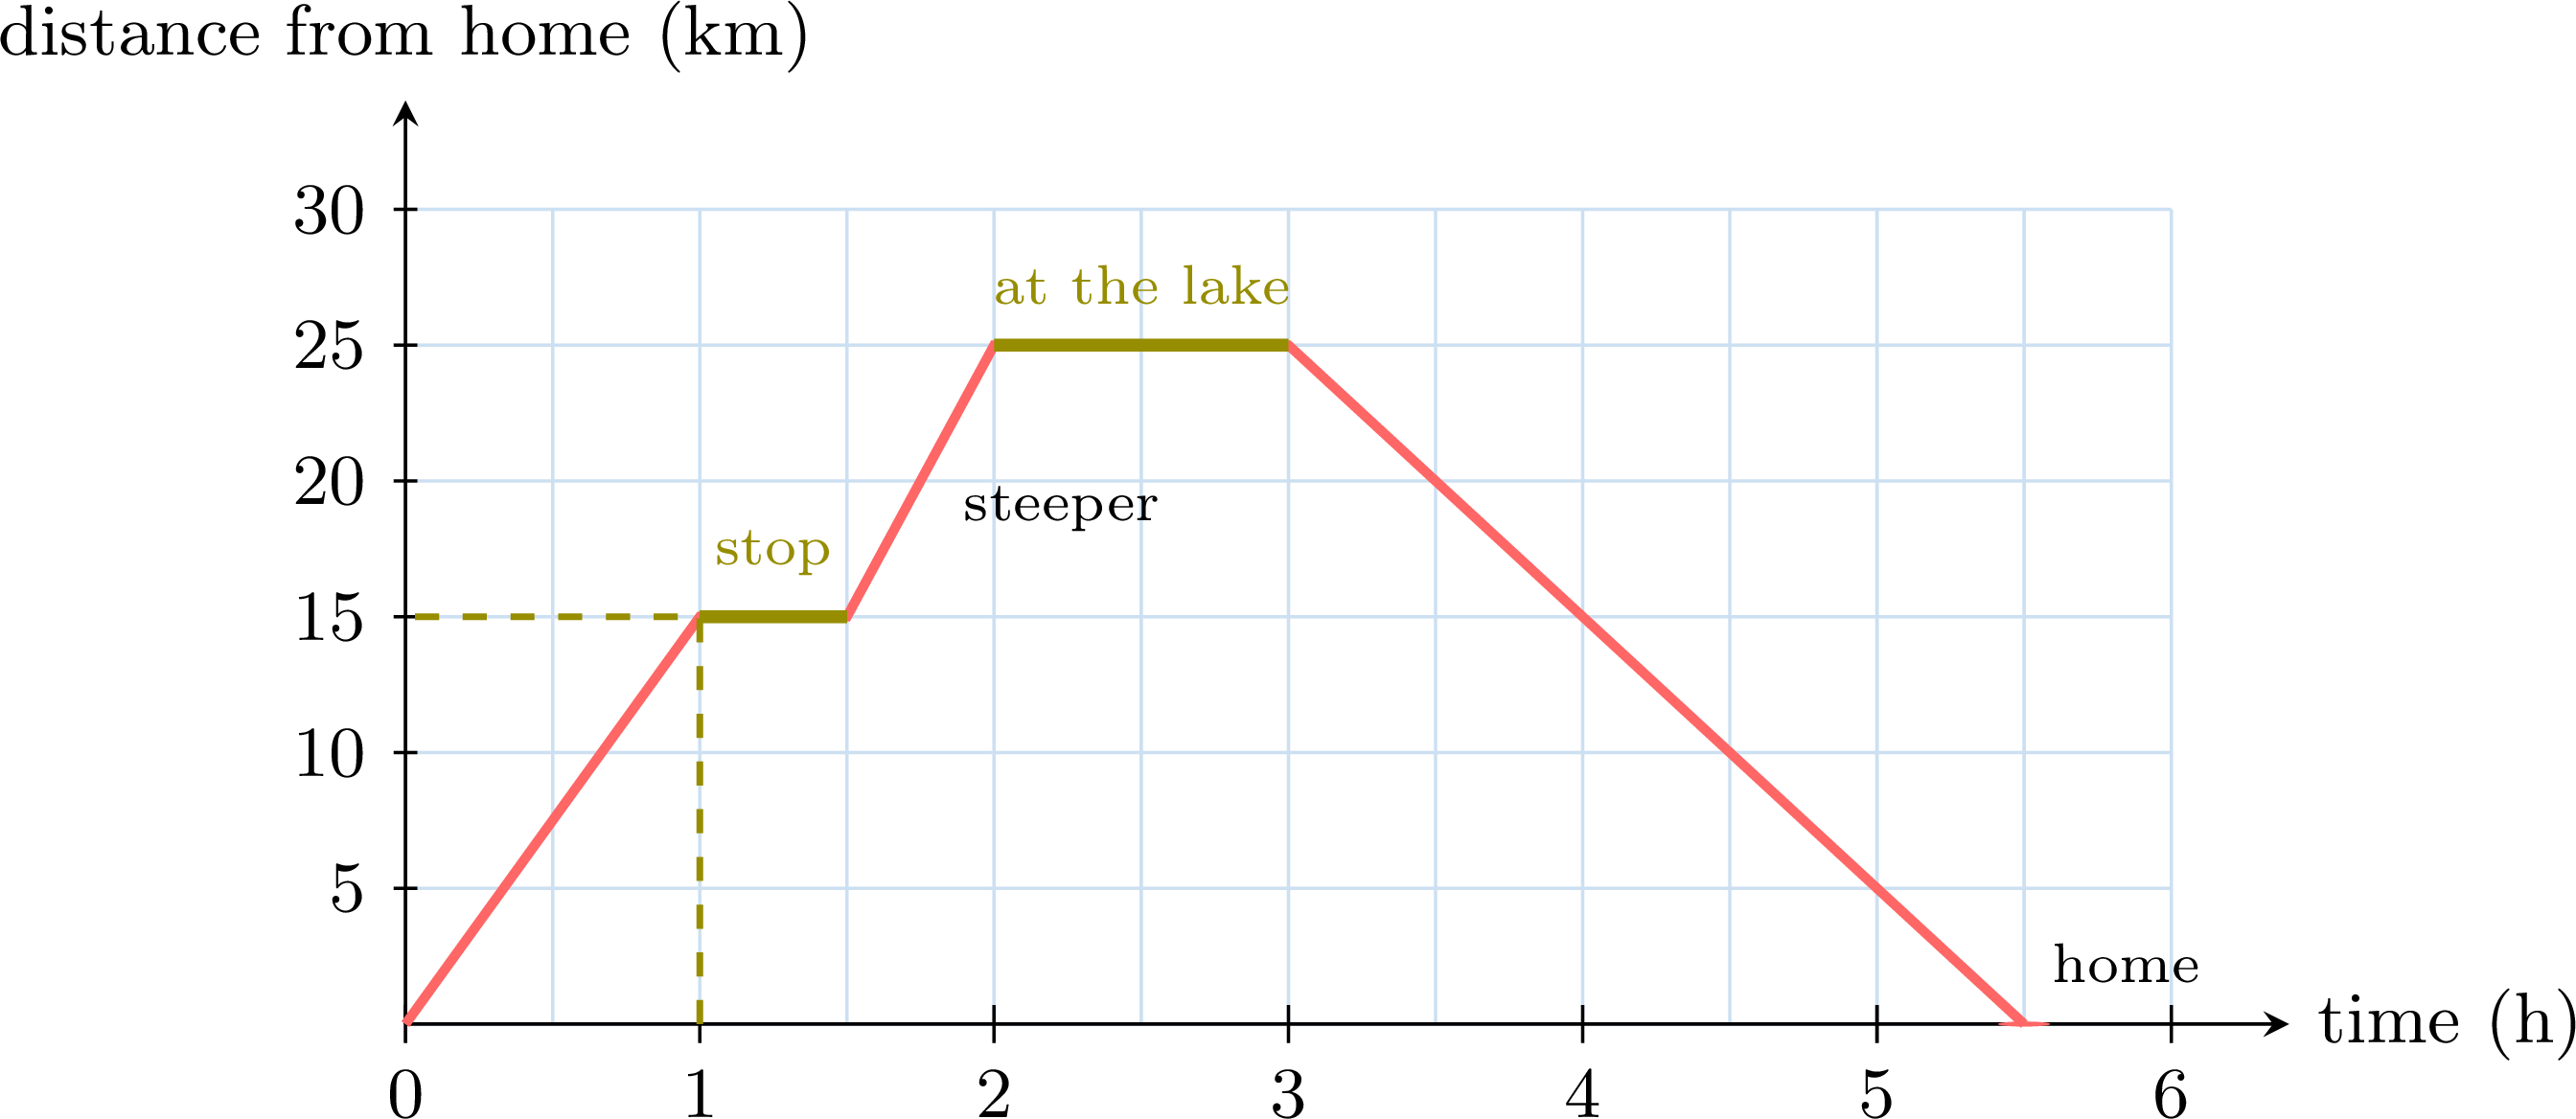
- From \(1\) on the time axis, go up to the graph, then across to the distance axis: Chloe is \(\mathbf{15}\) km from home.
- The graph has two flat parts. From \(1\) h to \(1\) h \(30\) min it stays at \(15\) km: a stop of \(\mathbf{30}\) min. From \(2\) h to \(3\) h it stays at \(25\) km, at the lake: a stop of \(\mathbf{1}\) hour.
- During the first hour she covers \(15\) km. Between \(1\) h \(30\) min and \(2\) h she goes from \(15\) km to \(25\) km, that is \(25 - 15 = 10\) km in half an hour, so \(2 \times 10 = 20\) km in one hour. As \(20 > 15\), she is faster between \(1\) h \(30\) min and \(2\) h — and the graph is steeper there.
- The graph reaches \(0\) halfway between \(5\) and \(6\): she is back home after \(\mathbf{5}\) h \(\mathbf{30}\) min.
- She cycles \(25\) km to the lake and \(25\) km back: \(25 + 25 = \mathbf{50}\) km. The graph ends at \(0\) because \(0\) is her distance from home at the end, not the distance she has cycled.
Example
Tom walks from home to the station: \(2\) km in \(30\) minutes. He waits \(15\) minutes for the train. Then the train takes him \(20\) km further in \(30\) minutes. Tom walks at a steady pace and the train runs at a steady pace. Draw the distance-time graph of his journey, with the time in minutes and the distance from home in kilometres.
First, the key moments of the story, as pairs (time, distance from home):
He reaches the station at \(30\) min, \(2\) km from home; the train leaves \(15\) min later, at \(30 + 15 = 45\) min; it arrives \(30\) min later, at \(45 + 30 = 75\) min, and \(2 + 20 = 22\) km from home. The time axis goes up to \(75\) min in steps of \(15\) min, the distance axis up to \(24\) km in steps of \(2\) km. Plot the four points and join them in order with a ruler: the steady paces make each part a straight segment. 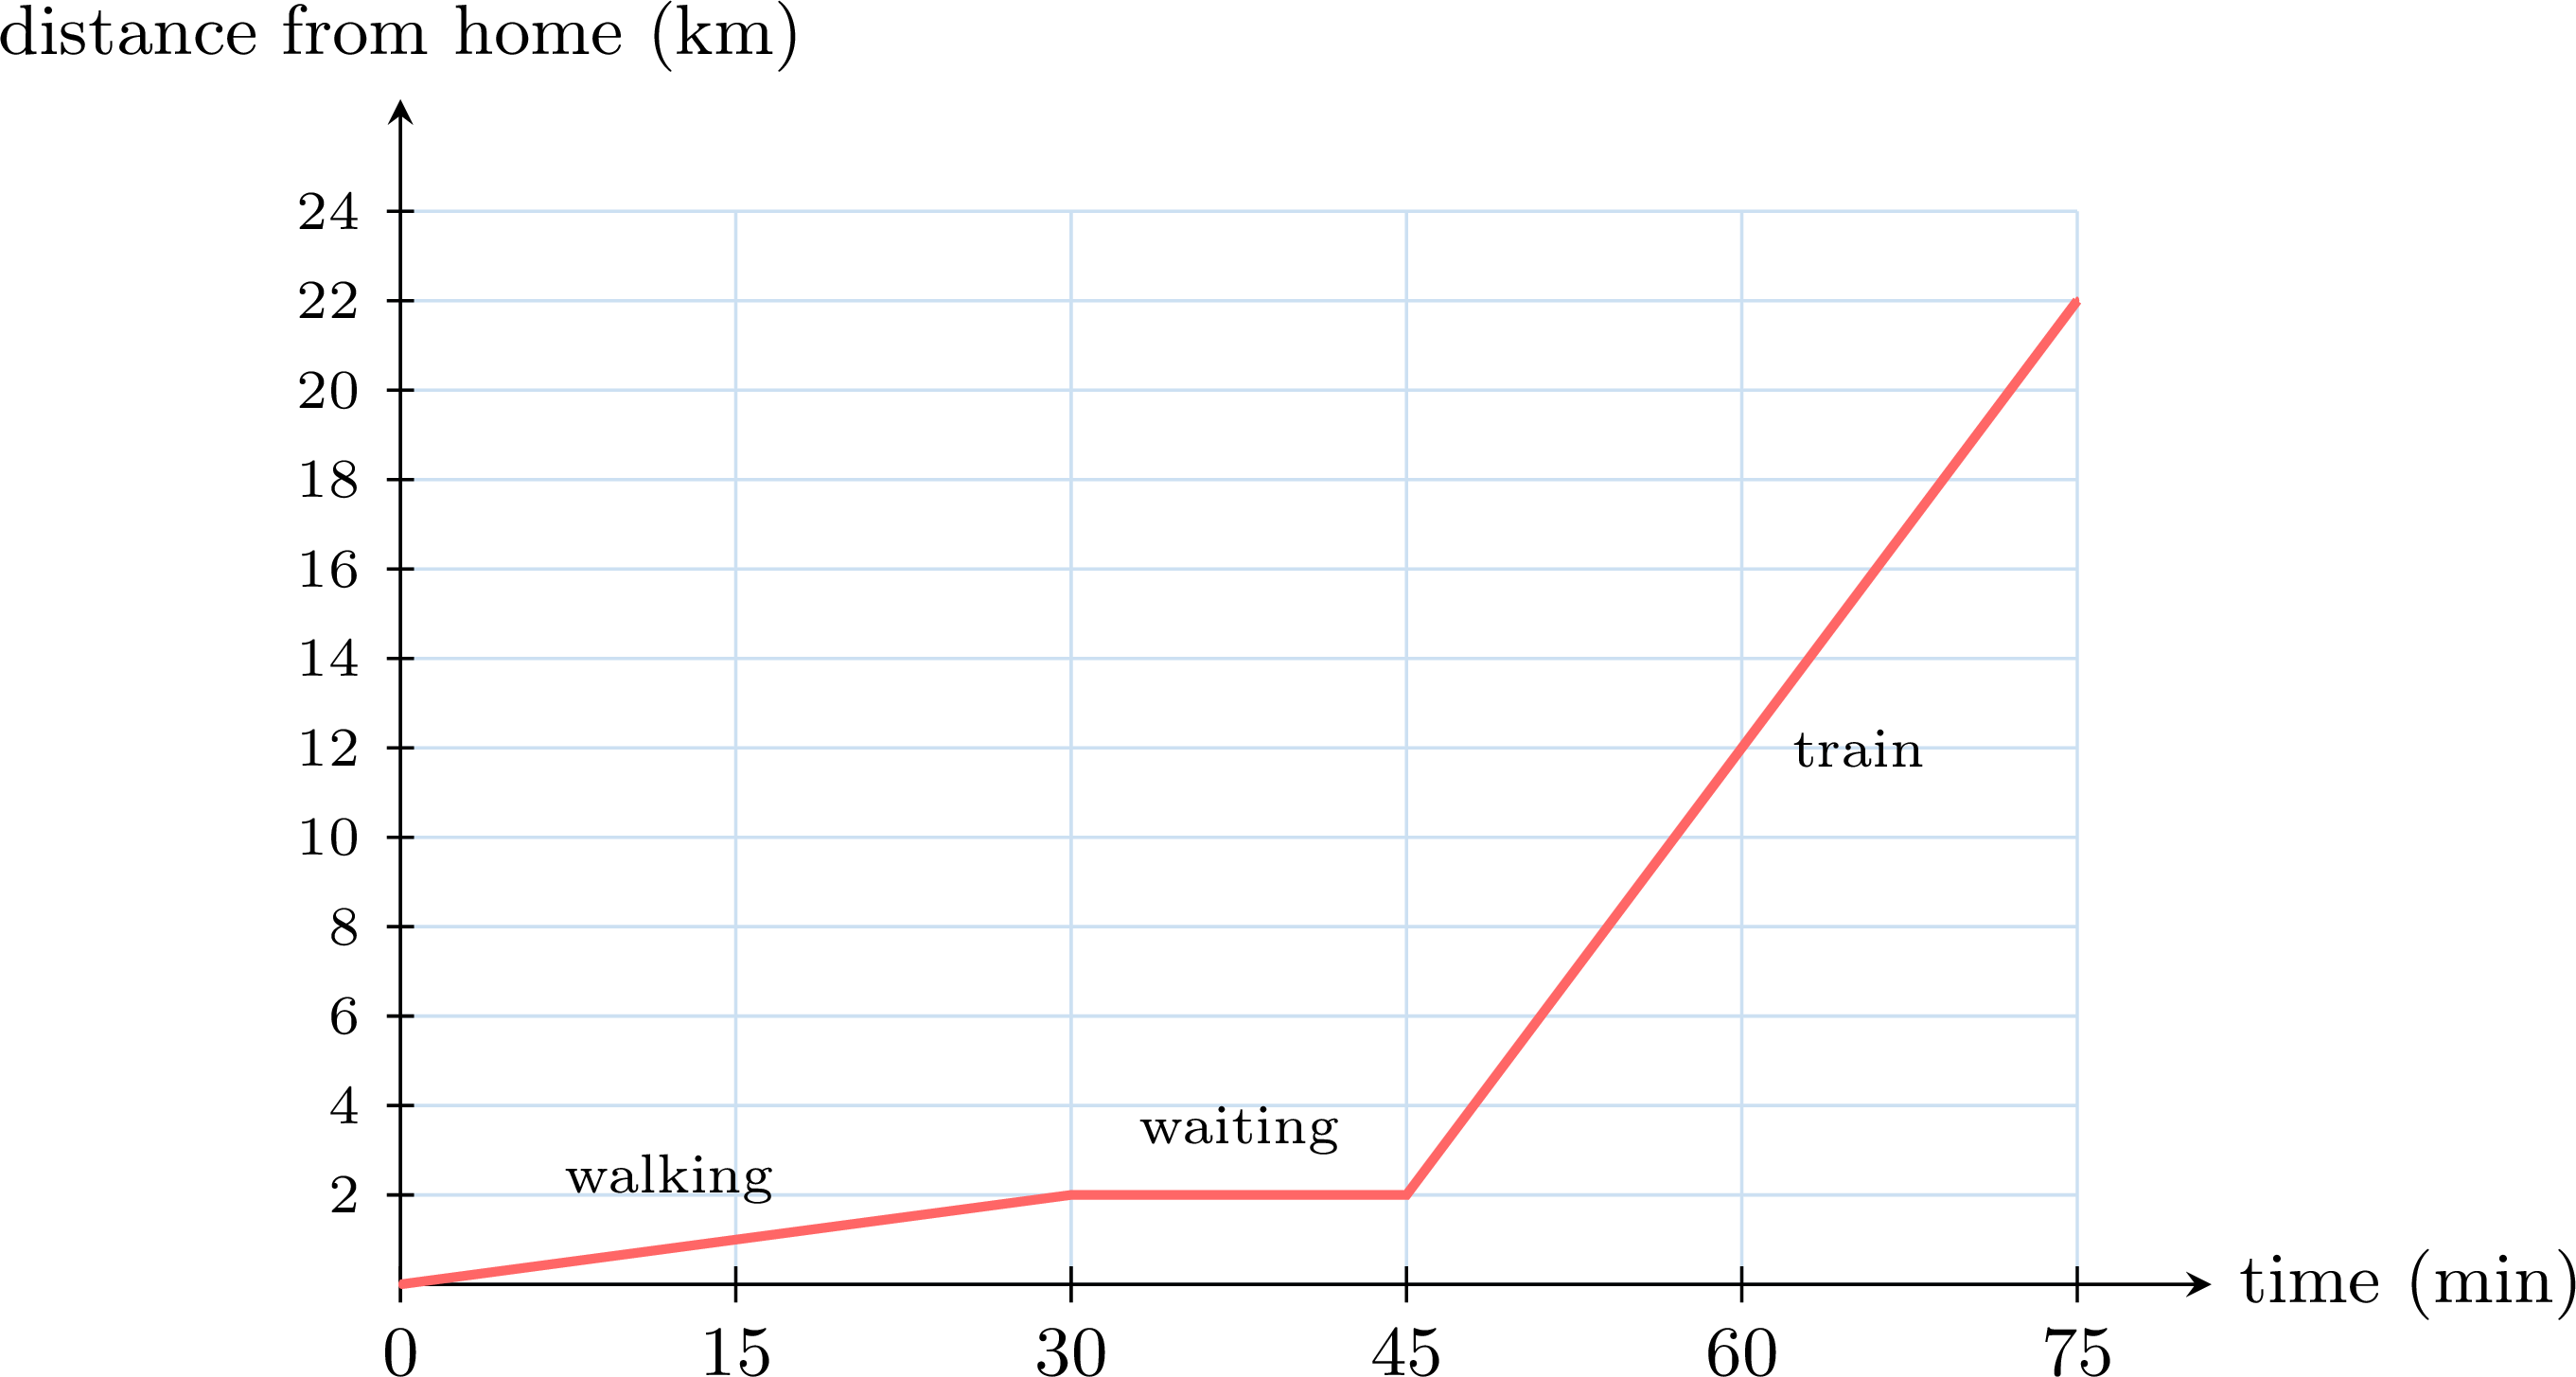
The graph shows the three parts of the story: a gentle rise (walking), a flat part (waiting), a steep rise (the train, \(20\) km in the same \(30\) minutes that walking took for \(2\) km).
| time (min) | \(0\) | \(30\) | \(45\) | \(75\) |
| distance (km) | \(0\) | \(2\) | \(2\) | \(22\) |
Skills to practice
- Interpreting the Parts of a Distance-Time Graph
- Reading a Distance-Time Graph
- Drawing and Telling a Journey
IV
Conversion Graphs
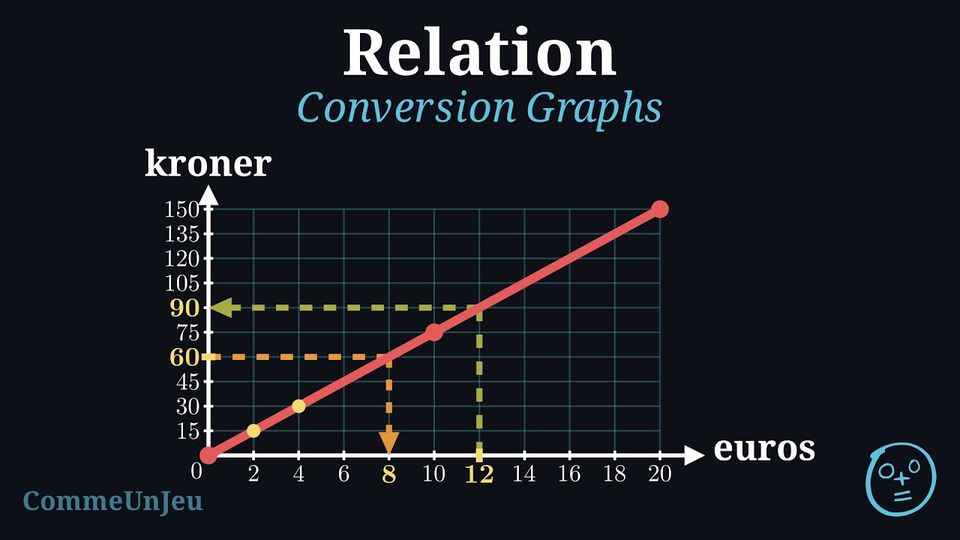
A conversion graph changes an amount written in one unit, or in one currency, into the same amount written in another one. Each point of the graph pairs two amounts that are equal: if \(\Euro 10\) is worth \(\dollar 12\) on a given day, the point \((10, 12)\) is on the graph of that day with the euros on the horizontal axis and the dollars on the vertical axis. Either amount can go on either axis.
For units of length, mass or capacity, and for currencies, \(0\) matches \(0\), and doubling one amount doubles the other: the points lie on a straight line through the origin. Temperatures behave differently: \(0\,^\circ\)C (water freezes) is \(32\,^\circ\)F, so the Celsius-Fahrenheit graph is a straight line that does not go through the origin.
For units of length, mass or capacity, and for currencies, \(0\) matches \(0\), and doubling one amount doubles the other: the points lie on a straight line through the origin. Temperatures behave differently: \(0\,^\circ\)C (water freezes) is \(32\,^\circ\)F, so the Celsius-Fahrenheit graph is a straight line that does not go through the origin.
Method — Reading a Conversion Graph
- Find the amount on its own axis.
- Go straight to the line: vertically from the horizontal axis, horizontally from the vertical axis.
- Turn and go straight to the other axis, then read the value with the scale of that axis.
- The graph works both ways: start from either axis.
- Beyond the graph, split the amount into amounts the graph shows, for example \(250 = 100 + 100 + 50\), convert each part and add. This works only when the line goes through the origin.
Method — Drawing a Conversion Graph
- For temperatures, start from two known pairs, such as \(0\,^\circ\)C \(= 32\,^\circ\)F and \(100\,^\circ\)C \(= 212\,^\circ\)F: \(0\,^\circ\)C does not match \(0\,^\circ\)F, so the next two steps do not apply to temperatures.
- For units of length, mass or capacity, and for currencies, start from one known pair, for example \(8\) km \(= 5\) miles, and from \(0 = 0\).
- Make a table of two or three pairs, by multiplying both amounts of the known pair by the same number.
- Draw the axes with a constant step, the quantity and its unit on each axis, and steps chosen so that the values of the table fall on the grid.
- Plot the points and join them with a ruler: for units and currencies, the line goes through the origin; for temperatures, it does not.
Example
On a given day, \(\Euro 10\) was worth \(\dollar 12\). The graph converts euros into dollars on that day. 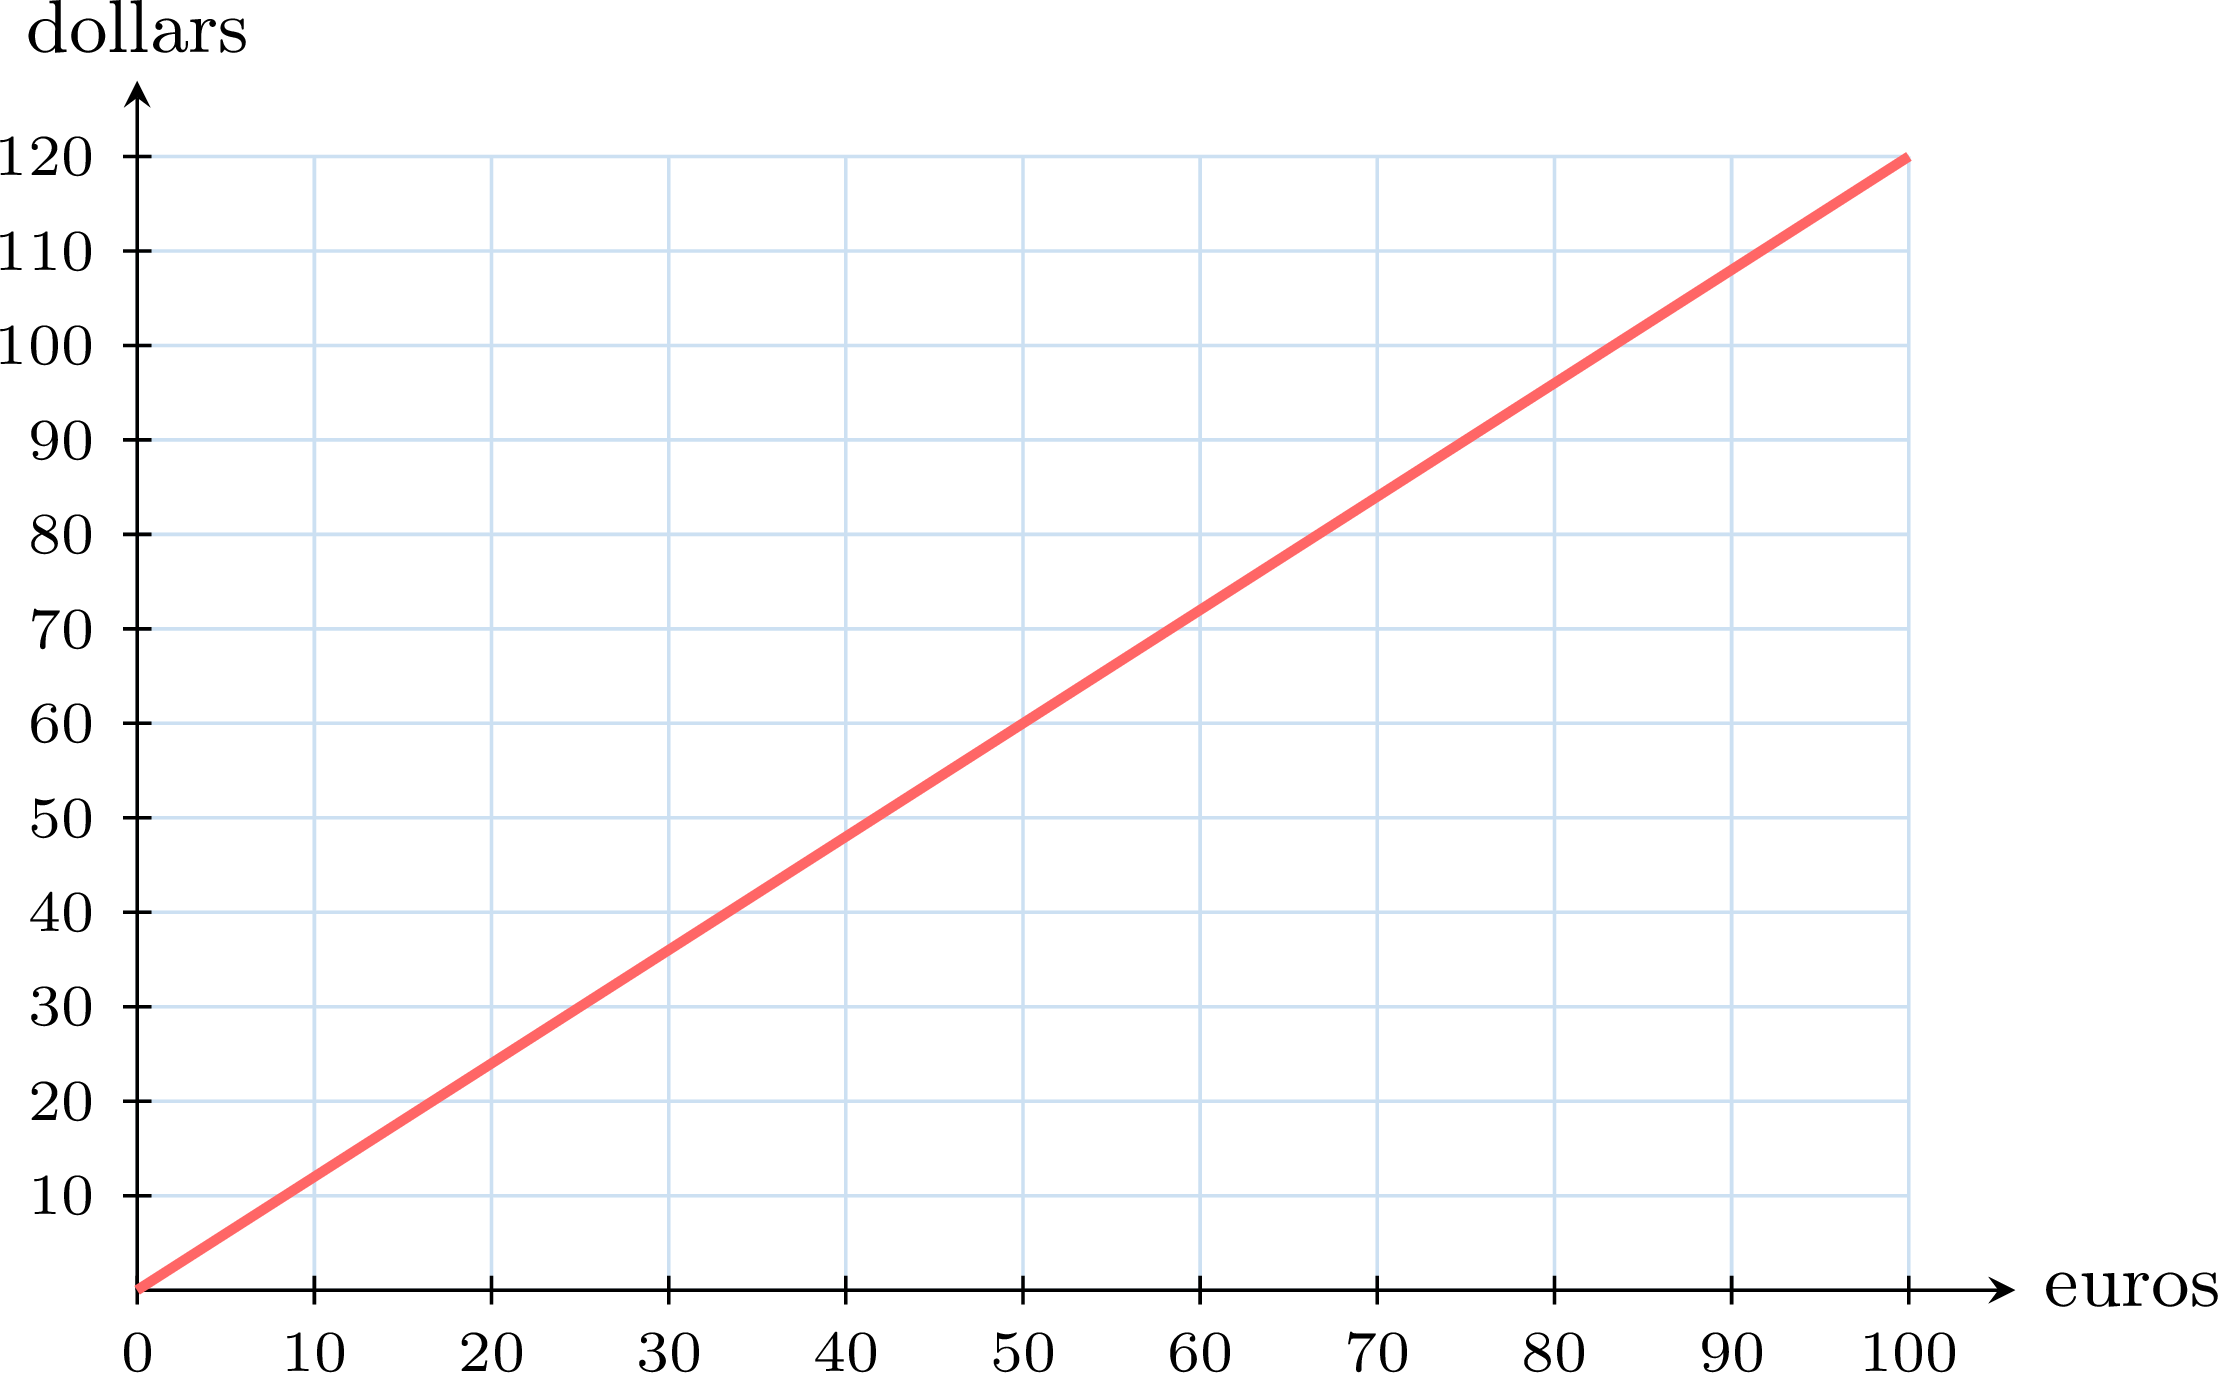
- \(\Euro 50\) into dollars;
- \(\dollar 90\) into euros;
- \(\Euro 250\) into dollars.
One step is \(10\) on each axis. 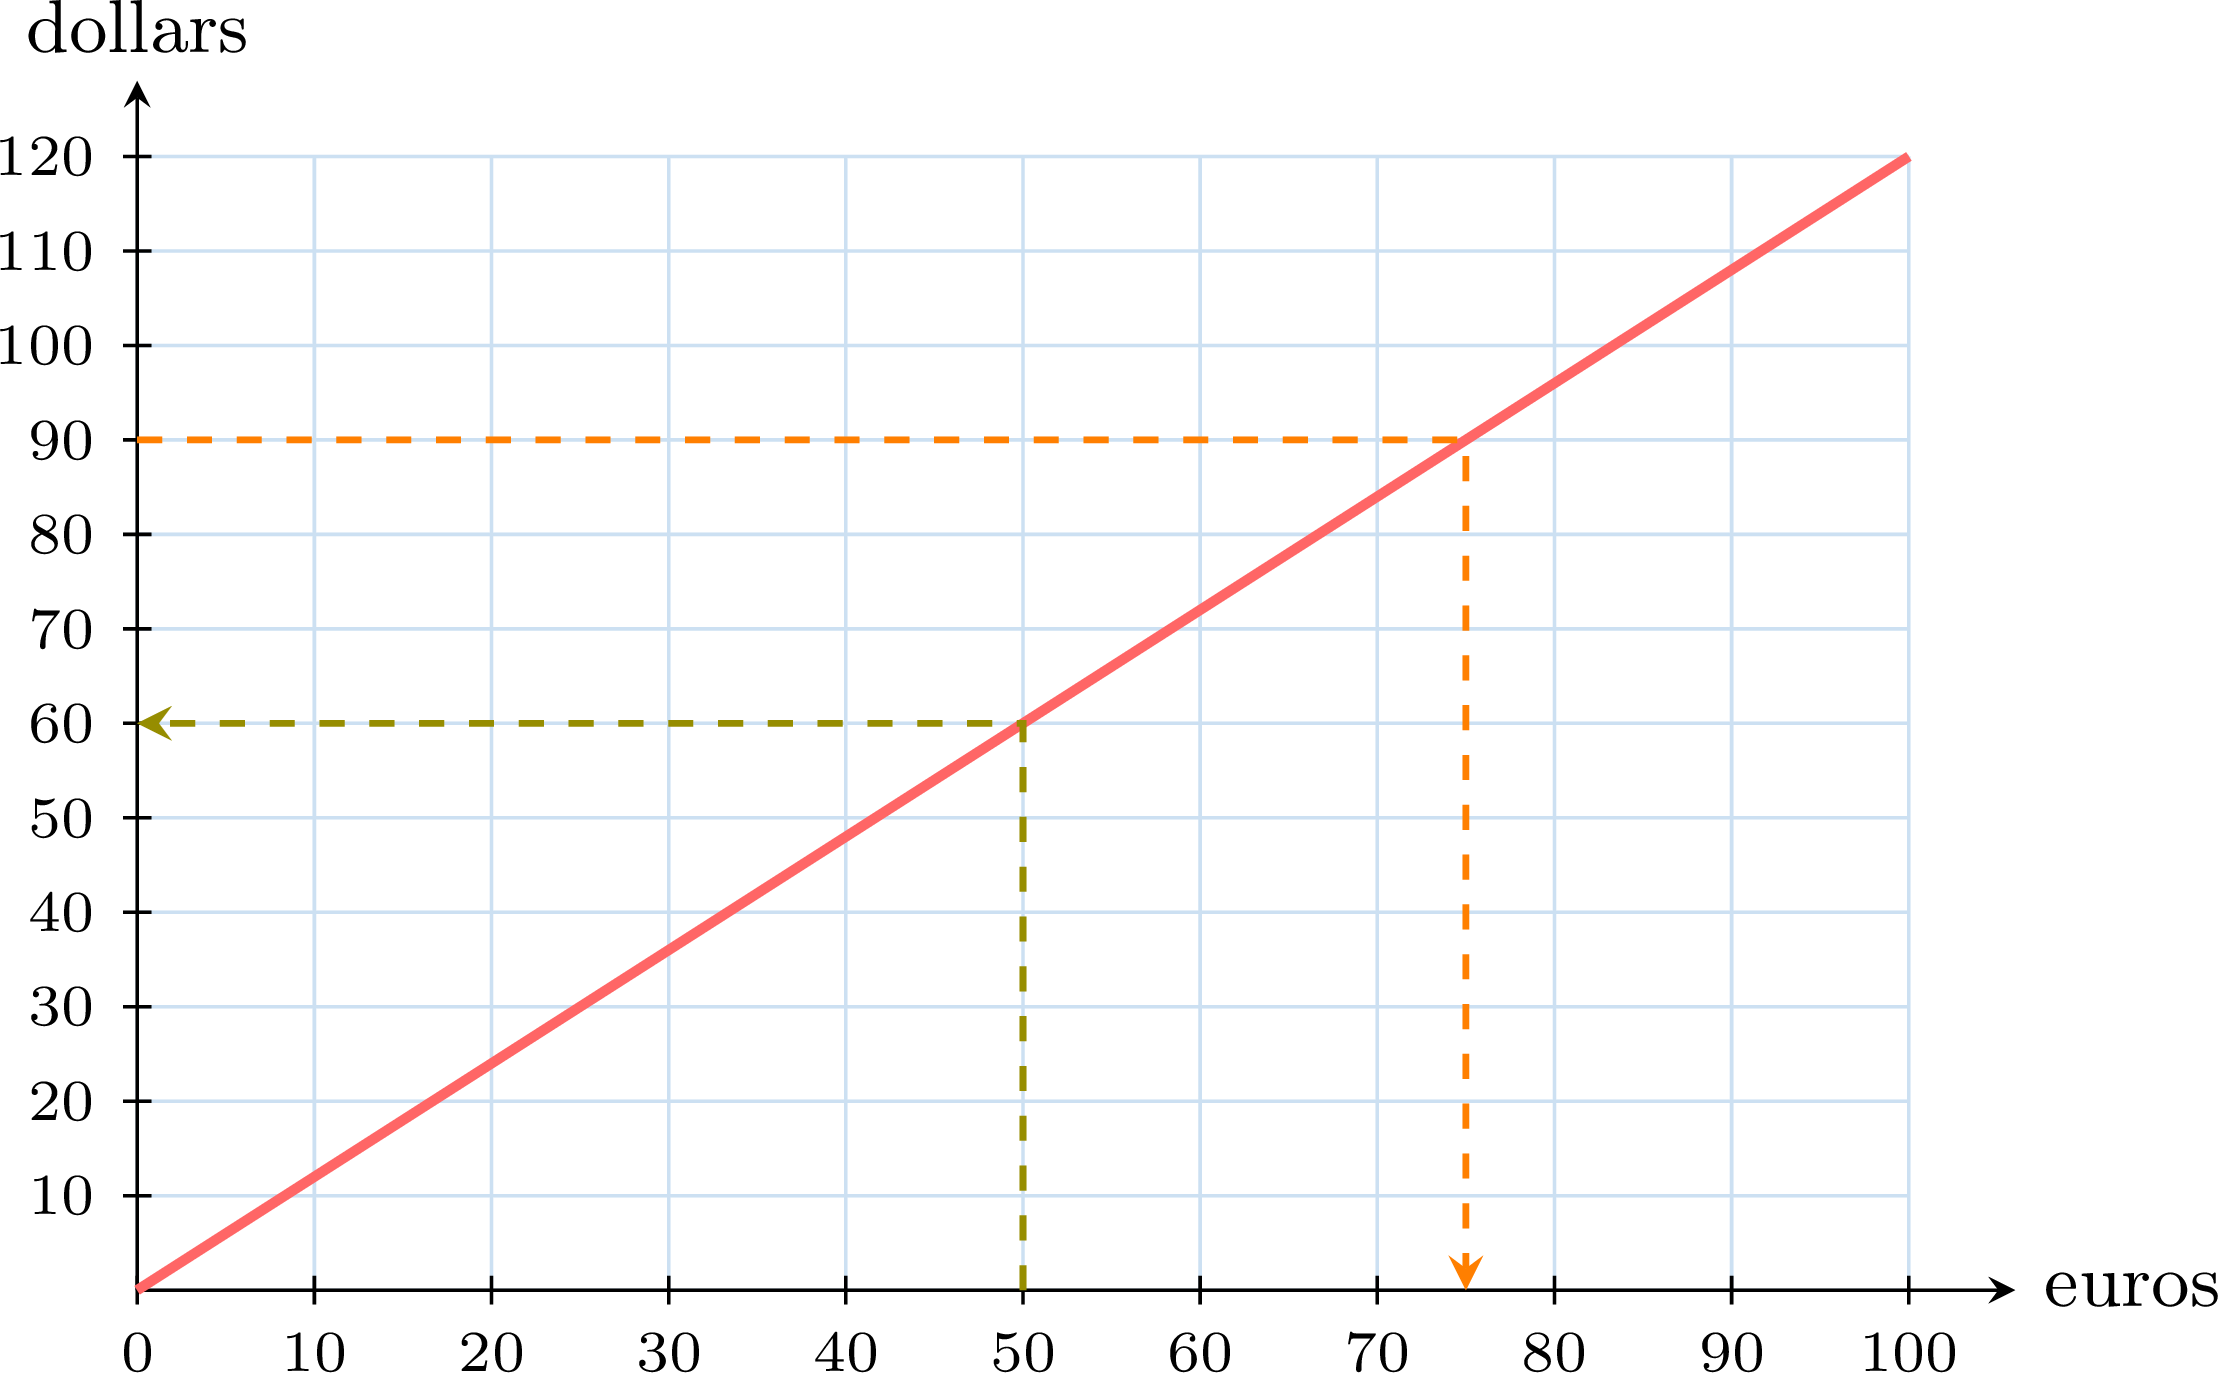
- From \(50\) on the euro axis, go up to the line, then across to the dollar axis: \(\Euro 50 = \dollar 60\).
- From \(90\) on the dollar axis, go across to the line, then down to the euro axis: the line is reached halfway between \(70\) and \(80\), so \(\dollar 90 = \Euro 75\).
- The graph stops at \(\Euro 100\). Split: \(250 = 100 + 100 + 50\), with \(\Euro 100 = \dollar 120\) and \(\Euro 50 = \dollar 60\) read on the graph: $$\begin{aligned}[t] \Euro 250 &= \Euro 100 + \Euro 100 + \Euro 50\\ &= \dollar 120 + \dollar 120 + \dollar 60\\ &= \dollar 300. \end{aligned}$$ Splitting is allowed because the line goes through the origin.
Example
A road sign shows that \(8\) km is about \(5\) miles. Using \(8\) km \(= 5\) miles, draw a conversion graph for distances from \(0\) to \(80\) km. Then read on the graph: - \(64\) km in miles;
- \(15\) miles in kilometres.
A table from the known pair: \(80 = 10 \times 8\), so \(80\) km \(= 10 \times 5 = 50\) miles, and \(40 = 5 \times 8\), so \(40\) km \(= 5 \times 5 = 25\) miles.
The kilometre axis goes in steps of \(8\) km and the mile axis in steps of \(5\) miles, so that the line passes through corners of the grid. Plot the three points and join them with a ruler. 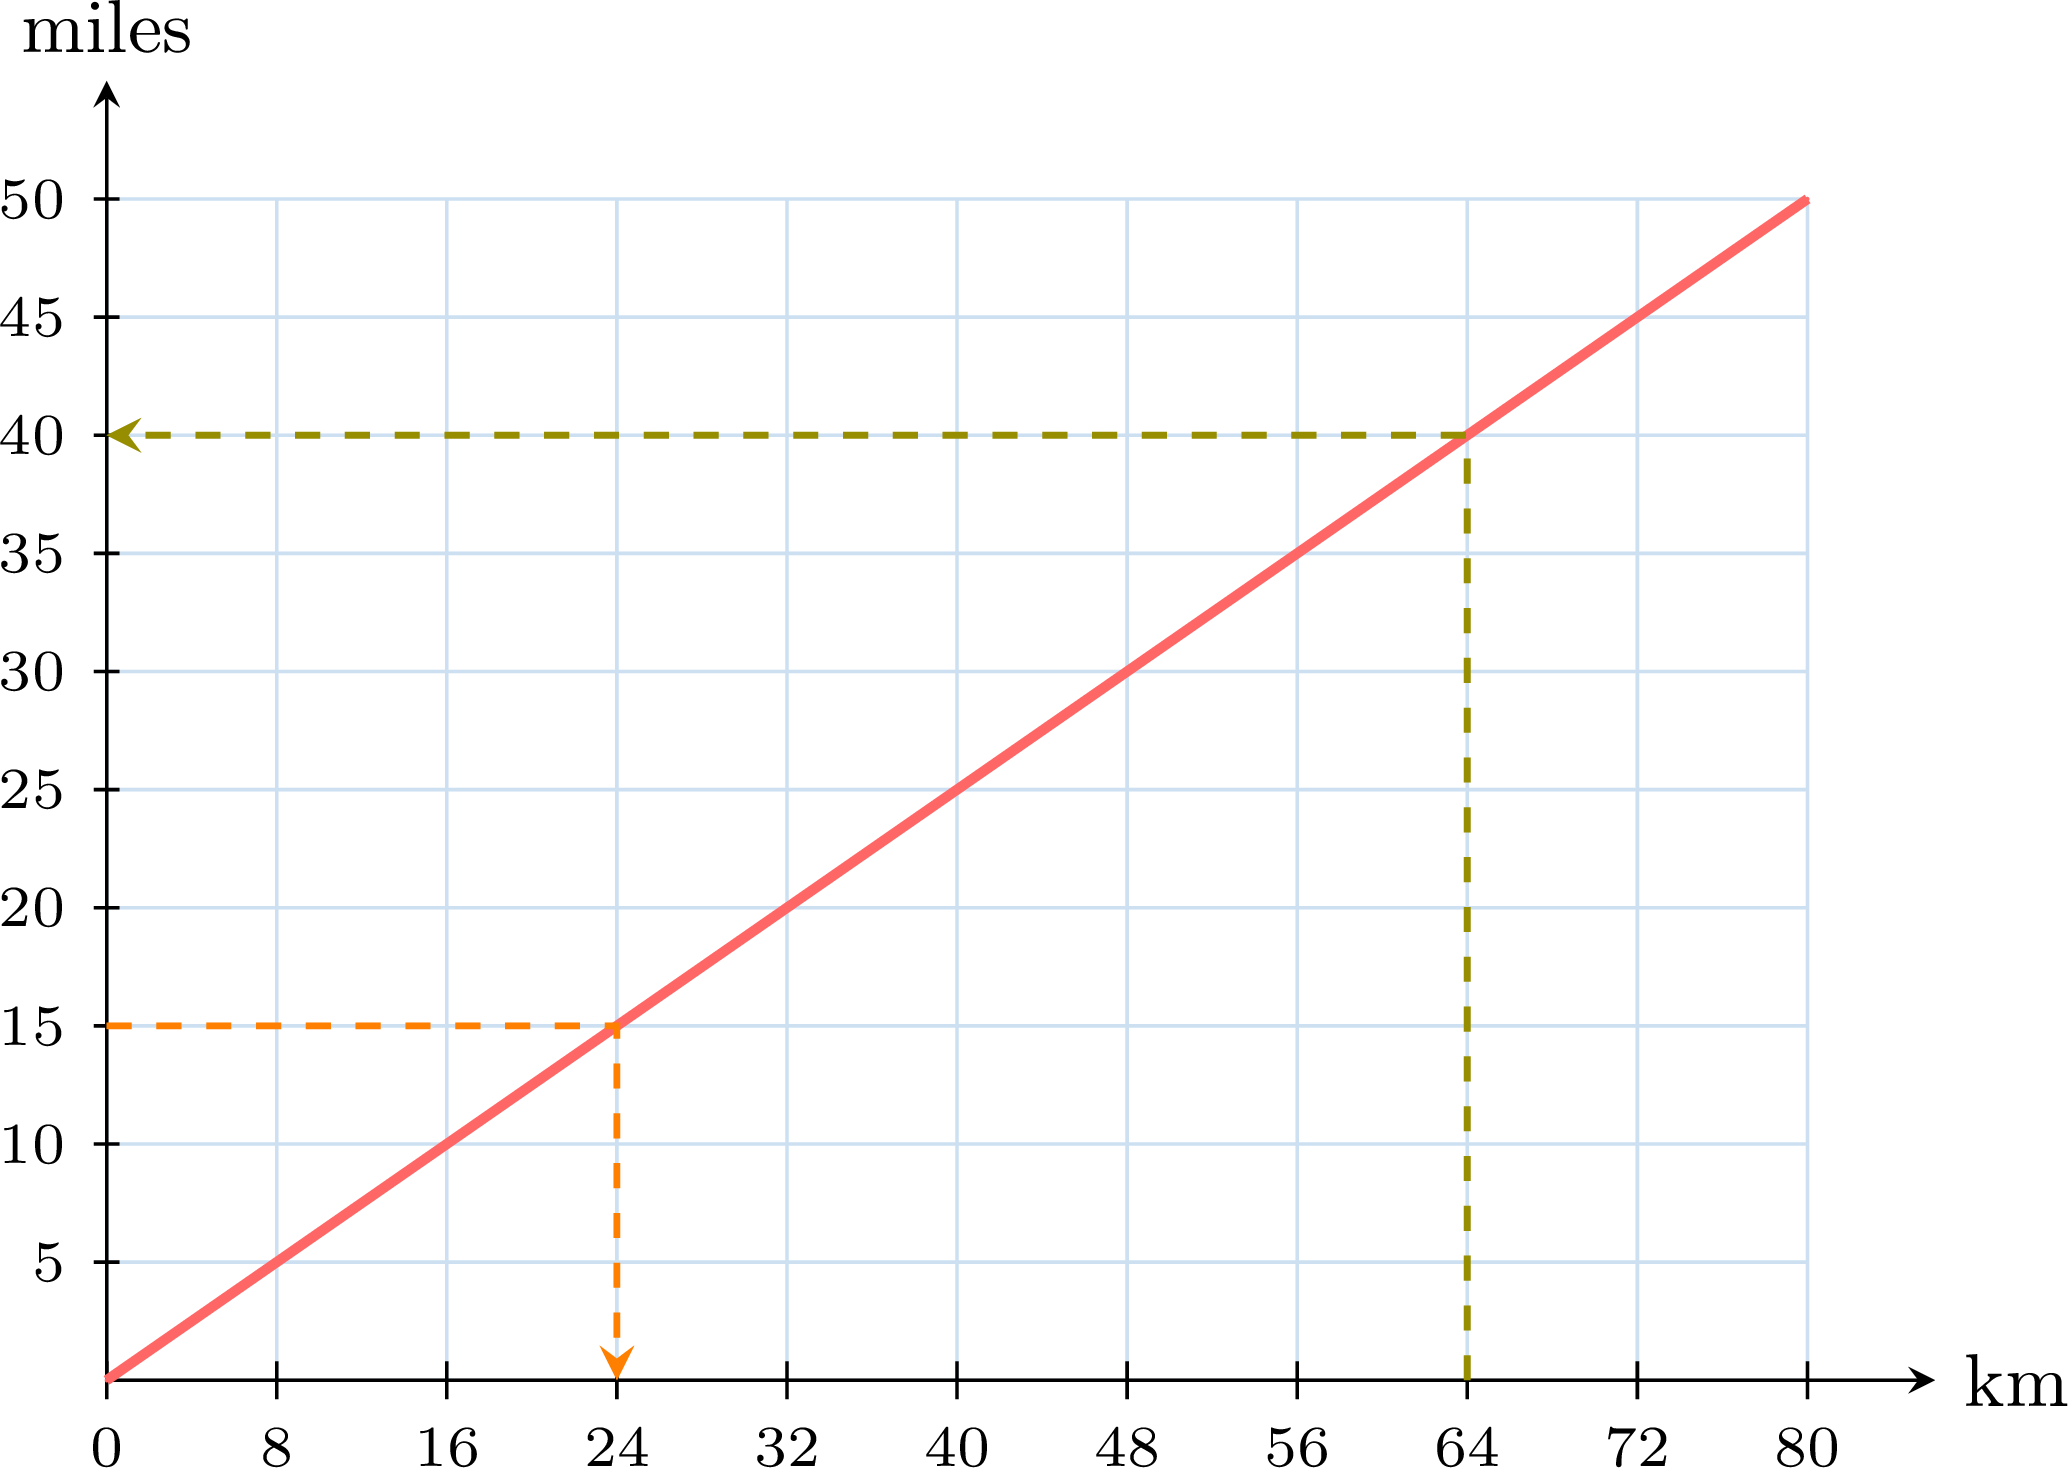
| km | \(0\) | \(40\) | \(80\) |
| miles | \(0\) | \(25\) | \(50\) |
- From \(64\) km, go up to the line, then across: \(64\) km \(= \mathbf{40}\) miles.
- From \(15\) miles, go across to the line, then down: \(15\) miles \(= \mathbf{24}\) km.
Example
The graph converts temperatures in degrees Celsius (\(^\circ\)C) into degrees Fahrenheit (\(^\circ\)F). It passes through the points \((0, 32)\), \((10, 50)\), \((20, 68)\) and \((100, 212)\). 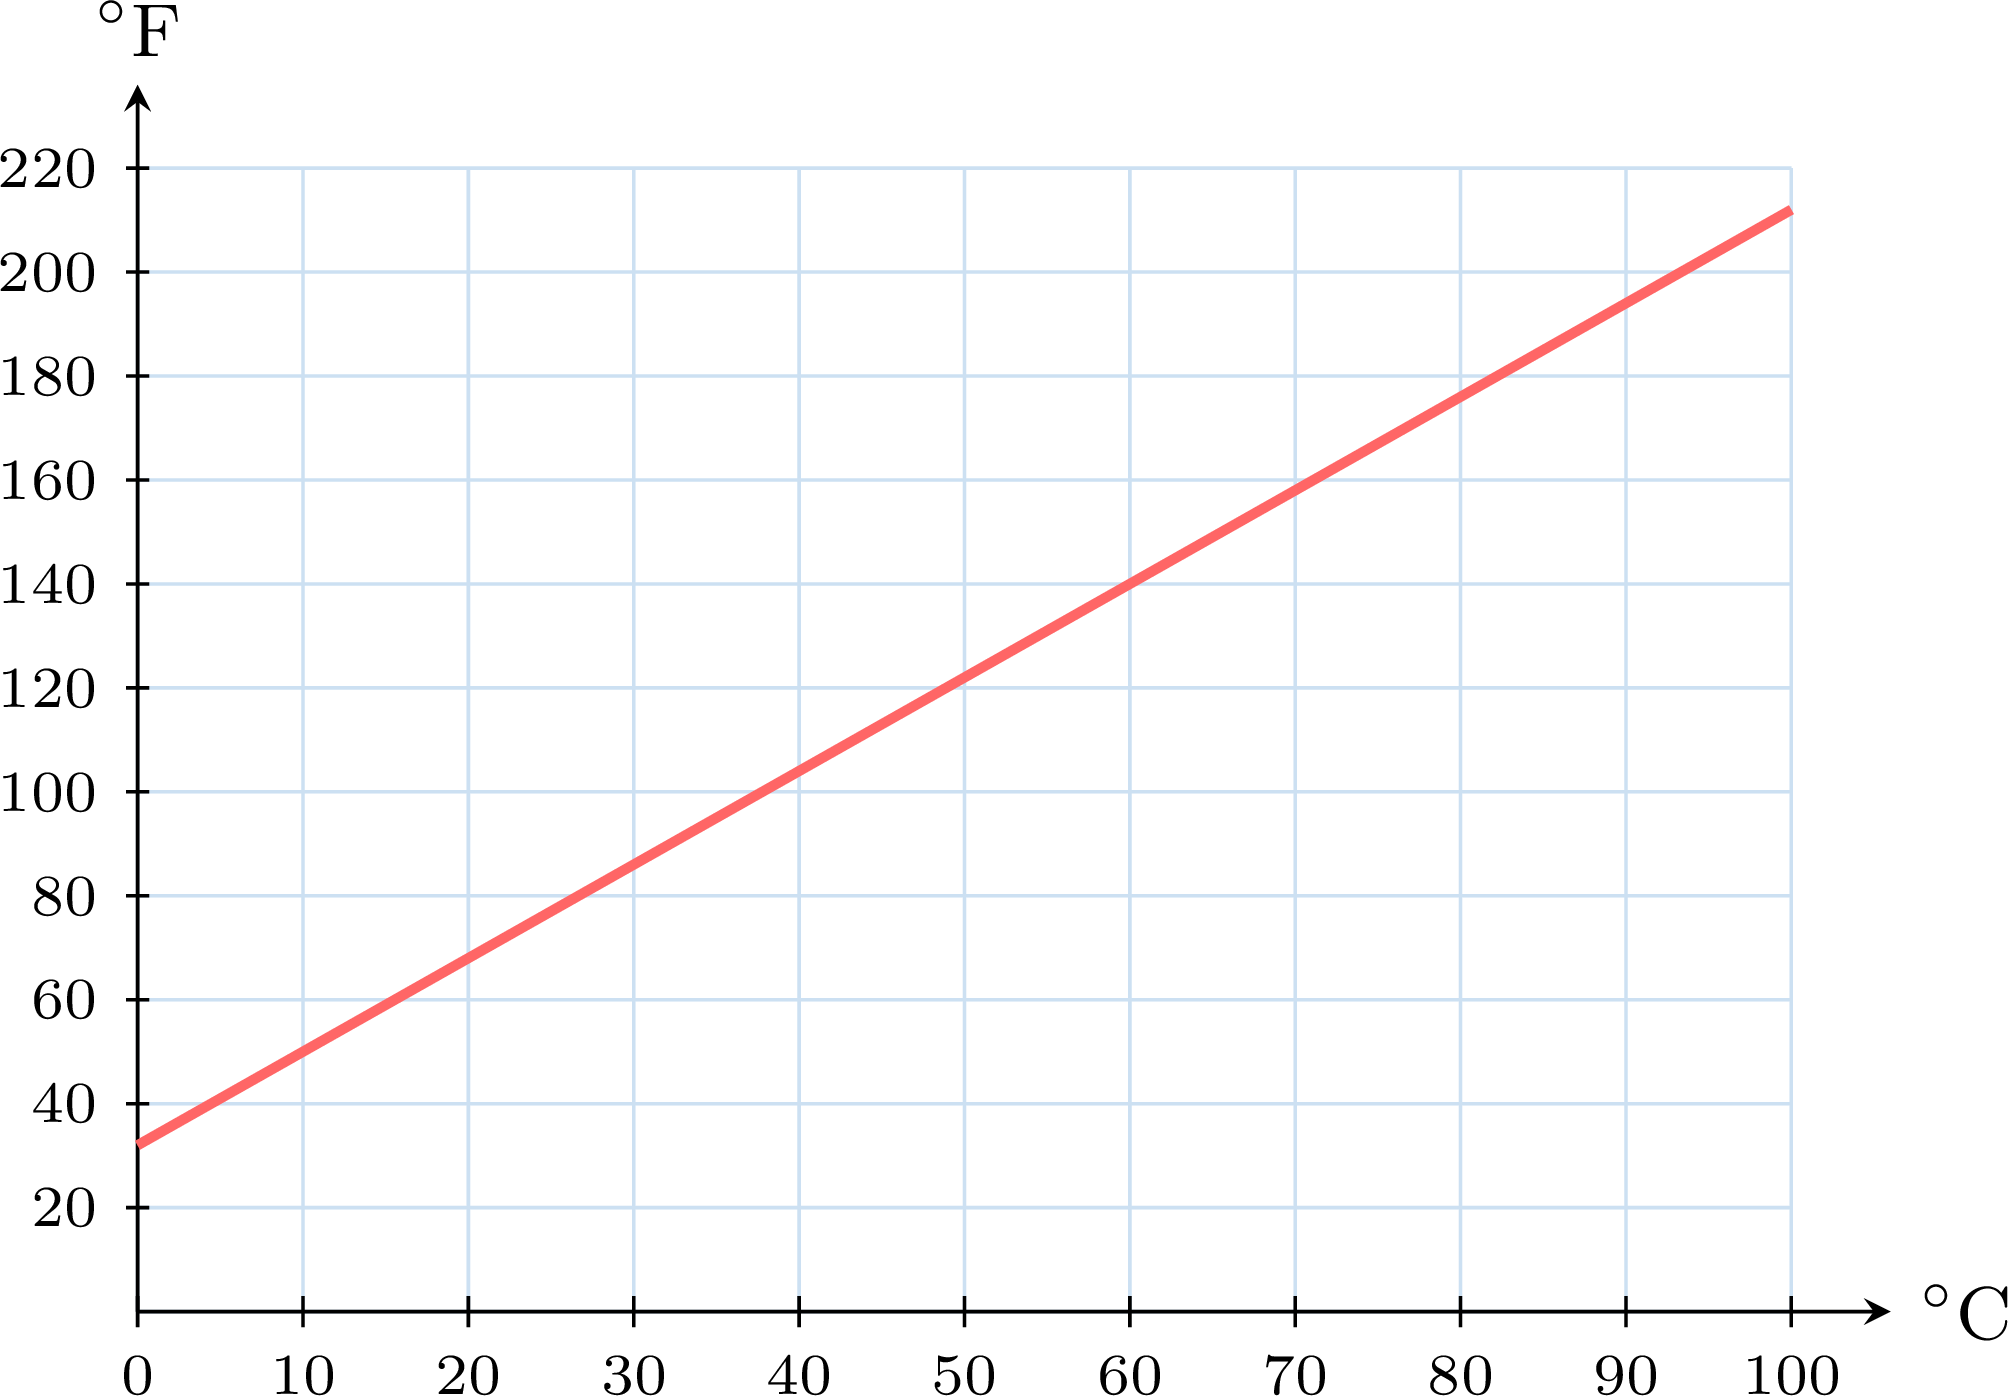
- Where does the line meet the vertical axis? What does this point say?
- Use the graph to write \(140\,^\circ\)F in degrees Celsius.
- Lina says: “\(10\,^\circ\)C is \(50\,^\circ\)F, so \(20\,^\circ\)C is \(100\,^\circ\)F.” Use the graph to check her claim.
One step is \(10\,^\circ\)C on the horizontal axis and \(20\,^\circ\)F on the vertical axis. 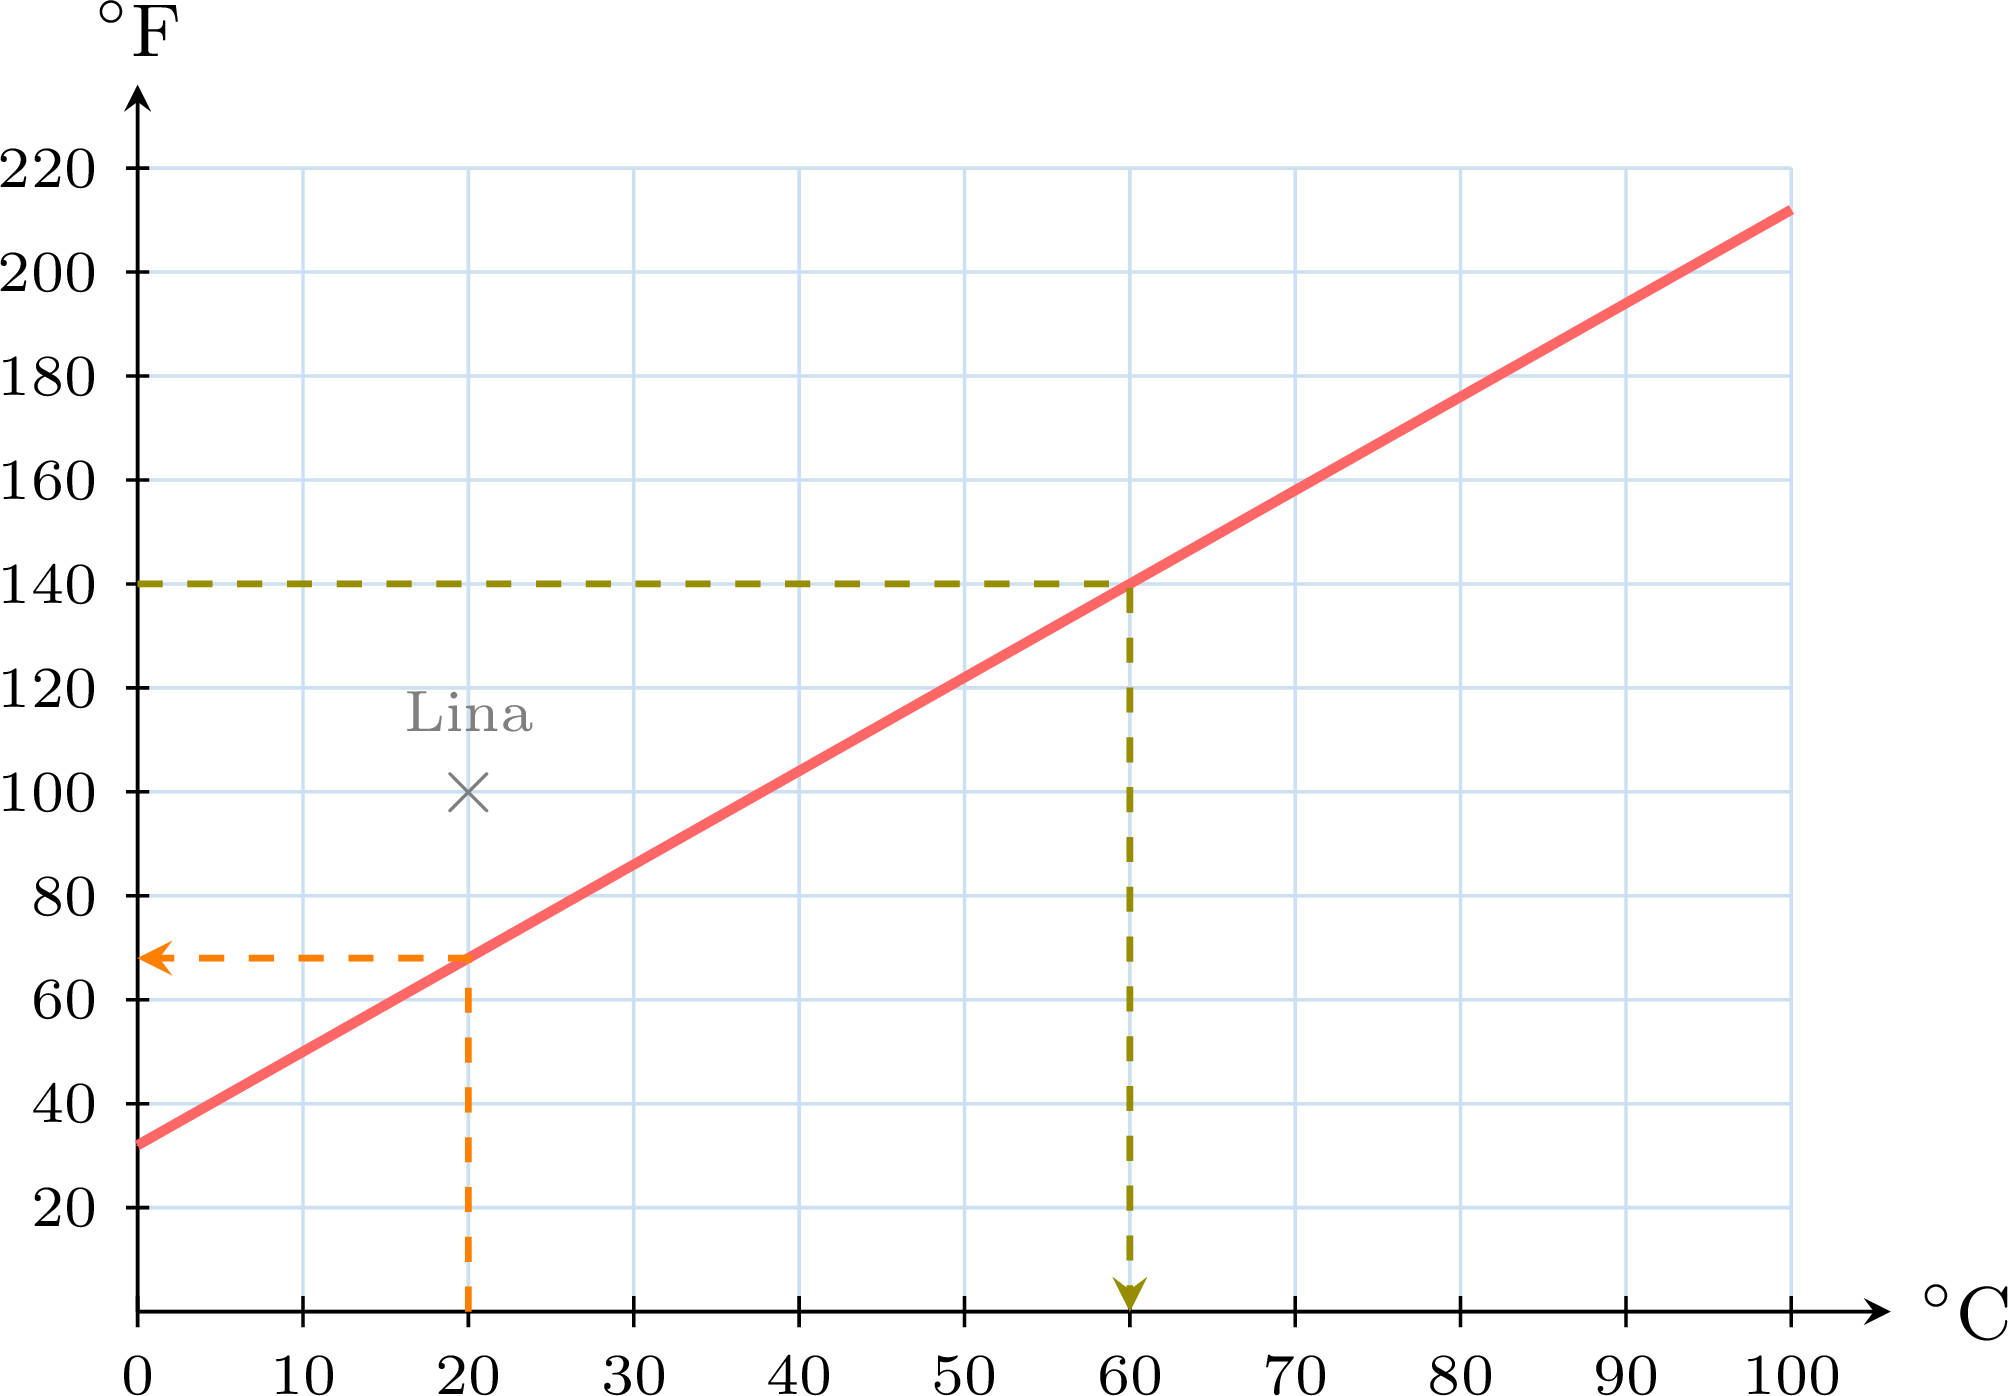
- The line meets the vertical axis at \(32\): the point \((0, 32)\) says that \(0\,^\circ\)C is \(32\,^\circ\)F. The two scales do not have the same zero, so the line does not go through the origin.
- From \(140\) on the \(^\circ\)F axis, go across to the line, then down: \(140\,^\circ\)F \(= \mathbf{60}\,^\circ\)C.
- From \(20\) on the \(^\circ\)C axis, go up to the line: it is reached between \(60\) and \(80\), a little below \(70\) — the point \((20, 68)\), so \(20\,^\circ\)C \(= 68\,^\circ\)F, far from \(100\,^\circ\)F: Lina's point \((20, 100)\) is not on the line. Lina is wrong: doubling a temperature in \(^\circ\)C does not double it in \(^\circ\)F, because the line does not go through the origin. Going from \(10\,^\circ\)C to \(20\,^\circ\)C adds \(18\,^\circ\)F: \(50 + 18 = 68\).
Skills to practice
- Choosing the Correct Reading of a Conversion Graph
- Converting with a Graph
- Drawing a Conversion Graph
V
Going further
Skills to practice
- Reasoning and Problem-Solving
- Solving Problems in Context
- Quiz
Jump to section