International Baccalaureate · MYP 4
Quadratic Functions
I
Quadratic Functions and Their Graphs
I.1
The Square Function
Definition — Square Function
The square function is defined on \(\mathbb{R}\) by \(f(x) = x^2\). This means that each input value \(x\) is multiplied by itself to give the output. 
- Domain: All real numbers (\(\mathbb{R}\)).
- Shape: A curve called a parabola opening upwards.
Proposition — Properties
- For any real number \(x\), \(x^2 \geq 0\).
- The square function is strictly decreasing on \((-\infty, 0]\) and strictly increasing on \([0, +\infty)\).

- The square function is even: its graph is symmetric with respect to the \(y\)-axis (\(f(-x) = f(x)\)).
Let \(f(x) = x^2\).
- The product of two real numbers with the same sign is always non-negative, so \(x^2 = x \times x \geq 0\).
- Parity: \(f(-x) = (-x)^2 = (-x) \times (-x) = x^2 = f(x)\). Thus, \(f\) is even.
- Variations:
- Let \(a\) and \(b\) be two real numbers such that \(0 \leq a < b\).$$f(b) - f(a) = b^2 - a^2 = (b - a)(b + a)$$ Since \(b > a\), then \((b - a) > 0\). Since \(a\) and \(b\) are non-negative and not both zero, \((b + a) > 0\).
The product is positive, so \(f(b) - f(a) > 0\), meaning \(f(a) < f(b)\). \(f\) is strictly increasing on \([0, +\infty)\). - Let \(a\) and \(b\) be two real numbers such that \(a < b \leq 0\).
In this case, \((b - a) > 0\) but \((b + a) < 0\).
The product is negative, so \(f(b) - f(a) < 0\), meaning \(f(a) > f(b)\). \(f\) is strictly decreasing on \((-\infty, 0]\).
- Let \(a\) and \(b\) be two real numbers such that \(0 \leq a < b\).$$f(b) - f(a) = b^2 - a^2 = (b - a)(b + a)$$ Since \(b > a\), then \((b - a) > 0\). Since \(a\) and \(b\) are non-negative and not both zero, \((b + a) > 0\).
Example
The area of a square with side length \(x\) is given by \(A(x) = x^2\). 
Skills to practice
- Comparing Squares
I.2
Quadratic Functions
Linear functions have straight lines as graphs. Quadratic functions come next: functions containing an \(x^2\) term, whose graphs are symmetrical curves called parabolas. In mathematics and science, quadratic functions model, for example, the path of a thrown ball or the shape of a satellite dish. We learn to identify and graph these functions, and to solve the equations that come with them.
A quadratic function is a polynomial of degree two. Its defining feature is the \(x^2\) term, which distinguishes it from a linear function.
Definition — Quadratic Function
A quadratic function is a function that can be written in the form $$f(x) = ax^2 + bx + c$$ where \(a, b,\) and \(c\) are real numbers and \(\boldsymbol{a \neq 0}\). Example
For \(f(x) = x^2 - 3x + 1\), evaluate \(f(2)\).
\(\begin{aligned}[t]f(2) &= (2)^2 - 3(2) + 1 \\&= 4 - 6 + 1 \\&= -1\end{aligned}\)
Skills to practice
- Recognising Quadratic Functions
- Identifying the Coefficients
- Finding Images
- Justifying That a Function Is Quadratic
I.3
The Graph of a Quadratic Function
The graph of every quadratic function has a characteristic U-shape (either upright or inverted) called a parabola. This shape is found in many areas of science and nature.
The parabola is one of the conic sections, which are the group of curves obtained by intersecting a cone with a plane. A parabola is produced by intersecting the cone with a plane parallel to one of its generating lines and not passing through its apex. 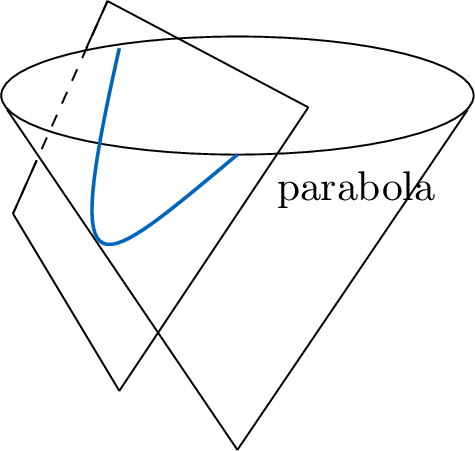
The parabola is one of the conic sections, which are the group of curves obtained by intersecting a cone with a plane. A parabola is produced by intersecting the cone with a plane parallel to one of its generating lines and not passing through its apex.
Example
Sketch the graph of \(f(x) = x^2 - x - 1\).
A table of values is
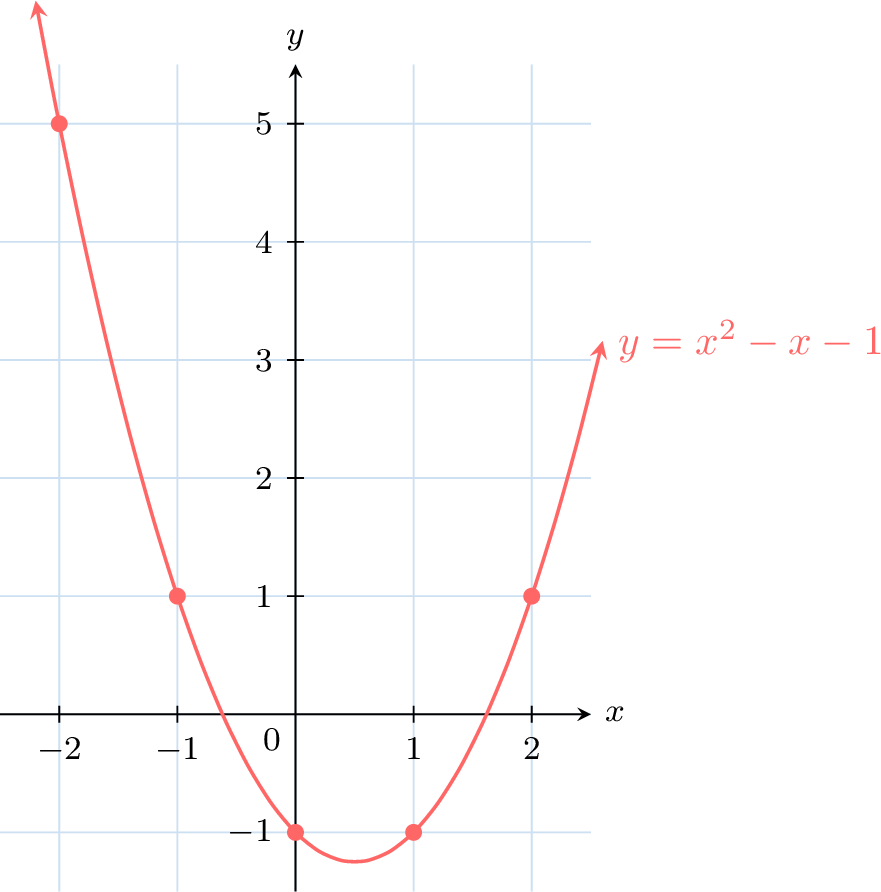
| \(x\) | \(-2\) | \(-1\) | 0 | 1 | 2 |
| \(y\) | 5 | 1 | \(-1\) | \(-1\) | 1 |
The coefficient \(a\) in \(ax^2+bx+c\) controls whether the parabola opens upwards or downwards. To see this interactively, use the GeoGebra animation at https://www.geogebra.org/m/gn3c2sqe.
Proposition — The Parabola and Its Axis of Symmetry
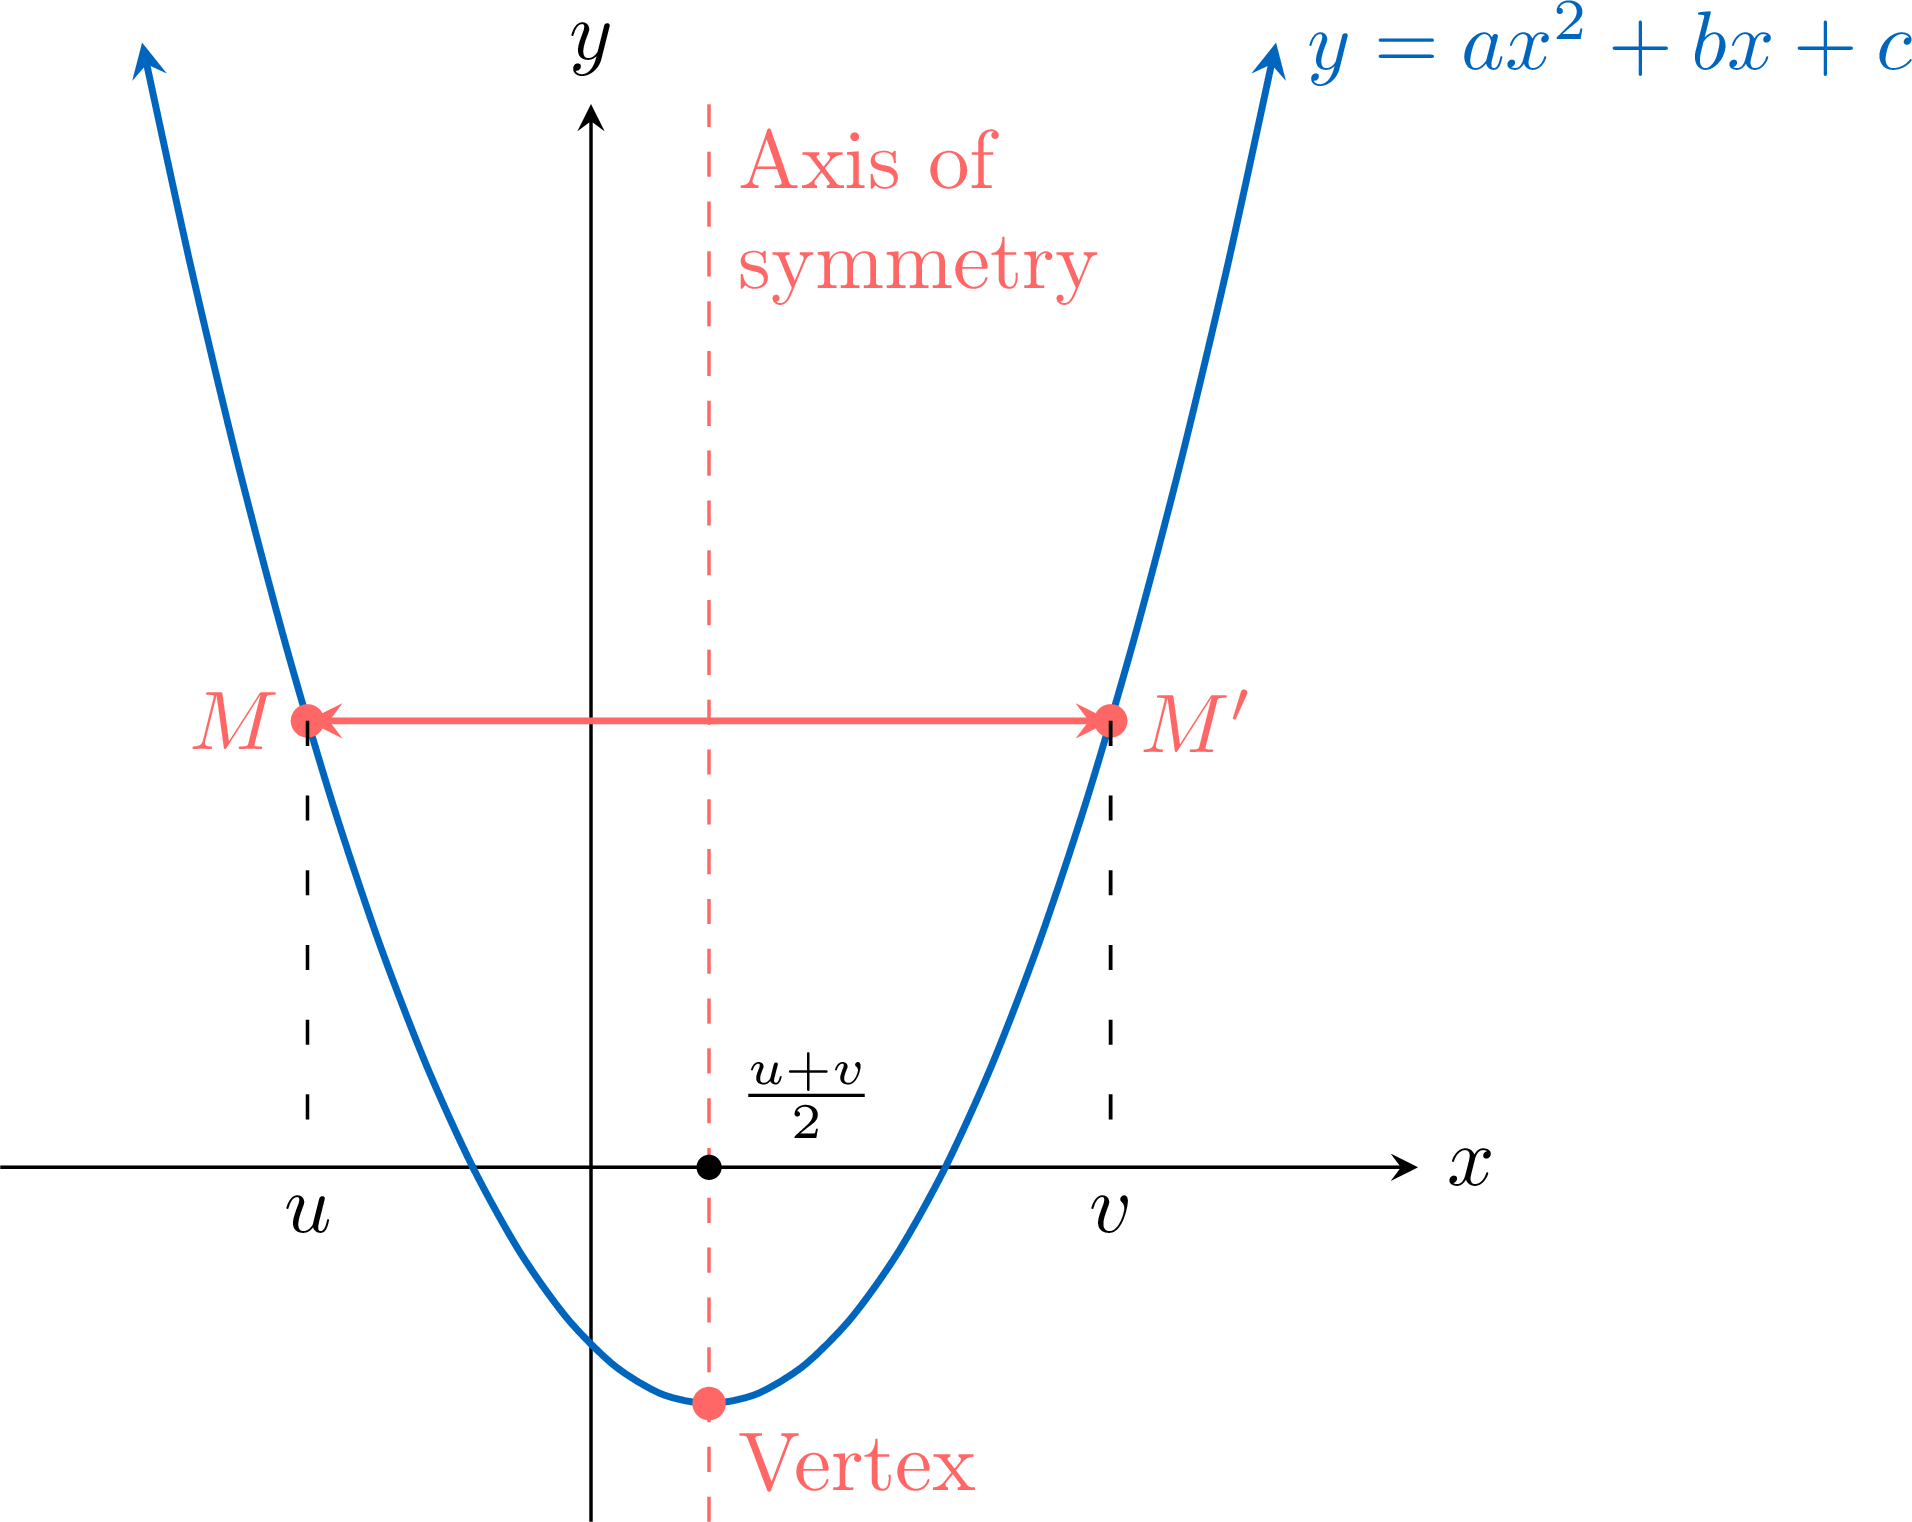
The graph of a quadratic function \(f(x) = ax^2 + bx + c\) is a parabola. - Axis of symmetry: the parabola has a vertical axis of symmetry. Two points of the parabola with the same \(y\)-value are symmetric about this axis: if \(f(u) = f(v)\) with \(u \neq v\), the axis is the line \(x = \dfrac{u+v}{2}\), through the midpoint of their \(x\)-coordinates.
- Vertex: the point of the parabola that lies on the axis. It is the lowest point if the parabola opens upwards, and the highest point if it opens downwards.
- \(y\)-intercept: the number \(f(0) = c\); the parabola crosses the \(y\)-axis at the point \((0, c)\).
- \(x\)-intercepts: the numbers \(x\) such that \(f(x) = 0\), also called the roots of \(f\); they are the \(x\)-coordinates of the points where the parabola meets the \(x\)-axis. Two such points have the same \(y\)-coordinate \(0\), so, for two roots \(x_1\) and \(x_2\), the axis is \(x = \dfrac{x_1+x_2}{2}\).
Proposition — Direction of Opening
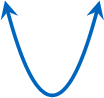
For any quadratic function \(f(x) = ax^2 + bx + c\): - If \(a > 0\), the parabola opens upwards (it is concave up) and has a minimum value at its vertex.
 .
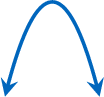
- If \(a < 0\), the parabola opens downwards (it is concave down) and has a maximum value at its vertex.
 .
Skills to practice
- Determining the Direction of Opening from the Sign of \(a\)
- Plotting and Reading Parabolas
I.4
Finding \(x\) from \(y\)
Solving the equation \(f(x) = k\), for a quadratic function \(f\) and a given number \(k\), means finding the input value(s) \(x\) that give the output \(k\). This process results in a quadratic equation. A particularly important case is solving \(f(x) = 0\), which gives the \(x\)-intercepts of the parabola.
Example
Let \(f(x) = x^2 - 2x - 3\). Find the values of \(x\) such that \(f(x) = 5\).
We solve the equation \(f(x) = 5\): $$\begin{aligned} x^2 - 2x - 3 &= 5\\
x^2 - 2x - 8 &= 0 &&\text{(subtract \(5\) from both sides)}\\
(x - 4)(x + 2) &= 0 &&\text{(factorise: \((-4) \times 2 = -8\) and \((-4) + 2 = -2\))} \end{aligned}$$ By the null factor law, \(x - 4 = 0\) or \(x + 2 = 0\), so \(x = 4\) or \(x = -2\).
Check: \(f(4) = 16 - 8 - 3 = 5\) and \(f(-2) = 4 + 4 - 3 = 5\).
The values of \(x\) such that \(f(x) = 5\) are \(\boldsymbol{-2}\) and \(\boldsymbol{4}\).
Check: \(f(4) = 16 - 8 - 3 = 5\) and \(f(-2) = 4 + 4 - 3 = 5\).
The values of \(x\) such that \(f(x) = 5\) are \(\boldsymbol{-2}\) and \(\boldsymbol{4}\).
Skills to practice
- Finding the Inputs That Give an Output
- Calculating the Inputs That Give an Output
II
Transformations of Graphs
II.1
Translations
Function transformations allow us to take a basic “parent” function and modify it to create a new, related function. By applying a sequence of transformations, we can shift, stretch, compress, or reflect the graph of the parent function.
Understanding these transformations is essential, as it allows us to predict the graph of a complex function based on a simpler one and to model real-world phenomena by adjusting a basic function to fit observed data. The transformations are vertical and horizontal translations, stretches and compressions, and reflections.
Understanding these transformations is essential, as it allows us to predict the graph of a complex function based on a simpler one and to model real-world phenomena by adjusting a basic function to fit observed data. The transformations are vertical and horizontal translations, stretches and compressions, and reflections.
Definition — Vertical Translation by Adding a Constant
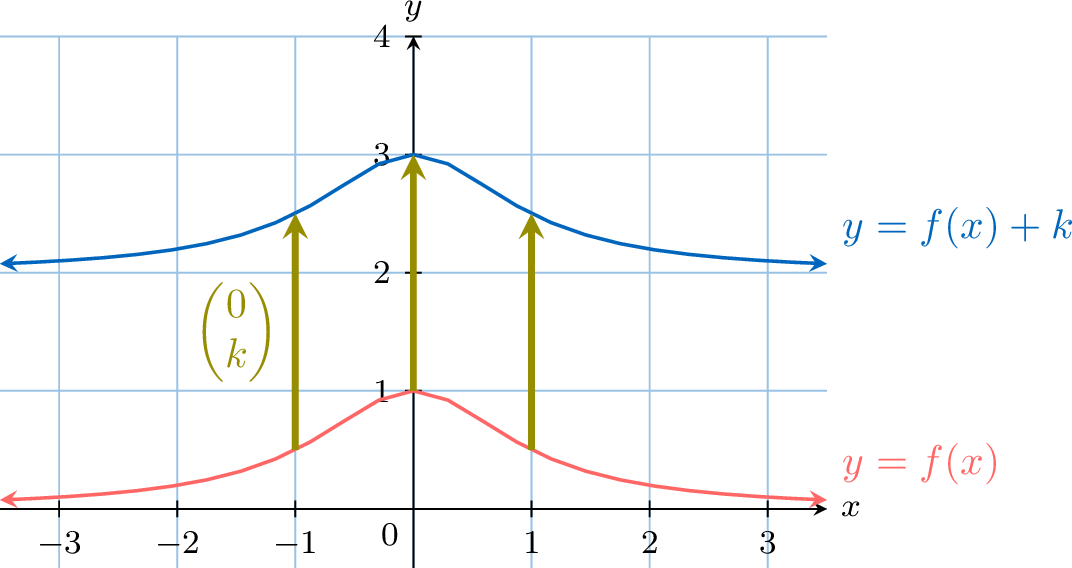
A vertical translation shifts the graph of a function up or down. The transformation is defined by:$$g(x) = f(x) + k$$ This transformation maps a point \((x, y)\) on the graph of \(f\) to a new point \((x, y+k)\) on the graph of \(g\). - If \(k>0\), the graph is translated \(\boldsymbol{k}\) units up.
- If \(k<0\), the graph is translated \(\boldsymbol{|k|}\) units down.
Definition — Horizontal Translation
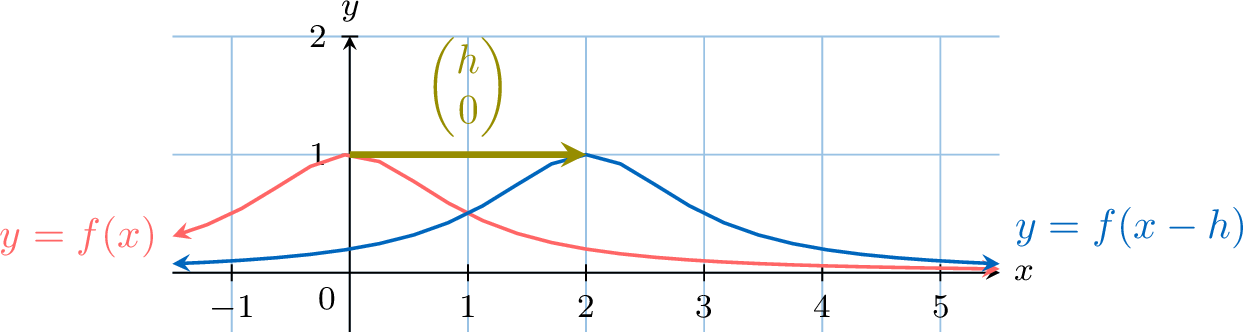
A horizontal translation shifts the graph of a function left or right. The transformation is defined by:$$g(x) = f(x-h)$$ This transformation maps a point \((x, y)\) on the graph of \(f\) to a new point \((x+h, y)\) on the graph of \(g\). - If \(h>0\), the graph is translated \(\boldsymbol{h}\) units to the right.
- If \(h<0\), the graph is translated \(\boldsymbol{|h|}\) units to the left.
Example
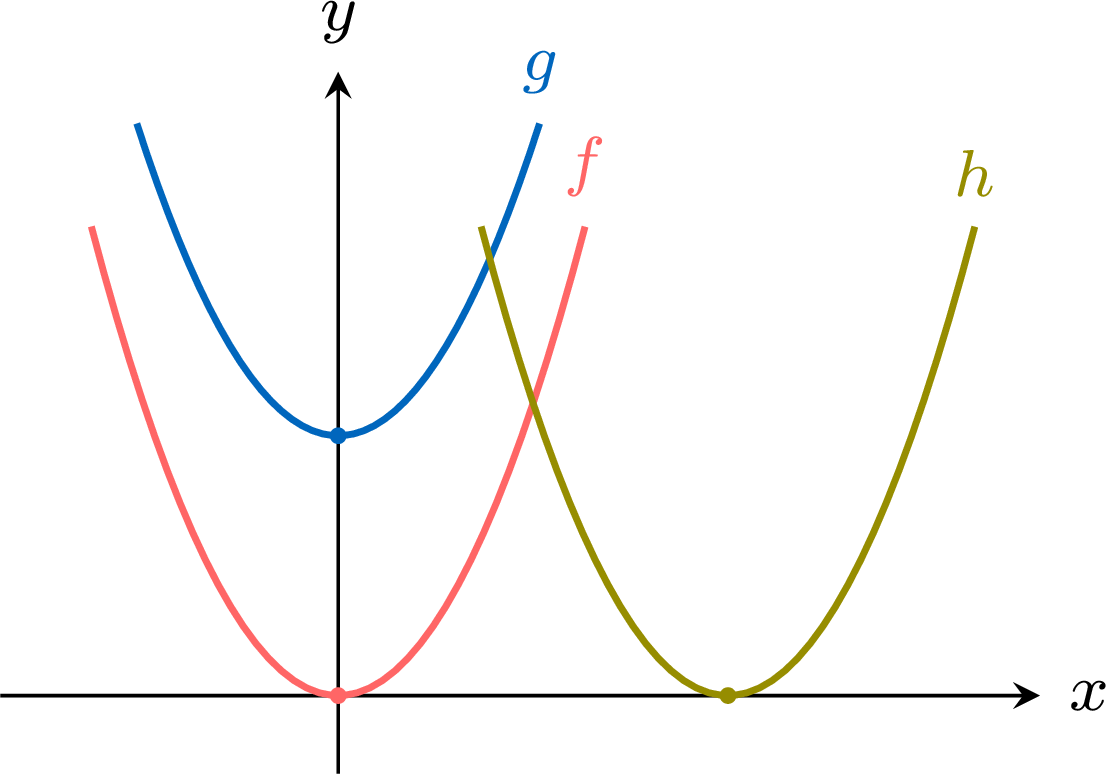
From the graph of \(f(x) = x^2\), plot \(g(x) = f(x) + 2\) and \(h(x) = f(x - 3)\). - \(g(x) = f(x) + 2\): every output is raised by \(2\) — a vertical translation \(2\) units up. The vertex \((0, 0)\) moves to \((0, 2)\).
- \(h(x) = f(x - 3)\): the input \(x = 3\) now plays the role \(0\) used to play — a horizontal translation \(3\) units to the right. The vertex \((0,0)\) moves to \((3, 0)\).
Translation by a Vector
The vertical and the horizontal translations combine into one. The translation by the vector \(\begin{pmatrix} h \\ k \end{pmatrix}\) moves each point \((x, y)\) of the graph of \(f\) to the point \((X, Y) = (x + h, y + k)\). Since \(x = X - h\) and \(Y = f(x) + k\), the image points satisfy \(Y = f(X - h) + k\); writing \((x, y)\) again for the coordinates, the image of the graph of \(y = f(x)\) is the graph of $$y = f(x - h) + k.$$ For example, the translation by the vector \(\begin{pmatrix} 3 \\ -2 \end{pmatrix}\) maps the graph of \(y = x^2\) onto the graph of \(y = (x - 3)^2 - 2\), and its vertex \((0, 0)\) to \((3, -2)\).
Skills to practice
- Translating Graphs
II.2
Stretches
Definition — Vertical Stretch
A vertical stretch stretches or compresses the graph of a function vertically. It is defined, for a number \(a \neq 0\), by:$$g(x) = a \cdot f(x)$$ This transformation maps a point \((x, y)\) to \((x, ay)\). - If \(|a|>1\), the graph is stretched vertically by a factor of \(|a|\).
- If \(0 < |a| < 1\), the graph is compressed vertically by a factor of \(|a|\).
- If \(a < 0\), the stretch or compression is followed by a reflection in the \(x\)-axis (\(a = -1\) gives the reflection alone).

Definition — Horizontal Stretch
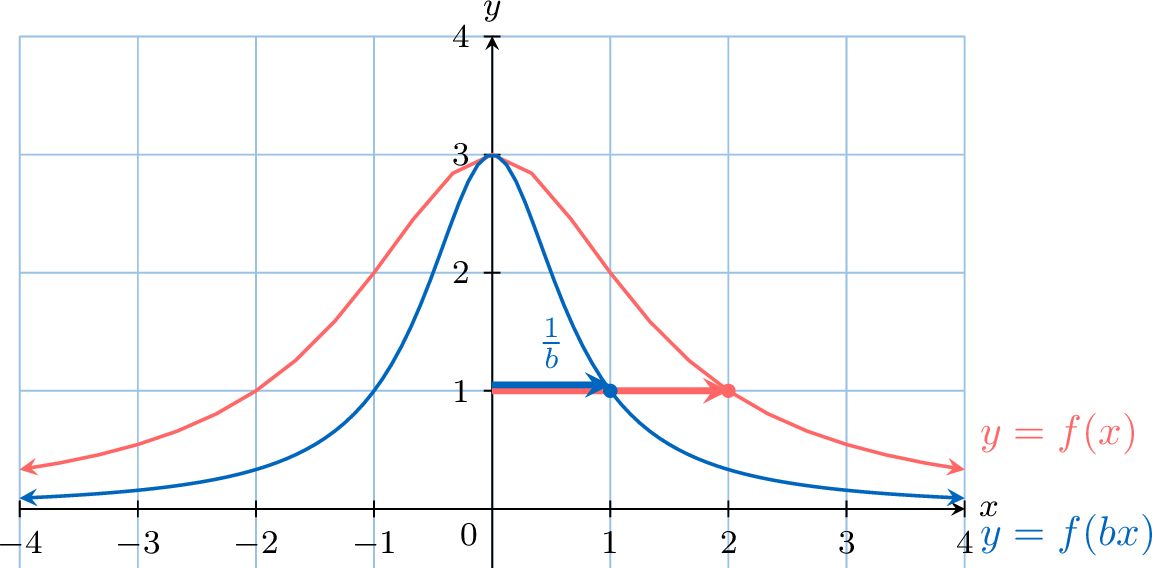
A horizontal stretch stretches or compresses the graph of a function horizontally. It is defined, for a number \(b \neq 0\), by:$$g(x) = f(bx)$$ This transformation maps a point \((x, y)\) to a new point \((\frac{x}{b}, y)\). - If \(|b|>1\), the graph is compressed horizontally by a factor of \(\frac{1}{|b|}\).
- If \(0 < |b| < 1\), the graph is stretched horizontally by a factor of \(\frac{1}{|b|}\).
- If \(b < 0\), the stretch or compression is followed by a reflection in the \(y\)-axis (\(b = -1\) gives the reflection alone).
Example
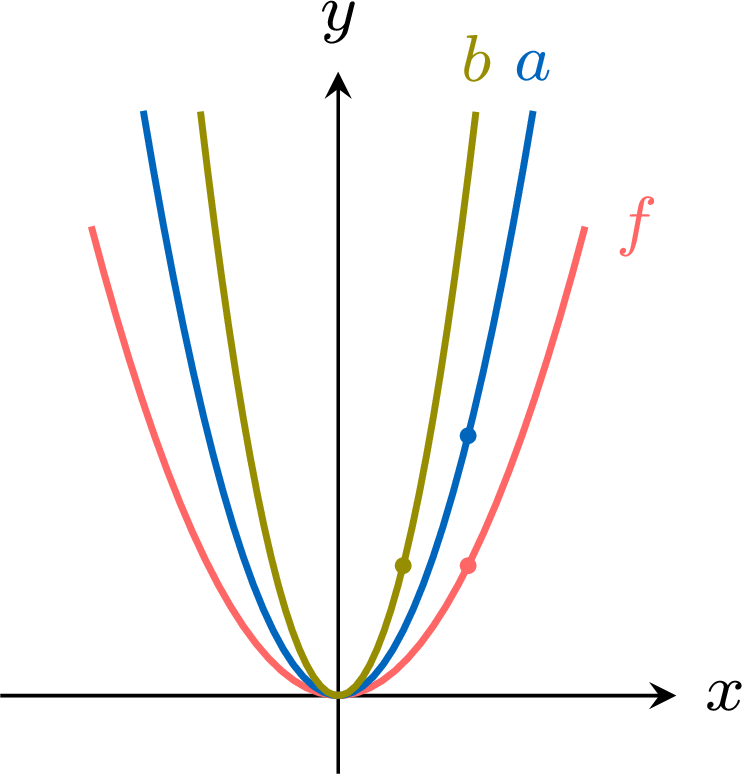
From the graph of \(f(x) = x^2\), plot \(a(x) = 2f(x)\) and \(b(x) = f(2x)\). - \(a(x) = 2f(x) = 2x^2\): every output is doubled — a vertical stretch by factor \(2\). The point \((1, 1)\) moves to \((1, 2)\).
- \(b(x) = f(2x) = 4x^2\): the input is consumed twice as fast — a horizontal compression with scale factor \(\frac12\): every \(x\)-coordinate is halved. The point \((1, 1)\) moves to \(\left(\frac12, 1\right)\).
Stretches and Scale Factors
The number by which a stretch multiplies the distances to the axis that stays fixed is its scale factor. For \(a > 0\), the graph of \(y = a f(x)\) is the image of the graph of \(y = f(x)\) under the vertical stretch with scale factor \(a\): each point \((x, y)\) goes to \((x, ay)\). For \(b > 0\), the graph of \(y = f(bx)\) is its image under the horizontal stretch with scale factor \(\dfrac{1}{b}\): each point \((x, y)\) goes to \(\left(\dfrac{x}{b}, y\right)\). A scale factor greater than \(1\) moves the points away from the axis that stays fixed (the \(x\)-axis for a vertical stretch, the \(y\)-axis for a horizontal one), a scale factor between \(0\) and \(1\) brings them closer to it: the graph of \(y = f(2x)\) is the image of the graph of \(f\) under the horizontal stretch with scale factor \(\dfrac{1}{2}\), a compression.
Skills to practice
- Stretching Graphs
II.3
Reflections
Definition — Reflection in the x-axis
A reflection in the x-axis flips the graph of a function vertically. It is a special case of vertical stretch where \(a=-1\). It is defined by:$$g(x) = -f(x)$$ This transformation maps a point \((x, y)\) to \((x, -y)\). 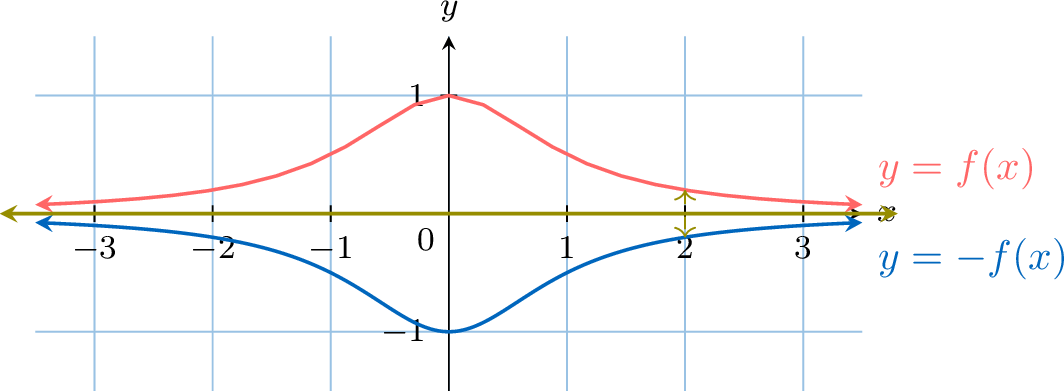
Definition — Reflection in the y-axis
A reflection in the y-axis flips the graph of a function horizontally. It is a special case of horizontal stretch where \(b=-1\). It is defined by:$$g(x) = f(-x)$$ This transformation maps a point \((x, y)\) to \((-x, y)\). 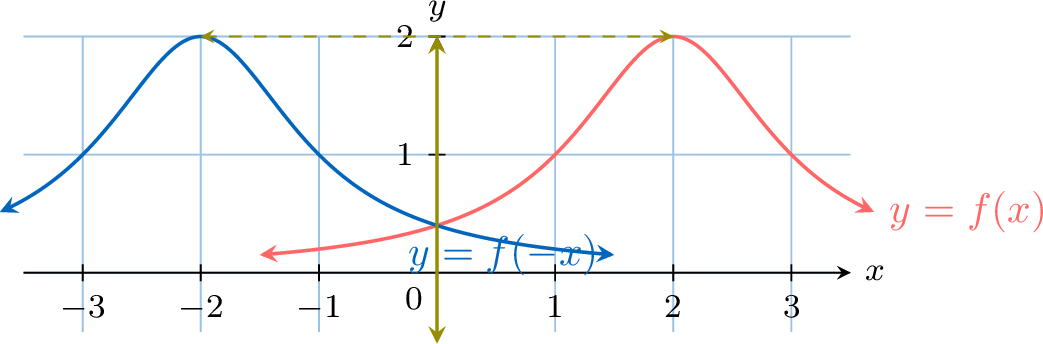
Example
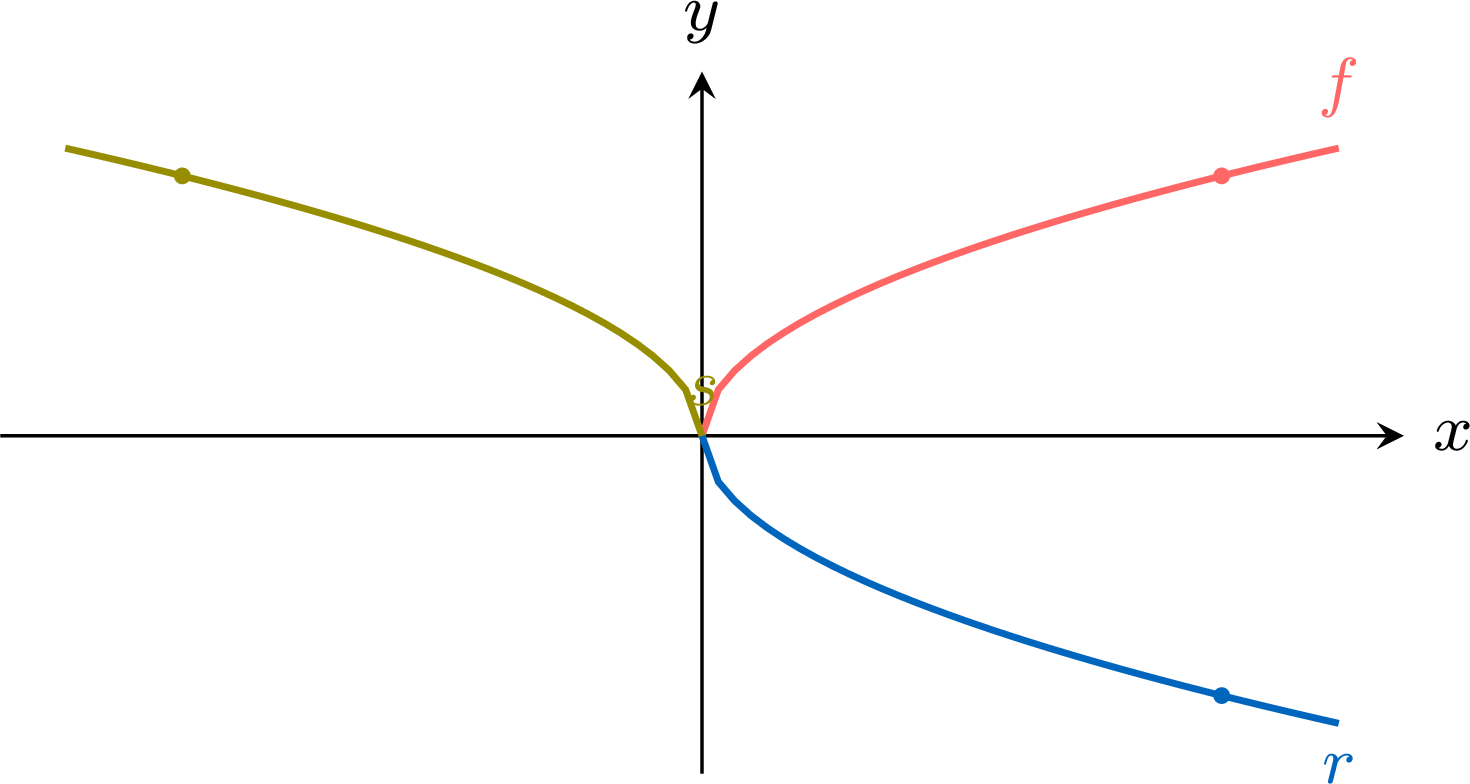
From the graph of \(f(x) = \sqrt{x}\), plot \(r(x) = -f(x)\) and \(s(x) = f(-x)\). - \(r(x) = -\sqrt{x}\): every output changes sign — a reflection in the \(x\)-axis. The curve flips below the axis; the point \((4, 2)\) moves to \((4, -2)\).
- \(s(x) = \sqrt{-x}\): every input changes sign — a reflection in the \(y\)-axis. The curve flips to the left half-plane (defined for \(x \le 0\)); the point \((4, 2)\) moves to \((-4, 2)\).
Skills to practice
- Reflecting Graphs
III
Forms of a Quadratic Function
III.1
Vertex Form
A quadratic function can be expressed in three main forms. Each form highlights different key features of its graph, the parabola. Being able to recognise and convert between these forms is a fundamental skill.
Definition — Vertex Form
The vertex form of a quadratic function is:$$ f(x) = a(x-h)^2 + k $$ where \(a, h,\) and \(k\) are real numbers and \(\boldsymbol{a \neq 0}\). Proposition — Key Features from Vertex Form
The graph of \(y=a(x-h)^2 + k\) is a parabola with: - Direction of opening: Determined by the sign of \(a\).
- If \(a > 0\), it opens upwards (concave up).

- If \(a < 0\), it opens downwards (concave down).

- If \(a > 0\), it opens upwards (concave up).
- Axis of Symmetry: The line \(x = h\).
- Vertex: The point \((h, k)\).
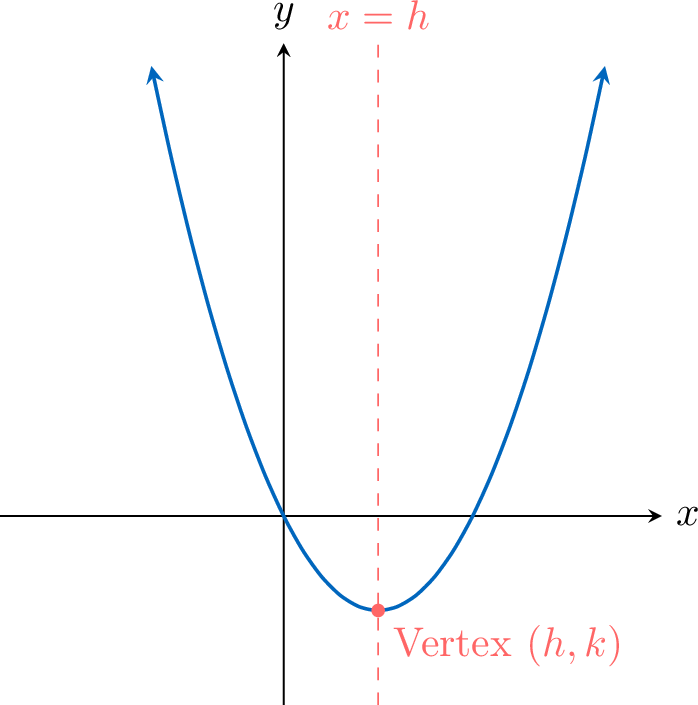
The graph of \(y=a(x-h)^2+k\) is obtained by transforming the graph of \(y=x^2\) as follows:
- Horizontal translation by h: \(y=(x-h)^2\). This moves the vertex from \((0,0)\) to \((h,0)\).
- Vertical stretch by a: \(y=a(x-h)^2\). The direction of opening now depends on the sign of \(a\).
- Vertical translation by k: \(y=a(x-h)^2+k\). This moves the vertex from \((h,0)\) to \((h,k)\).
Notation
In many textbooks the vertex form (also called completed-square form) is written \(f(x) = a(x - \alpha)^2 + \beta\): the letters \(\alpha\) and \(\beta\) play exactly the roles of \(h\) and \(k\), the coordinates of the vertex. In simple cases, the vertex form is obtained directly from the identity \(x^2 + 2\lambda x = (x + \lambda)^2 - \lambda^2\).
Method — Converting from Vertex to Standard Form
To convert from vertex to standard form, expand the squared term and collect like terms. Example
Convert \(f(x) = 2(x-3)^2 + 1\) to standard form.
$$ \begin{aligned}f(x) &= 2(x^2 - 6x + 9) + 1 &&\color{gray}{(\text{Expand }(x-3)^2}) \\
&= 2x^2 - 12x + 18 + 1 &&\color{gray}{(\text{Distribute the 2})} \\
&= \boldsymbol{2x^2 - 12x + 19} &&\color{gray}{(\text{Combine constants})}\end{aligned} $$
Skills to practice
- Converting from Vertex Form to Standard Form
- Finding the Vertex by Completing the Square
- Completing the Square in a Quadratic Expression
III.2
Factored Form
Definition — Factored Form
The factored form of a quadratic function, when it exists, is:$$ f(x) = a(x-p)(x-q) $$ where \(a, p,\) and \(q\) are real numbers and \(\boldsymbol{a \neq 0}\). Proposition — Key Features from Factored Form
The graph of a quadratic function \(f(x)=a(x-p)(x-q)\) is a parabola with: - Direction of opening: Determined by the sign of \(a\).
- If \(a > 0\), it opens upwards (concave up).
- If \(a < 0\), it opens downwards (concave down).
- If \(a > 0\), it opens upwards (concave up).
- \(x\)-intercepts: The graph meets the \(x\)-axis at \((p, 0)\) and \((q, 0)\).
- If \(p \neq q\), there are two distinct \(x\)-intercepts.
- If \(p=q\), there is only one \(x\)-intercept at \((p,0)\), which is also the vertex. The graph touches the x-axis at this point.
- Axis of Symmetry: The line \(x = \frac{p+q}{2}\).
- Vertex: The point \((\frac{p+q}{2},f(\frac{p+q}{2}))\).
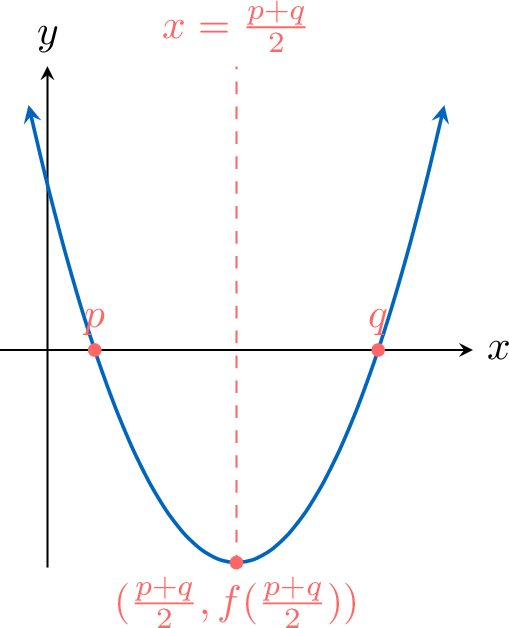
- x-intercepts: The x-intercepts are found by solving \(f(x)=0\). $$ a(x-p)(x-q)=0 $$ By the null factor law, this is true if \(x-p=0\) or \(x-q=0\). Thus, the roots are \(\boldsymbol{x=p}\) and \(\boldsymbol{x=q}\).
- Axis of Symmetry and Vertex: An axis of symmetry at \(x=h\) requires that the function has the same value for any horizontal distance \(d\) to the left or right of the axis. Algebraically, this means \(f(h-d) = f(h+d)\) for any \(d\).
We test the proposed axis of symmetry \(h=\frac{p+q}{2}\). We need to show that \(f\left(\frac{p+q}{2} - d\right) = f\left(\frac{p+q}{2} + d\right)\).- Left side: $$ \begin{aligned} f\left(\frac{p+q}{2} - d\right) &= a\left(\left(\frac{p+q}{2} - d\right) - p\right)\left(\left(\frac{p+q}{2} - d\right) - q\right) \\ &= a\left(\frac{q-p}{2} - d\right)\left(\frac{p-q}{2} - d\right) \\ &= a\left(-\left(\frac{p-q}{2} + d\right)\right)\left(\frac{p-q}{2} - d\right) \\ &= -a\left(\left(\frac{p-q}{2}\right)^2 - d^2\right) \end{aligned} $$
- Right side: $$ \begin{aligned} f\left(\frac{p+q}{2} + d\right) &= a\left(\left(\frac{p+q}{2} + d\right) - p\right)\left(\left(\frac{p+q}{2} + d\right) - q\right) \\ &= a\left(\frac{q-p}{2} + d\right)\left(\frac{p-q}{2} + d\right) \\ &= a\left(-\left(\frac{p-q}{2} - d\right)\right)\left(\frac{p-q}{2} + d\right) \\ &= -a\left(\left(\frac{p-q}{2}\right)^2 - d^2\right) \end{aligned} $$
Method — Converting from Factored to Standard Form
To convert from factored form to standard form, expand the brackets and collect like terms. Example
Convert \(f(x) = 2(x-3)(x-1)\) to standard form.
$$ \begin{aligned}f(x) &=2(x-3)(x-1)\\
&= 2(x^2 - x - 3x + 3) \\
&= 2(x^2 - 4x + 3) \\
&= \boldsymbol{2x^2 - 8x + 6}\end{aligned} $$
Method — Converting from Standard to Factored Form
To convert from standard form to factored form, find the roots of the function by solving \(f(x)=0\). If the roots are \(p\) and \(q\), the factored form is \(f(x)=a(x-p)(x-q)\). The value of \(a\) is the same as in the standard form. Example
Convert \(f(x) = 2x^2 - 8x + 6\) to factored form.
We solve \(2x^2 - 8x + 6 = 0\). First, divide by 2: \(x^2 - 4x + 3 = 0\).
Two numbers with product \(3\) and sum \(-4\) are \(-1\) and \(-3\), so \(x^2 - 4x + 3 = (x - 1)(x - 3)\), and by the null factor law the roots are \(p = 1\) and \(q = 3\).
The factored form is \(\boldsymbol{f(x) = 2(x-1)(x-3)}\).
Two numbers with product \(3\) and sum \(-4\) are \(-1\) and \(-3\), so \(x^2 - 4x + 3 = (x - 1)(x - 3)\), and by the null factor law the roots are \(p = 1\) and \(q = 3\).
The factored form is \(\boldsymbol{f(x) = 2(x-1)(x-3)}\).
Method — Checking a Root and Factorising with a Known Root
Let \(f(x) = ax^2 + bx + c\) be a quadratic function. A root read on a graph, found in a table of values or simply guessed is only a conjecture until it is checked. - Check the root: \(x_1\) is a root of \(f\) when \(f(x_1) = 0\). Substitute and compute.
- Write the factored form with the second root unknown: a quadratic function with a root \(x_1\) can be written \(f(x) = a(x - x_1)(x - x_2)\), with the same \(a\) as in the standard form (accepted without proof; the second root \(x_2\) may be equal to \(x_1\); the Definition above writes the roots \(p\) and \(q\)).
- Find \(x_2\) with the constant term: expanding \(a(x - x_1)(x - x_2)\) gives the constant term \(a x_1 x_2\), which must be equal to \(c\). Solve \(a x_1 x_2 = c\).
- Check by expanding the factored form.
Example
Let \(f(x) = 2x^2 - 2x - 12\). Its graph seems to cross the \(x\)-axis at \(x = 3\). - Check that \(3\) is a root of \(f\).
- Factorise \(f(x)\).
- Give the two roots of \(f\).
- \(\begin{aligned}[t]f(3) &= 2 \times 3^2 - 2 \times 3 - 12 \\ &= 18 - 6 - 12 \\ &= 0\end{aligned}\)
So \(3\) is a root of \(f\). - Since \(3\) is a root and \(a = 2\), \(f(x) = 2(x - 3)(x - x_2)\). The constant term of this product is \(2 \times 3 \times x_2 = 6x_2\), and the constant term of \(f\) is \(-12\): $$\begin{aligned}6x_2 &= -12 \\ x_2 &= -2\end{aligned}$$ So \(f(x) = 2(x - 3)(x + 2)\). Check: $$\begin{aligned}2(x - 3)(x + 2) &= 2(x^2 + 2x - 3x - 6) \\ &= 2(x^2 - x - 6) \\ &= 2x^2 - 2x - 12\end{aligned}$$
- A product is zero when one of its factors is zero: the roots of \(f\) are \(3\) and \(-2\).
Skills to practice
- Converting from Factored Form to Standard Form
- Finding the Second Root from a Known Root
- Checking a Root and Factorising
III.3
Key Features with Technology
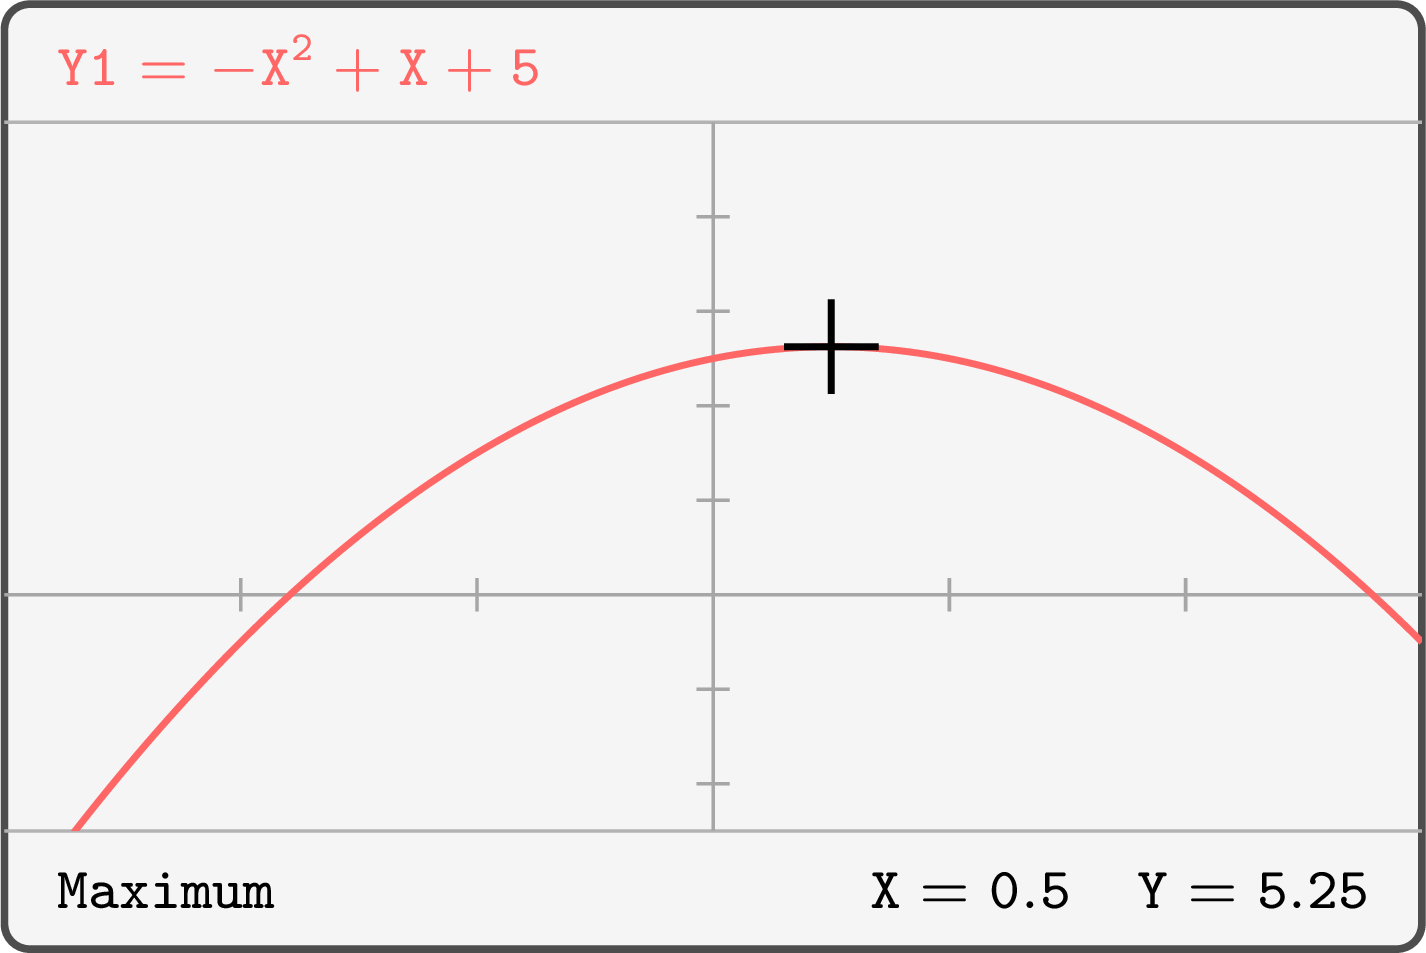
Method — Reading the Key Features of a Graph on the Screen
To study the graph of a function \(f\) with a graphing calculator: - Enter \(f(x)\) as the first function (\(Y_1\)) of the function editor.
- Choose the window: the least and greatest values of \(x\) and of \(y\) shown on the screen. Start from the domain the question gives, or from a table of values of \(f\), and adjust until every feature asked for is visible. A window that is too narrow hides an intercept or a turning point; a window that is too wide flattens the curve.
- Read each feature with the analysis tools of the graph menu, never by eye:
- the \(y\)-intercept: the value of \(f\) at \(x = 0\);
- each \(x\)-intercept: the tool zero (or root);
- a local maximum or minimum: the tool maximum or minimum, which gives both coordinates of the turning point.
Example
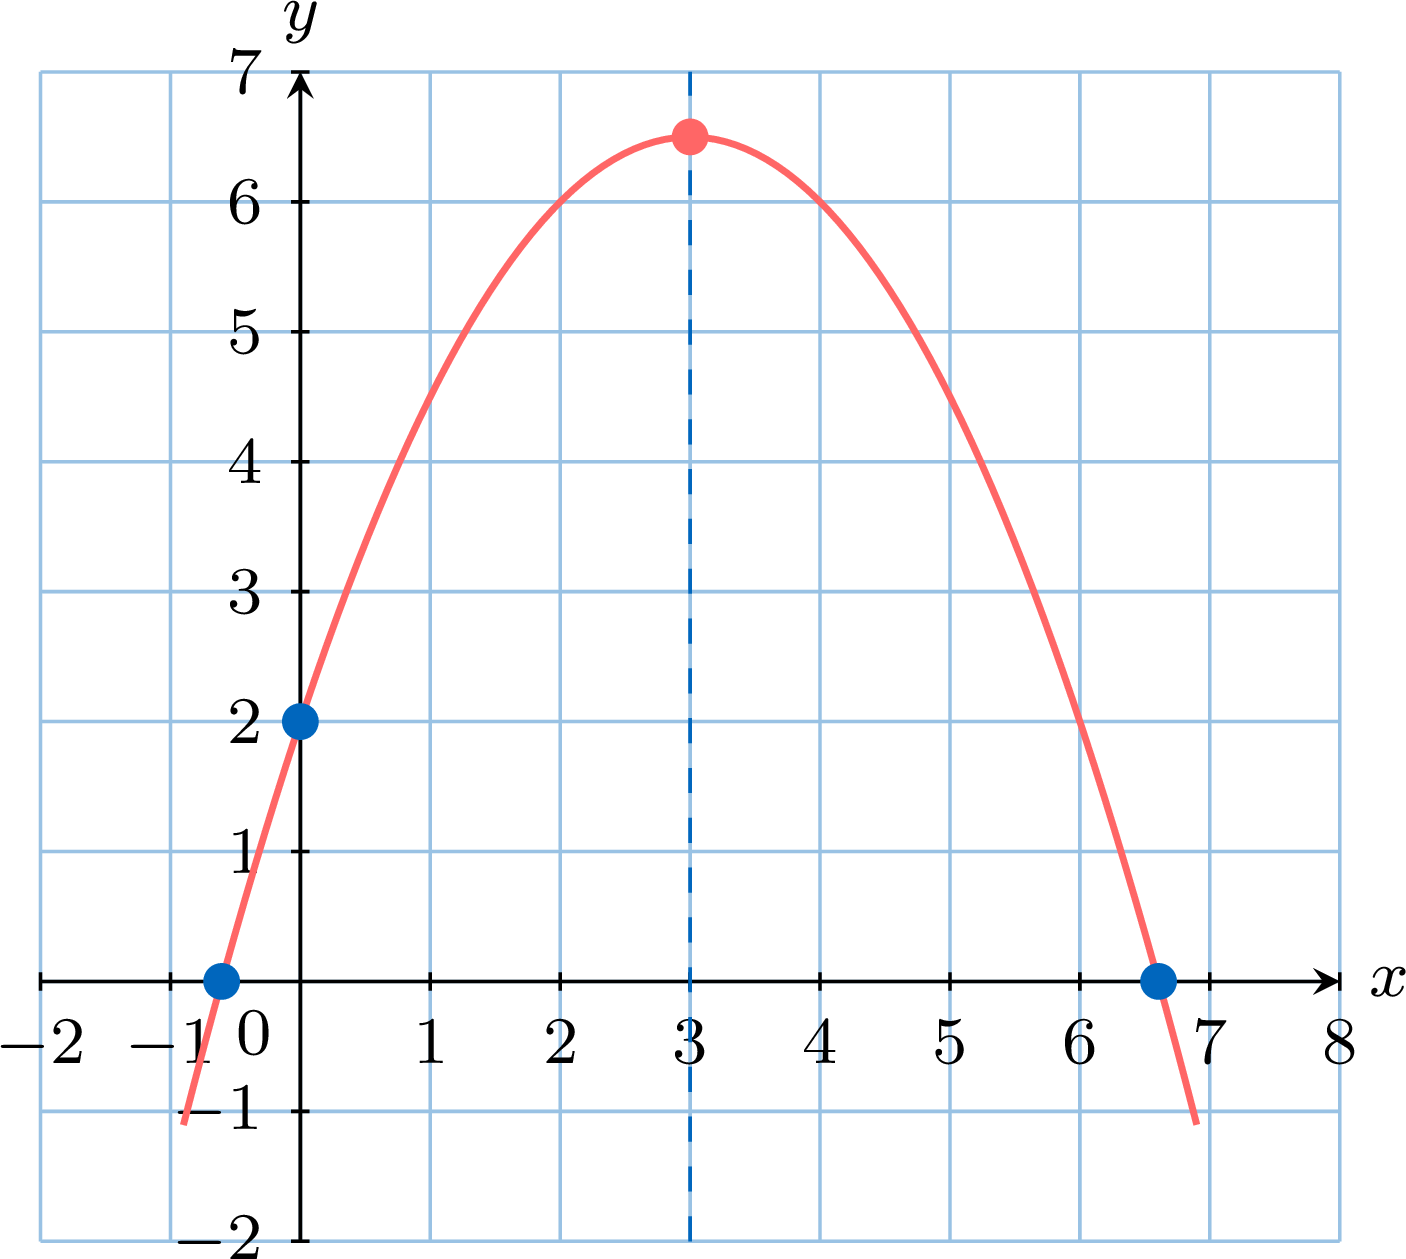
Let \(f(x) = -0.5x^2 + 3x + 2\). - Choose a window that shows the intercepts and the turning point of the graph of \(f\).
- Find the \(y\)-intercept, and the \(x\)-intercepts to 3 significant figures.
- Find the maximum point of the graph.
- Check that the two \(x\)-intercepts are symmetric about the vertical line through the maximum point.
- A table of values of \(f(x) = -0.5x^2 + 3x + 2\) at the integers guides the choice:
\(x\) \(-2\) \(-1\) \(0\) \(1\) \(2\) \(3\) \(4\) \(5\) \(6\) \(7\) \(8\) \(f(x)\) \(-6\) \(-1.5\) \(2\) \(4.5\) \(6\) \(6.5\) \(6\) \(4.5\) \(2\) \(-1.5\) \(-6\) - The \(y\)-intercept is \(f(0) = 2\). The zero tool, bounded between \(-1\) and \(0\), then between \(6\) and \(7\), displays \(X = -0.6055513\) and \(X = 6.6055513\): the \(x\)-intercepts are \(x \approx -0.606\) and \(x \approx 6.61\). A parabola has at most two \(x\)-intercepts, so none is missing.
- The maximum tool, bounded between \(2\) and \(4\), displays \(X = 3\) and \(Y = 6.5\); some models display a value such as \(X = 2.9999996\), because the tool searches the maximum numerically and stops when it is close enough to it. The reading is confirmed exactly by completing the square: $$\begin{aligned}[t] f(x) &= -0.5\left(x^2 - 6x\right) + 2\\ &= -0.5\left((x - 3)^2 - 9\right) + 2 && (x^2 - 6x = (x - 3)^2 - 9)\\ &= -0.5(x - 3)^2 + 6.5. \end{aligned}$$ Since \(-0.5(x - 3)^2 \le 0\), \(f(x) \le 6.5\), with equality only for \(x = 3\): the maximum point is exactly \((3, 6.5)\), as the table, symmetric about \(x = 3\), suggested.
- The two \(x\)-intercepts lie at the same distance from the vertical line \(x = 3\): $$\begin{aligned}[t] 3 - (-0.6055513) &= 3.6055513, \\ 6.6055513 - 3 &= 3.6055513. \end{aligned}$$ The readings are consistent with the symmetry of the parabola about the line \(x = 3\).
Key Features of a Parabola on the Screen
For a quadratic function \(f(x) = ax^2 + bx + c\), with \(a \neq 0\), the three steps of the method give every key feature: a parabola has no asymptote. The graph of such a function has exactly one \(y\)-intercept, \(f(0) = c\), at most two \(x\)-intercepts, and exactly one turning point, the vertex: a maximum point when \(a < 0\), a minimum point when \(a > 0\). The vertical line through the vertex is an axis of symmetry of the parabola, so the two \(x\)-intercepts, when there are two, lie at the same distance from it. Compared with their full displayed values, the two distances are equal, up to the rounding of the screen; two readings that are clearly not symmetric about this line reveal a reading error.
Skills to practice
- Reading the Key Features of a Parabola
IV
Going further
Skills to practice
- Solving Projectile Problems
- Investigating the Graphs of \(y \equal a(x-h)^2+k\)
- Quiz
Jump to section