International Baccalaureate · MYP 5
Functions
I
Functions and Function Notation
Definition — Relation
A relation describes how two variables (quantities) are connected.
A Relation as a Set of Ordered Pairs
A relation can also be written as a set of ordered pairs \((x, y)\): each pair links a value \(x\) of the first variable with a value \(y\) of the second variable that it is connected to.
- The table
\(x\) \(1\) \(2\) \(3\) \(4\) \(y\) \(3\) \(5\) \(7\) \(9\) - The relation “is a factor of”, from the numbers \(2\) and \(3\) to the numbers \(4\), \(6\) and \(9\), is the set \(\{(2, 4), (2, 6), (3, 6), (3, 9)\}\). Here the same first value \(2\) appears in two pairs: a relation may connect one value with several values.
A function is like a machine that follows a specific rule. Each number put in gives exactly one number out.
Consider a machine whose rule is “multiply by 2”. 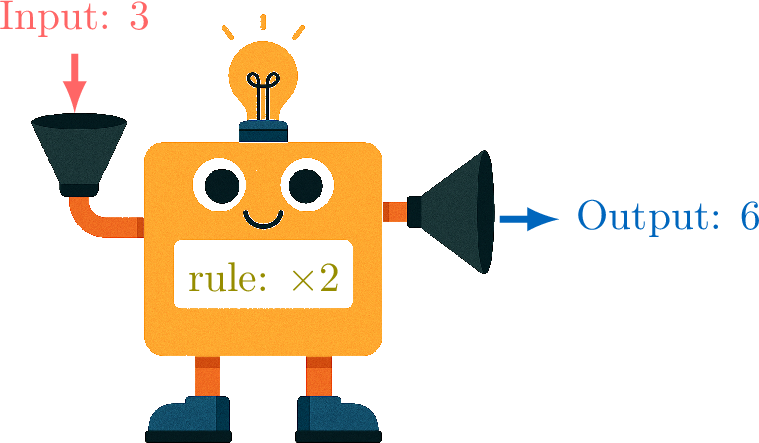
If we put in a 3, we get out a 6. If we put in a 5, we get out a 10. A table of values helps us organise these pairs:
To work with these rules more efficiently, mathematicians developed a special notation.
To represent this machine, we write \(\textcolor{olive}{f}(\textcolor{colordef}{\text{input}}) = \textcolor{colorprop}{\text{output}}\). The brackets \((\) \()\) (also called parentheses) indicate the action of the function \(\textcolor{olive}{f}\) on the input.
We use function notation to name functions and their variables, replacing “\(\textcolor{colordef}{\text{input}}\)” by “\(\textcolor{colordef}{x}\)” and “\(\textcolor{colorprop}{\text{output}}\)” by “\(\textcolor{colorprop}{f(x)}\)”.
For example, if the rule is “twice the input”: 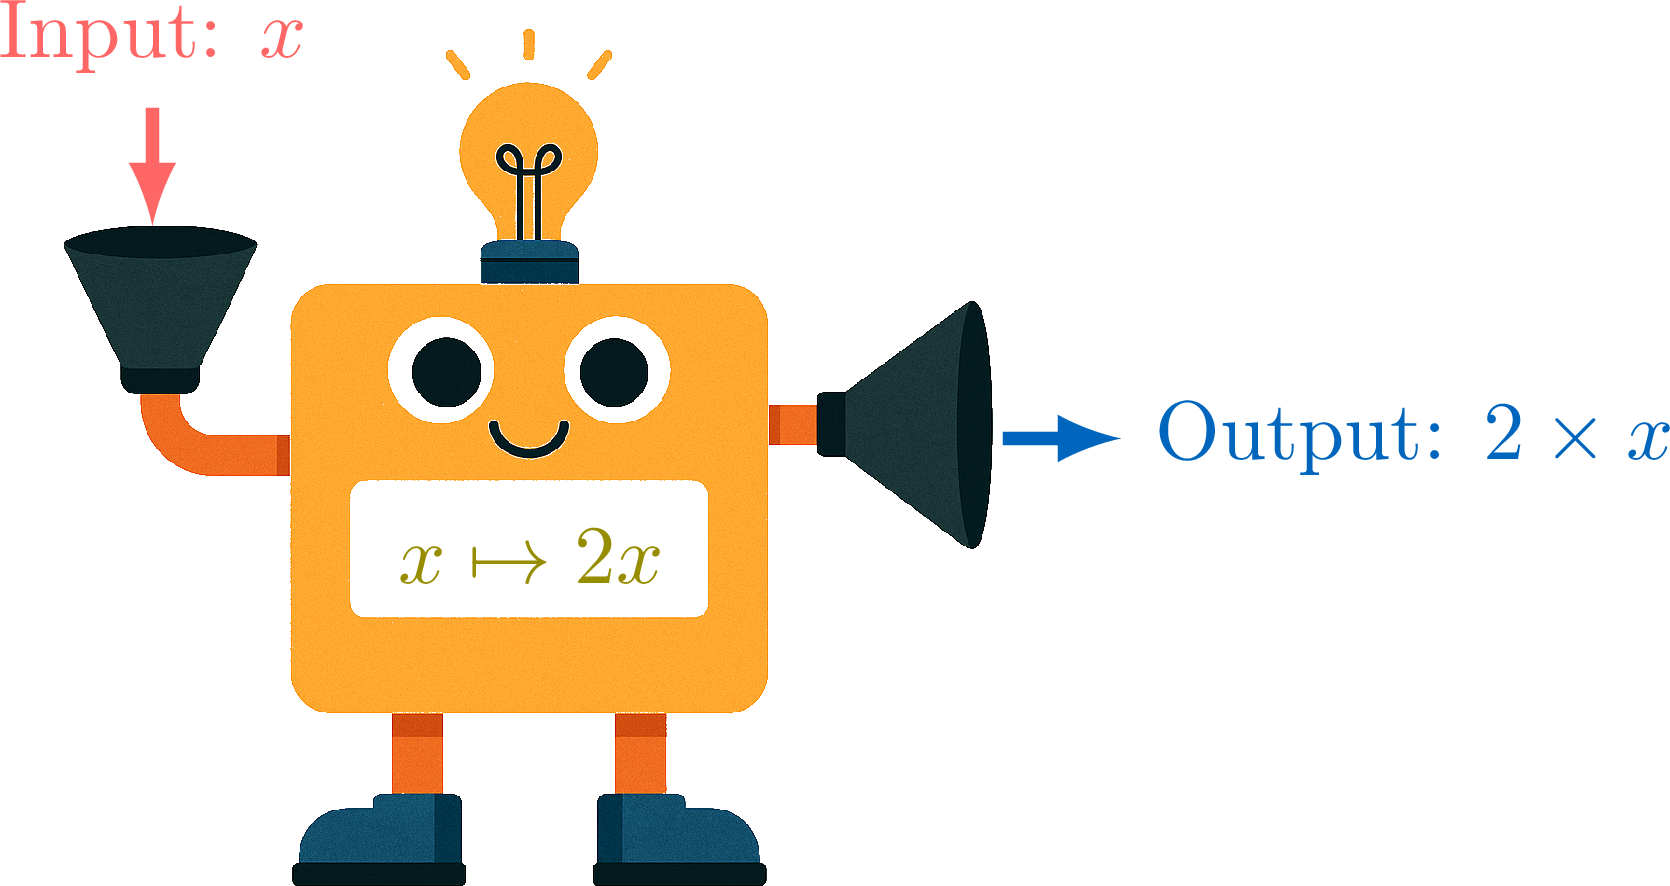
we have \(\textcolor{olive}{f}(\textcolor{colordef}{x}) = \textcolor{colorprop}{2x}\). 
When the input is \(\textcolor{colordef}{x} = \textcolor{colordef}{1}\), we get: $$\begin{aligned} \textcolor{olive}{f}(\textcolor{colordef}{1}) &= 2 \times \textcolor{colordef}{(1)}\\
&= \textcolor{colorprop}{2} \end{aligned}$$
Consider a machine whose rule is “multiply by 2”.
| Input | 3 | 5 | 8 | 10 |
| Output | 6 | 10 | 16 | 20 |
To represent this machine, we write \(\textcolor{olive}{f}(\textcolor{colordef}{\text{input}}) = \textcolor{colorprop}{\text{output}}\). The brackets \((\) \()\) (also called parentheses) indicate the action of the function \(\textcolor{olive}{f}\) on the input.
We use function notation to name functions and their variables, replacing “\(\textcolor{colordef}{\text{input}}\)” by “\(\textcolor{colordef}{x}\)” and “\(\textcolor{colorprop}{\text{output}}\)” by “\(\textcolor{colorprop}{f(x)}\)”.
For example, if the rule is “twice the input”:
Definition — Function
A function, \(f\), is a rule that assigns to each input value exactly one output value. - \(f\) is the name of the function (the rule).
- \(x\) is the input variable.
- \(f(x)\) is the output value when the input is \(x\). It is read as “\(f\) of \(x\)”.
- \(f(x)\) is called the image of \(x\) under \(f\), and \(x\) is called an antecedent (also called a preimage) of \(f(x)\).

Example
The function \(f\) is defined by the rule \(f(x)=2x-1\). Find the value of \(f(5)\).
To find \(f(5)\), we substitute the input value \(x=5\) into the function's rule: $$ \begin{aligned}[t] f(x) &= 2x - 1 \\
f(5) &= 2(5) - 1 \\
&= 10 - 1 \\
&= \boldsymbol{9} \end{aligned} $$
Example
Consider the following calculation program: - Choose a number.
- Multiply the chosen number by \(3\).
- Add \(1\) to the result.
Run the program on the chosen number \(x\), step by step: $$\textcolor{colordef}{x} \;\xrightarrow{\;\times\, 3\;}\; 3 \times \textcolor{colordef}{x} \;\xrightarrow{\;+\, 1\;}\; 3 \times \textcolor{colordef}{x} + 1.$$ The result is always \(3 \times x + 1\), so the function is $$\textcolor{colorprop}{f(x) = 3x + 1}.$$ Check with a number: for \(x = 2\), the program gives \(2 \to 6 \to 7\), and \(f(2) = 3 \times 2 + 1 = 7\). 
Skills to practice
- Deciding Whether a Set of Ordered Pairs Is a Function
- Calculating Images
- Evaluating a Function at an Expression
II
Tables of Values
Definition — Table of Values
A table of values is a table that organises the relationship between the input values (\(x\)) and their corresponding output values (\(f(x)\)) for a function. Example
Complete the table of values for the function \(f(x)=x^2\). | \(x\) | \(-2\) | \(-1\) | \(0\) | \(1\) | \(2\) |
| \(f(x)\) |
We substitute each value of \(x\) into the function \(f(x)=x^2\):
- \(\begin{aligned}[t] f(-2) &= (-2)^2 \\ &= 4 \end{aligned}\)
- \(\begin{aligned}[t] f(-1) &= (-1)^2\\ &= 1 \end{aligned}\)
- \(\begin{aligned}[t] f(0) &= (0)^2 \\ &= 0 \end{aligned}\)
- \(\begin{aligned}[t] f(1) &= (1)^2 \\ &= 1 \end{aligned}\)
- \(\begin{aligned}[t] f(2) &= (2)^2 \\ &= 4 \end{aligned}\)
| \(x\) | \(-2\) | \(-1\) | \(0\) | \(1\) | \(2\) |
| \(f(x)\) | \(4\) | \(1\) | \(0\) | \(1\) | \(4\) |
Skills to practice
- Using Tables of Values
III
Graphs of Functions
While a table of values is useful for listing some input–output pairs of a function, a graph is a powerful tool for visualising how the output changes when the input changes. A graph gives us a picture of the function's behaviour.
Definition — Graph of a Function
The graph of a function \(f\) is the set of all points with coordinates \((\textcolor{colordef}{x}, \textcolor{colorprop}{f(x)})\) in a coordinate plane. The input value, \(x\), is plotted on the horizontal axis (the x-axis), and the output value, \(f(x)\), is plotted on the vertical axis (the y-axis). When the function is defined for all \(x\) in an interval, we can connect these points to form the curve of the function. 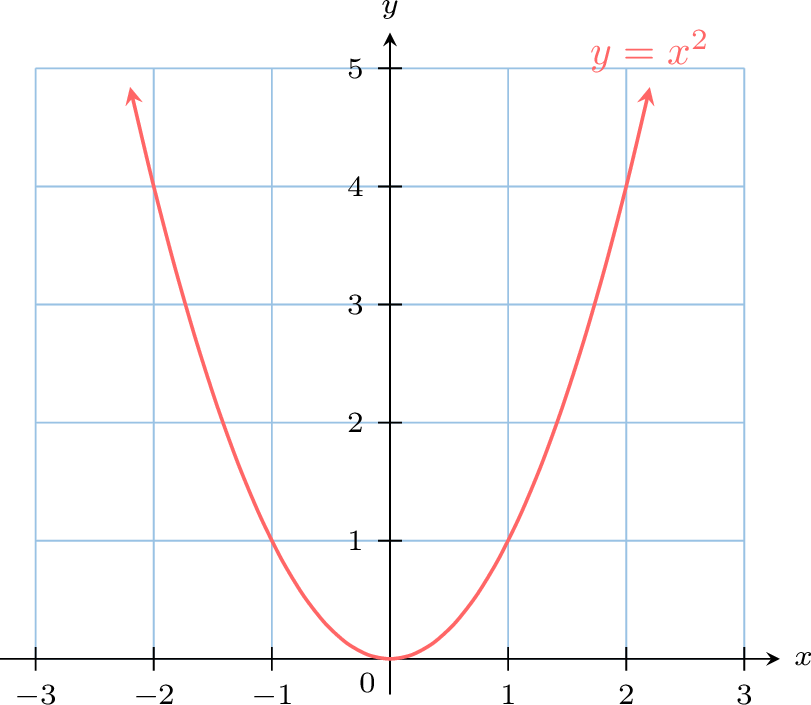
Proposition — Vertical Line Test
A drawing in the plane is the graph of a function exactly when every vertical line crosses it at most once. Indeed, the points of a vertical line all share the same input \(x\) — so two crossings would give one input two different outputs, which a function never does. 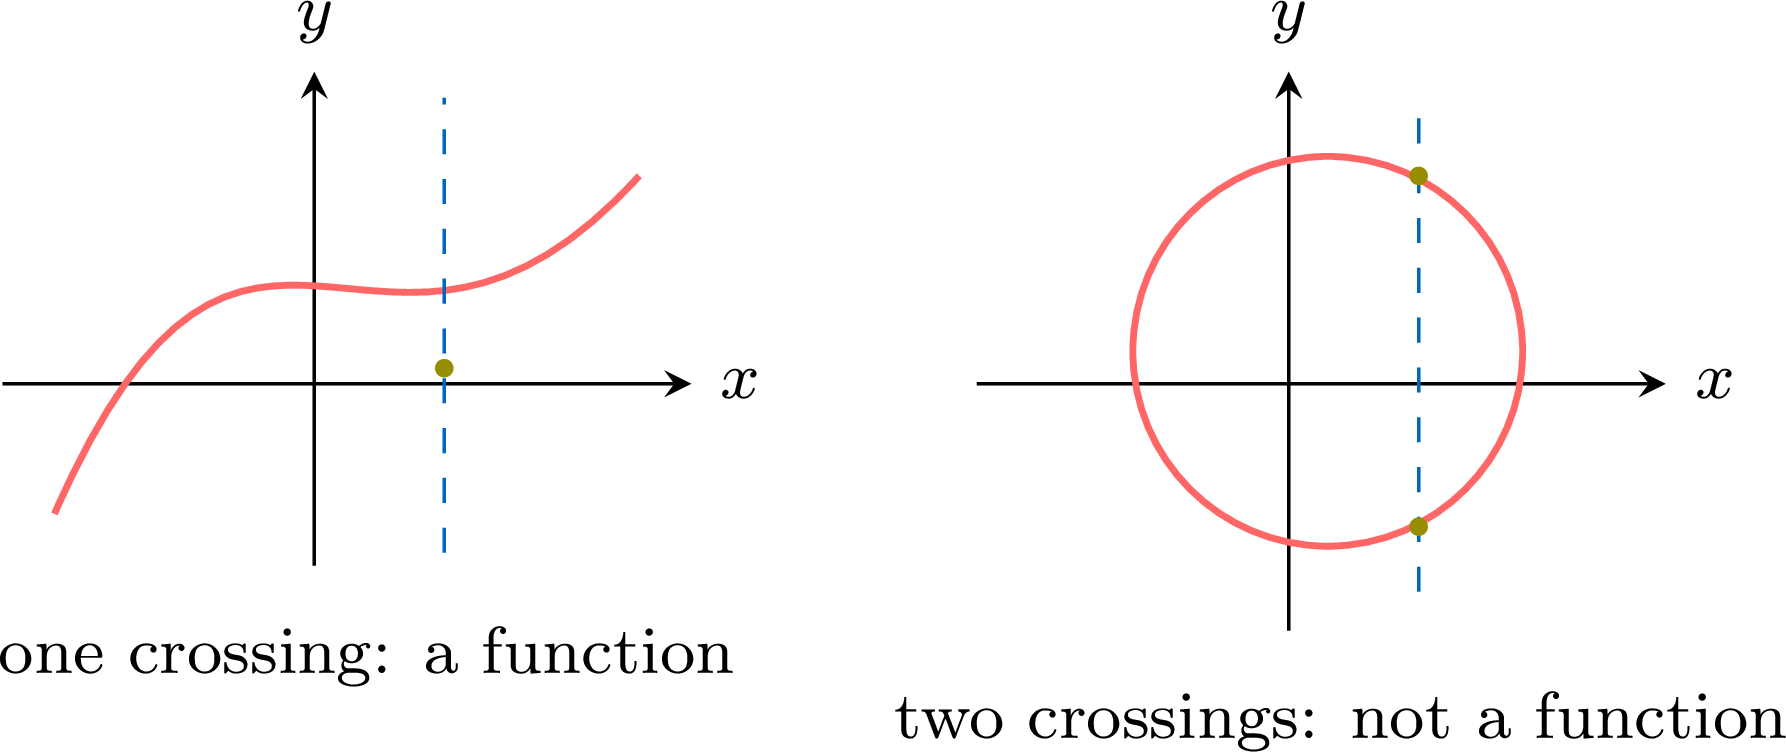
Method — Plotting a Graph from a Table
To plot the graph of a function from its table of values: - Draw a coordinate plane with a suitable scale on each axis and label the axes.
- For each pair \((x, f(x))\) in the table, plot the corresponding point on the coordinate plane.
- If the function is defined for all \(x\) in the interval shown, connect the points with a straight line or a smooth curve.
Example
Plot the graph of the function \(f(x) = x - 1\) using its table of values. | \(x\) | \(-2\) | \(-1\) | \(0\) | \(1\) | \(2\) | \(3\) |
| \(f(x)\) | \(-3\) | \(-2\) | \(-1\) | \(0\) | \(1\) | \(2\) |
We plot the points \((-2, -3)\), \((-1, -2)\), \((0, -1)\), \((1, 0)\), \((2, 1)\), and \((3, 2)\) from the table. These points lie on the same straight line, so we connect them to draw the graph of \(f(x)=x-1\). 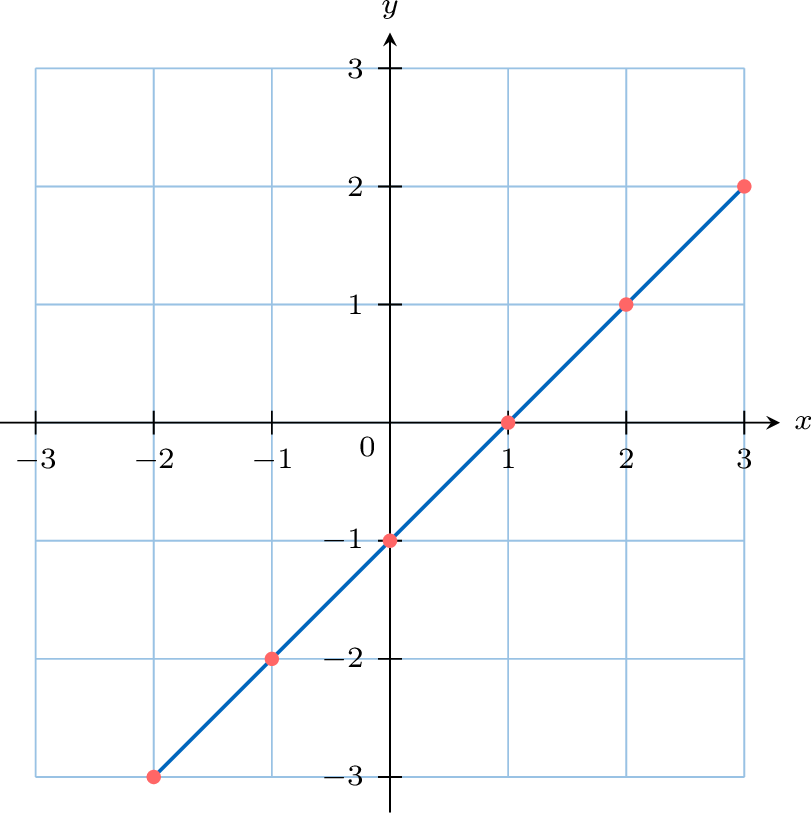
Method — Finding the Value of \(f(x)\) from a Graph
To find the output \(f(x)\) for a given input \(x\) using a graph: - Locate the input value on the horizontal x-axis.
- Move vertically from that point to the curve of the function.
- Move horizontally from the intersection point to the vertical y-axis and read the corresponding value. This y-value is the output \(f(x)\).
Example
Using the graph of the function \(f\) below, find the value of \(f(2)\). 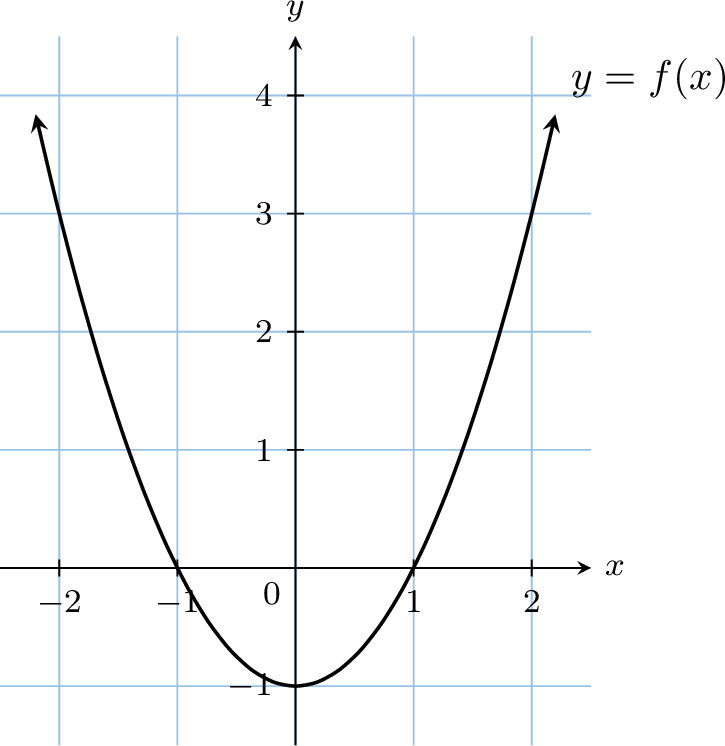
We follow the graphical method: 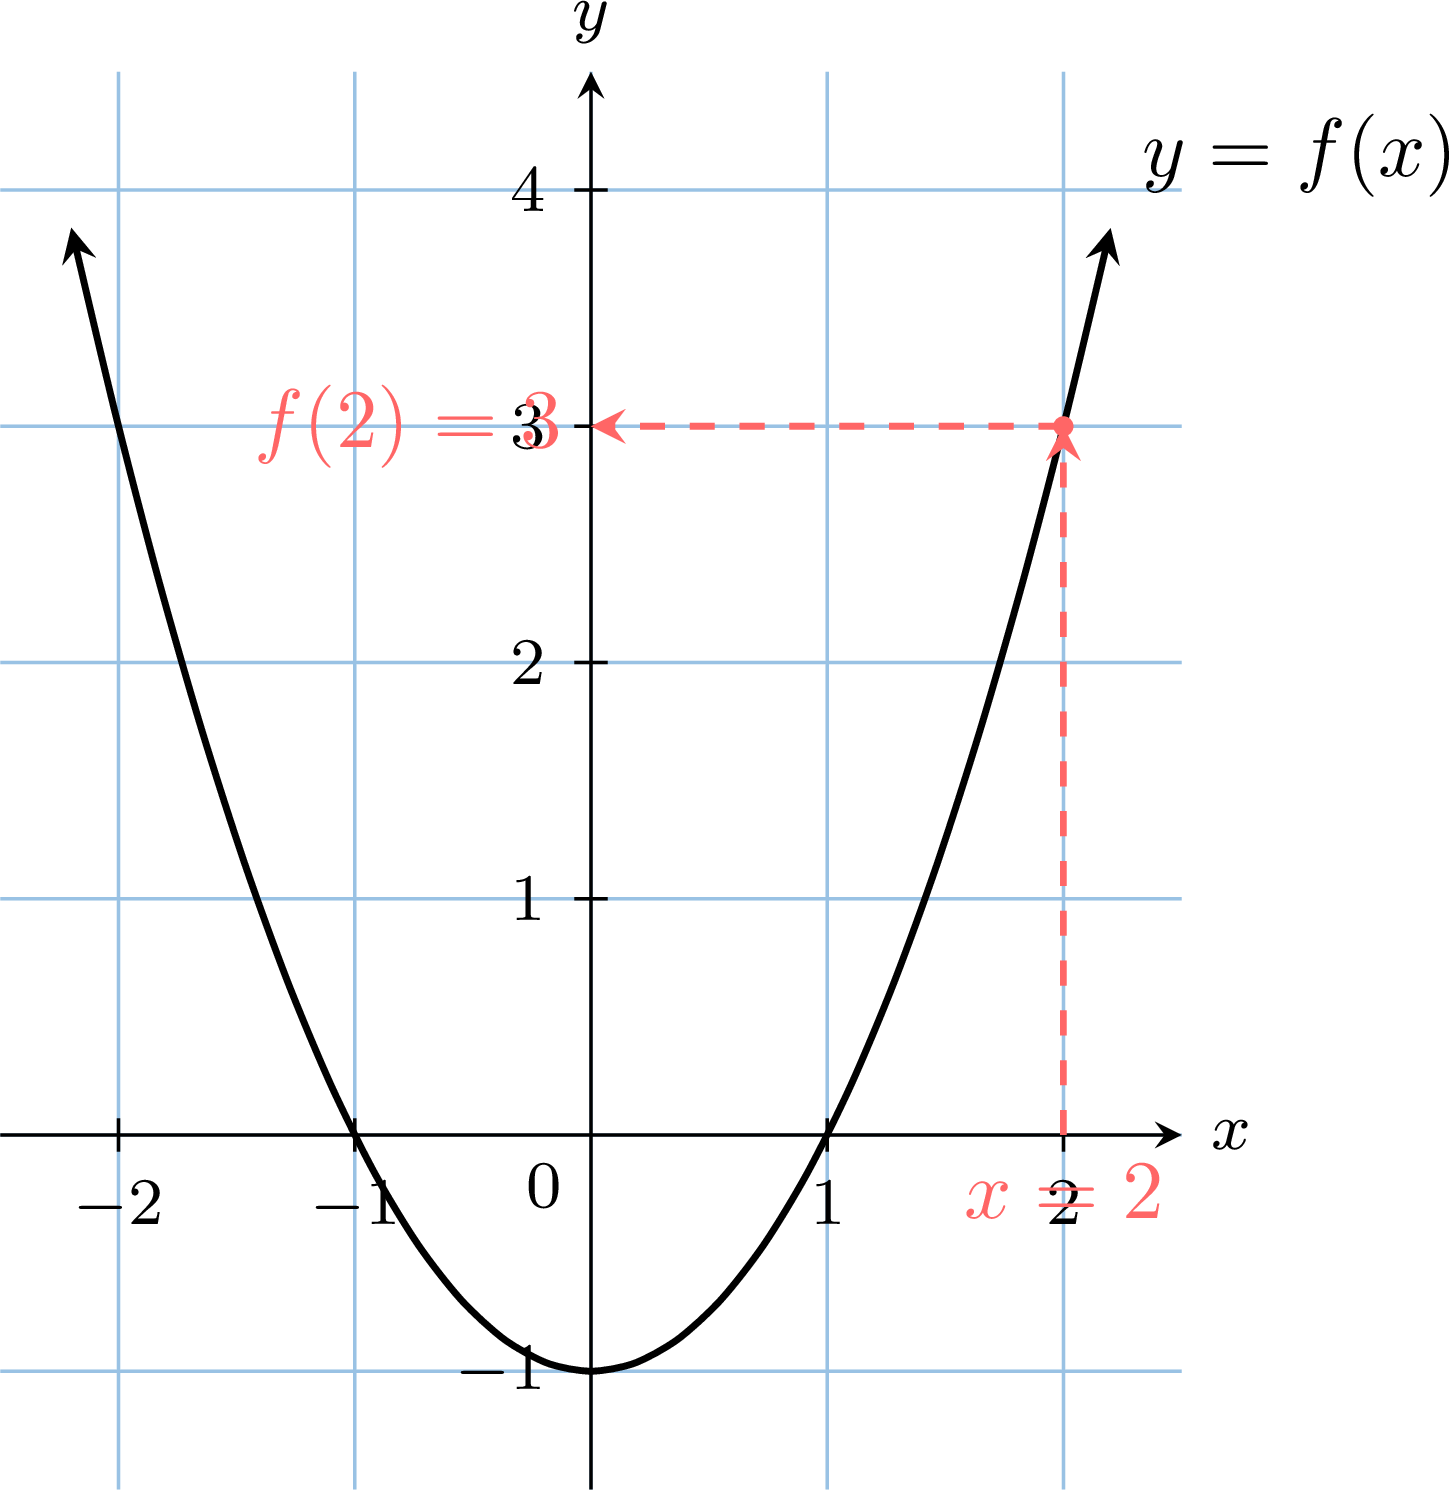
Therefore, \(\boldsymbol{f(2) = 3}\).
- Start at \(x=2\) on the horizontal axis.
- Move up to meet the curve.
- Move horizontally to the vertical axis and read the value, which is \(3\).
Skills to practice
- Reading Images on a Graph
- Deciding Whether a Relation Is a Function
- Plotting Graphs
IV
Finding Inputs from Outputs
Taking an input (\(x\)) gives its output (\(f(x)\)). Here we work backwards: if the output is known, can the input(s) that produced it be found? This process is called finding the preimage(s), or antecedent(s), of a given value.
Method — Finding Inputs from Outputs on a Graph
To find the preimage(s) of a value \(y\) (i.e., find all \(x\) such that \(f(x)=y\)): - Locate the output value \(y\) on the vertical y-axis.
- Draw a horizontal line from this value across the graph.
- Find the intersection point(s) where the horizontal line crosses the function's curve.
- Move vertically to the x-axis from each intersection point to read the corresponding input value(s). These are the preimages.
Example
Using the graph of the function \(f\) below, find all values of \(x\) such that \(f(x)= 3\).
We apply the graphical method: 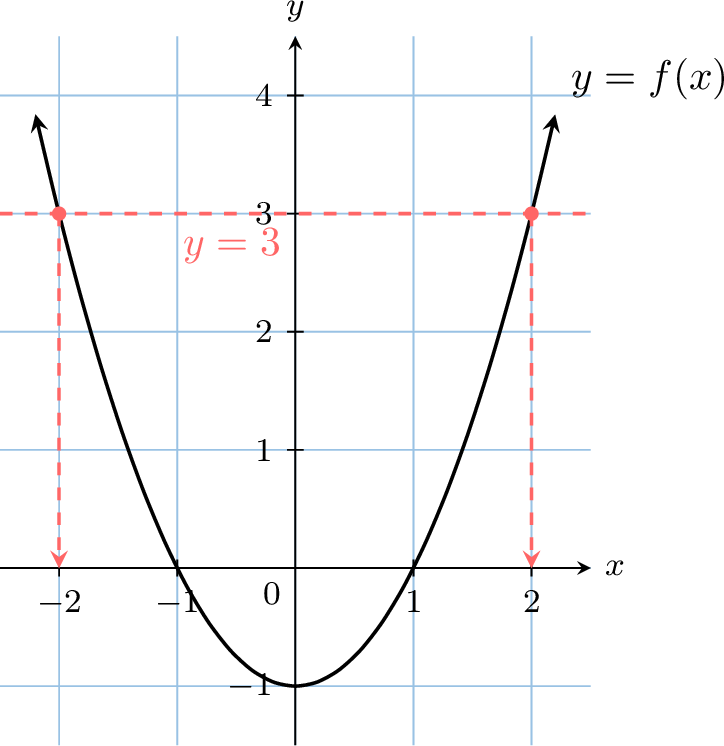
The preimages of \(3\) are \(\boldsymbol{-2}\) and \(\boldsymbol{2}\).
- We locate \(y=3\) on the vertical axis.
- We draw a horizontal line at \(y=3\).
- The line intersects the curve at two points.
- We move vertically from these points to the x-axis to read the values, which are \(-2\) and \(2\).
Method — Finding Inputs from Outputs Algebraically
To find the preimage(s) of a value \(y\) for a function \(f(x)\): - Set the function's formula equal to the output value: \(\boldsymbol{f(x) = y}\).
- Solve the resulting equation for \(x\).
Example
Let \(f(x) = 3x + 12\). Find all values of \(x\) such that \(f(x)=0\).
We need to find the value of \(x\) such that \(f(x)=0\). We set up the equation and solve: $$\begin{aligned} f(x) &= 0 \\
3x + 12 &= 0 \\
3x &= -12 && \color{gray}\text{(subtract 12 from both sides)} \\
x &= \frac{-12}{3} &&\color{gray}\text{(divide both sides by 3)} \\
x &= -4 \end{aligned}$$ The preimage of \(0\) is \(\boldsymbol{x = -4}\).
Check: \(f(-4) = 3(-4) + 12 = -12 + 12 = 0\). The answer is correct.
Check: \(f(-4) = 3(-4) + 12 = -12 + 12 = 0\). The answer is correct.
Skills to practice
- Finding Inputs on a Graph
- Finding Inputs Algebraically
- Finding Inputs of Various Functions
V
Domain and Range
Definition — Domain and Range
- The domain of a function is the set of all input values \(x\) for which the expression \(f(x)\) is defined (i.e., for which the rule of the function gives a real output).
- The range of a function is the set of all output values \(f(x)\) actually obtained when \(x\) runs through the domain.
When a function is given with its domain (for example “\(f\) defined on \([0, 5]\)”), that set is its domain; when only the expression \(f(x)\) is given, the domain is the set of all real numbers \(x\) for which \(f(x)\) is defined.
Method — Finding the Domain
To find the domain of a function (over the real numbers), we identify any values of \(x\) for which the expression \(f(x)\) would not make sense and exclude them. Two main restrictions are looked for: - Division by zero: The denominator of a fraction cannot be zero.
- Square roots of negative numbers: For a real square root, the expression inside the root (the radicand) must be greater than or equal to zero.
Example
Find the domain of the function \(f(x)=\dfrac{1}{x-2}\).
The function is undefined when the denominator is zero. We set the denominator equal to zero and solve for \(x\): $$x-2 = 0 \implies x=2.$$ So \(x=2\) is not allowed.
The function is defined for all real numbers except \(x=2\), that is, for all \(x\) in the set \(\{x \mid x \neq 2\}\).
The function is defined for all real numbers except \(x=2\), that is, for all \(x\) in the set \(\{x \mid x \neq 2\}\).
Skills to practice
- Recognising the Domain of a Function
- Finding the Domain and the Range
VI
Reading the Sign on a Curve
Definition — Sign of a Function
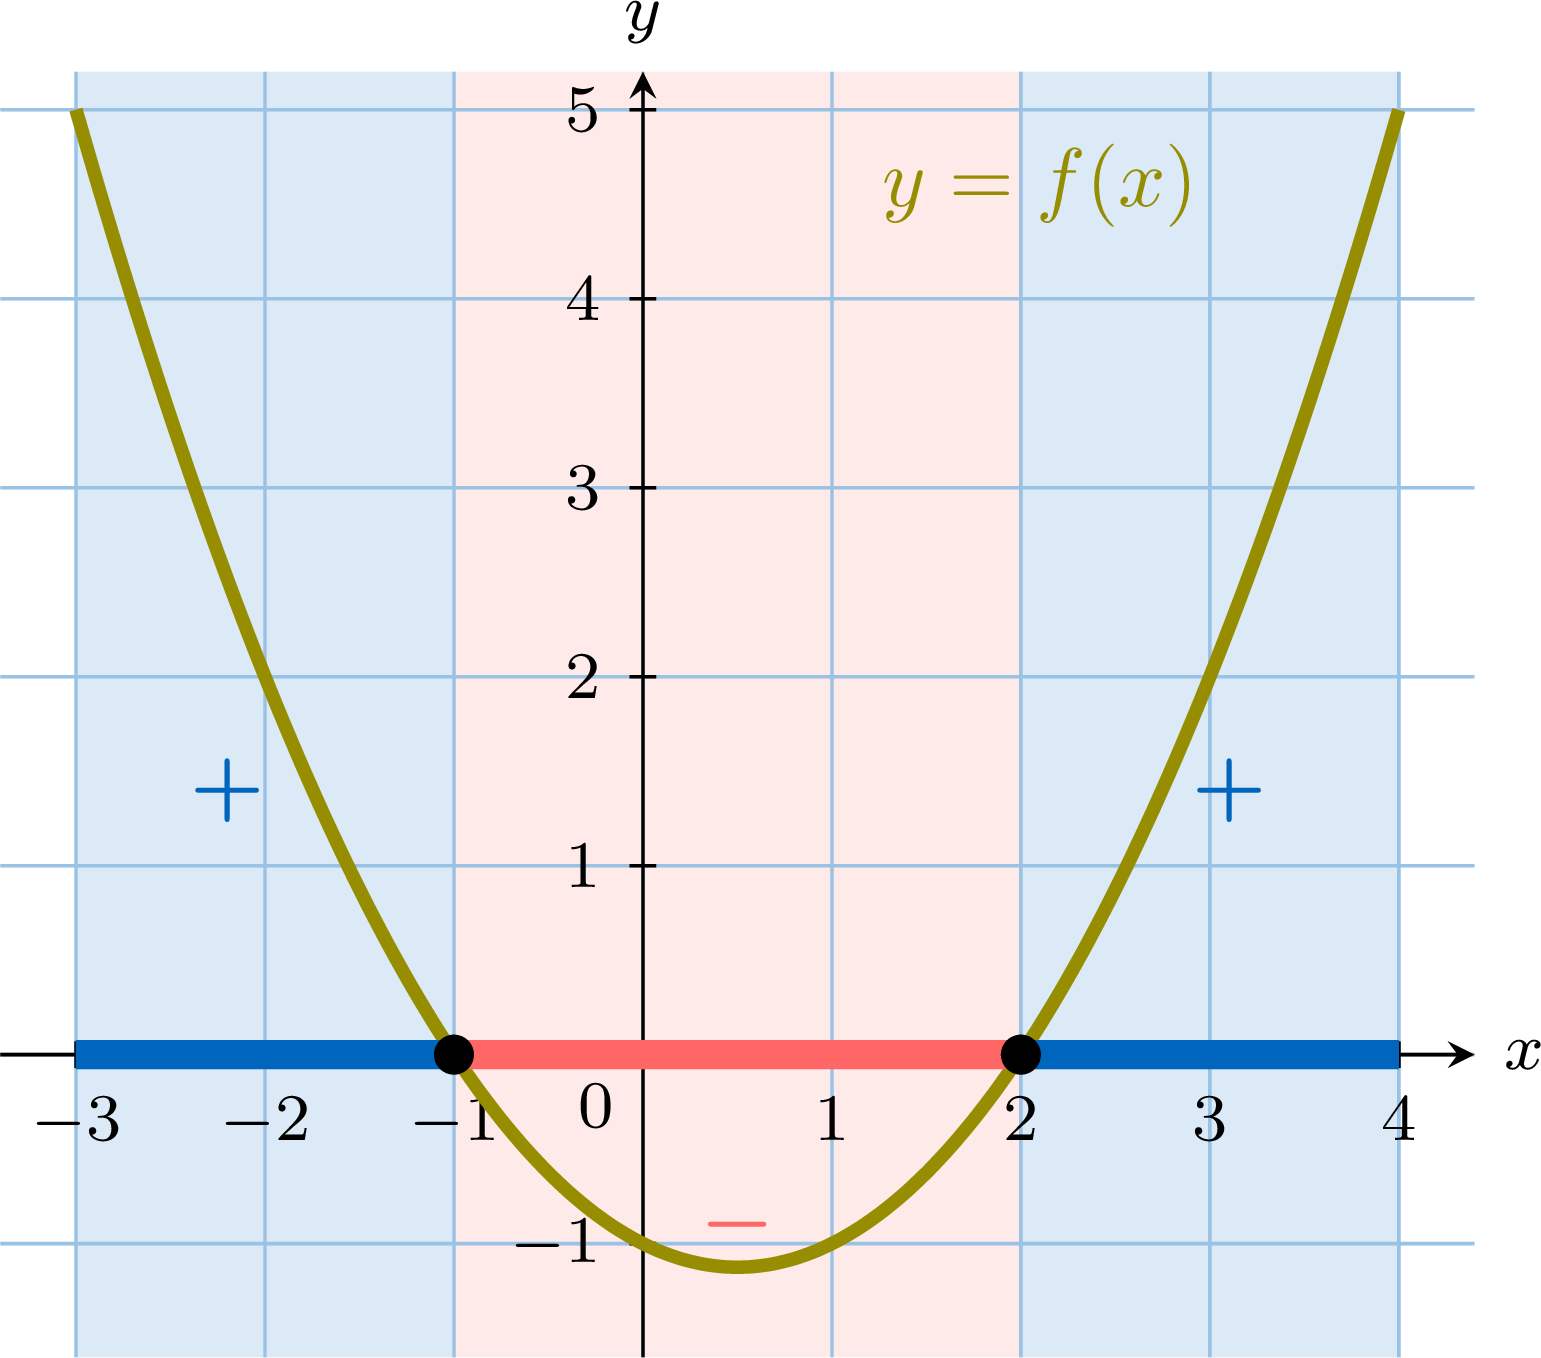
Let \(f\) be a function defined on a set \(D\) and \(I\) an interval contained in \(D\). - \(f\) is non-negative on \(I\) if \(f(x) \geq 0\) for every \(x\) in \(I\): the curve is on or above the \(x\)-axis.
- \(f\) is non-positive on \(I\) if \(f(x) \leq 0\) for every \(x\) in \(I\): the curve is on or below the \(x\)-axis.
Method — Reading the Sign of a Function from its Curve
- Mark the points where the curve meets the \(x\)-axis: at these values, \(f\) vanishes (\(f(x) = 0\)).
- Where the curve is above the axis, \(f(x) \gt 0\); where it is below, \(f(x) \lt 0\).
- Summarise in a sign table: the values where \(f\) vanishes in the top row, the symbols \(+\), \(0\) and \(-\) in the bottom row.
Example
The function \(f\) of the definition above is drawn on \([-3, 4]\), and vanishes at \(-1\) and \(2\). Construct the sign table of \(f\).
The curve is above the axis before \(-1\), below between \(-1\) and \(2\), above after \(2\): 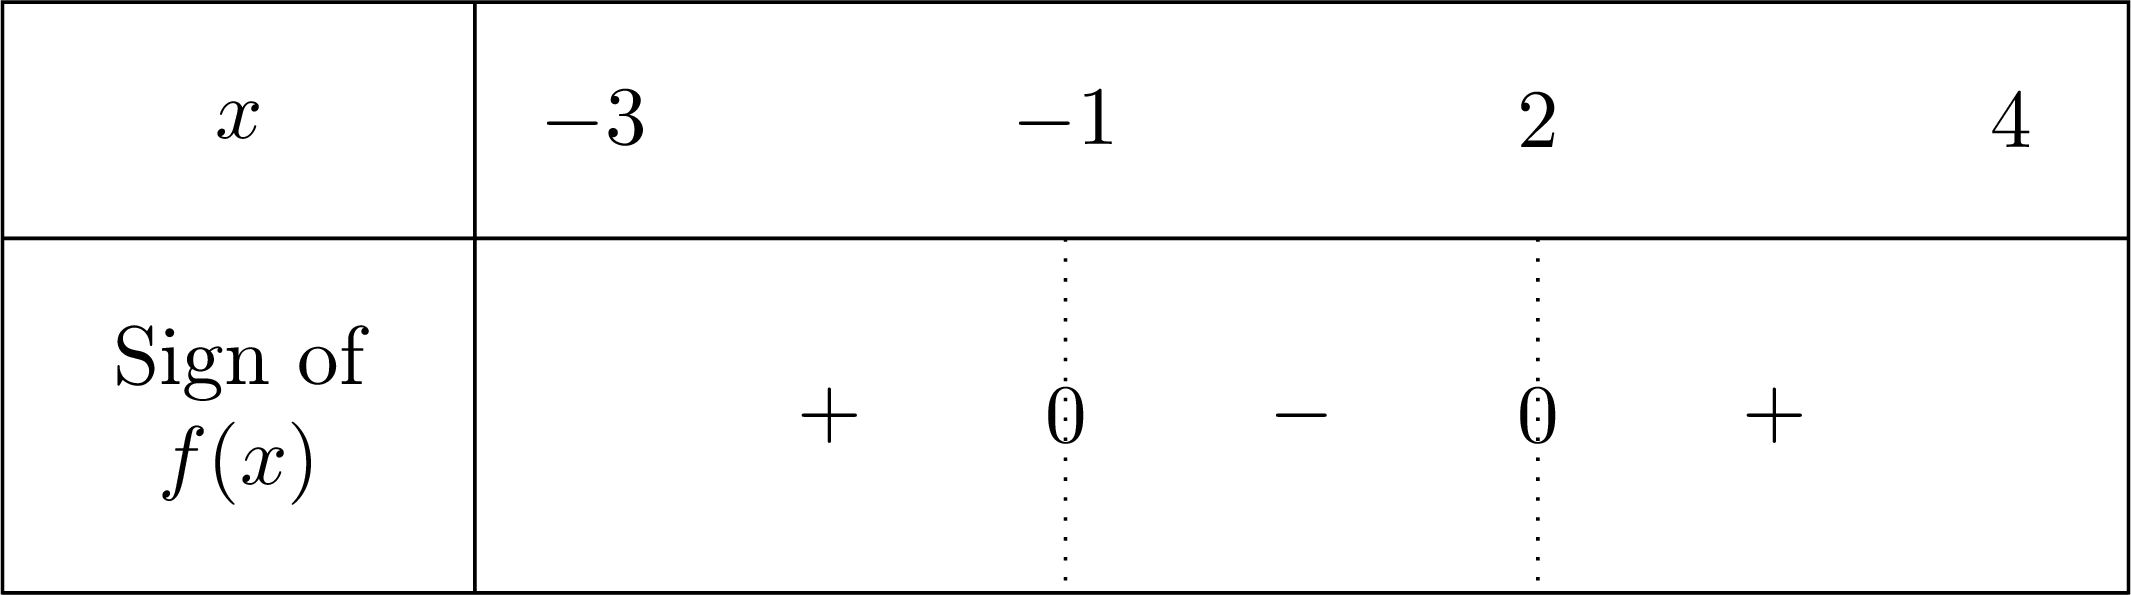
Skills to practice
- Reading the Sign of a Function on a Curve
- Building a Sign Table from a Curve
VII
The Sign of an Affine Expression
Proposition — Sign of an Affine Expression
Let \(a\) and \(b\) be real numbers with \(a \neq 0\). The expression \(ax + b\) vanishes at \(x_0 = -\dfrac{b}{a}\); it has the sign of \(a\) for \(x \gt -\dfrac{b}{a}\), and the opposite sign for \(x \lt -\dfrac{b}{a}\). 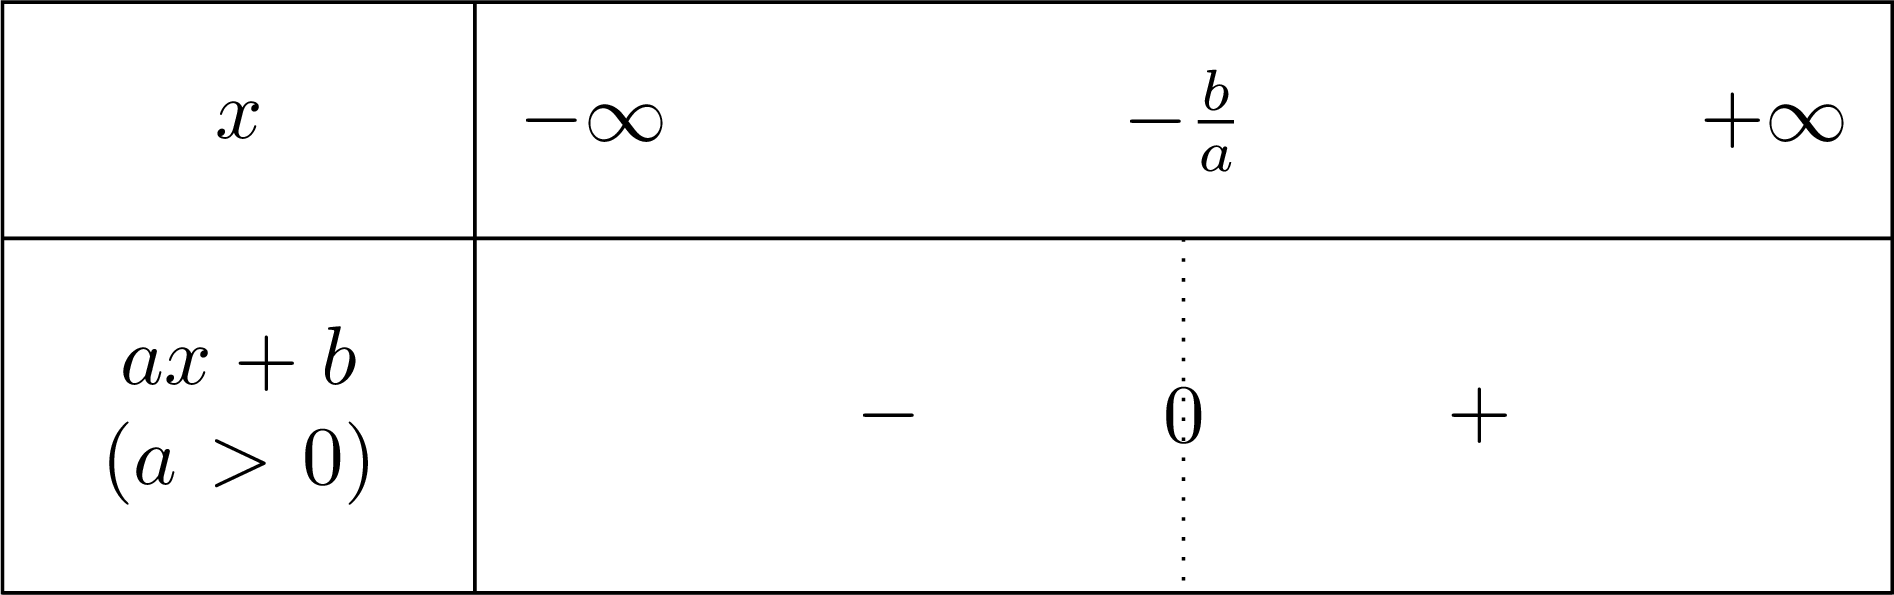
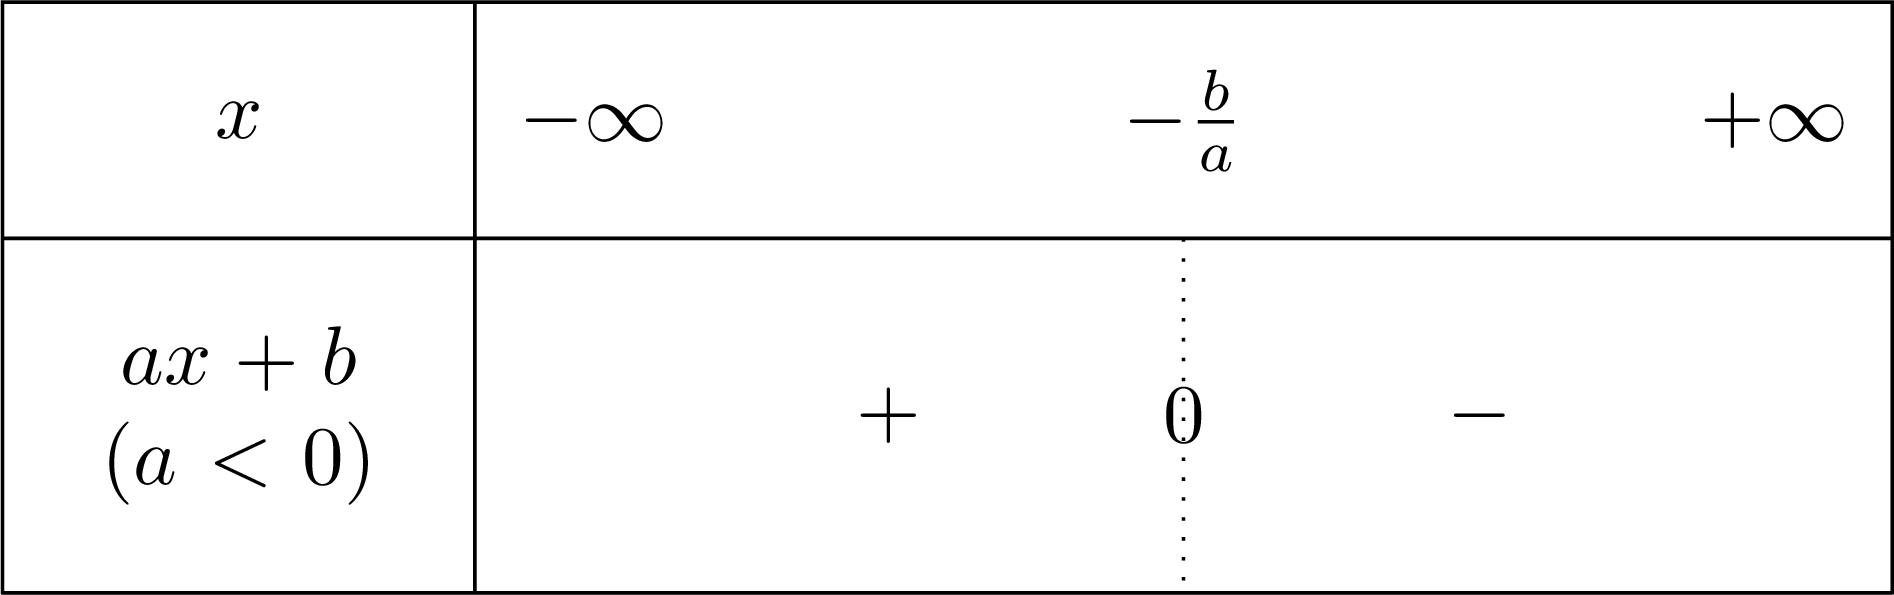
We solve \(ax + b \gt 0\), that is \(ax \gt -b\).
- If \(a \gt 0\), dividing by \(a\) keeps the direction: \(x \gt -\dfrac{b}{a}\). So \(ax+b\) is strictly positive exactly for \(x \gt -\dfrac{b}{a}\) — the sign of \(a\).
- If \(a \lt 0\), dividing by \(a\) reverses the direction: \(x \lt -\dfrac{b}{a}\). So \(ax+b\) is strictly positive exactly for \(x \lt -\dfrac{b}{a}\) — again on one side of \(x_0\), with the sign of \(a\) on the other side.
Example
Construct the sign table of \(3 - 2x\) on \(\R\).
Here \(a = -2\) and \(b = 3\): the expression vanishes at \(x_0 = -\dfrac{3}{-2} = \dfrac{3}{2}\). Since \(a = -2 \lt 0\), the expression is positive before \(\dfrac{3}{2}\) and negative after: 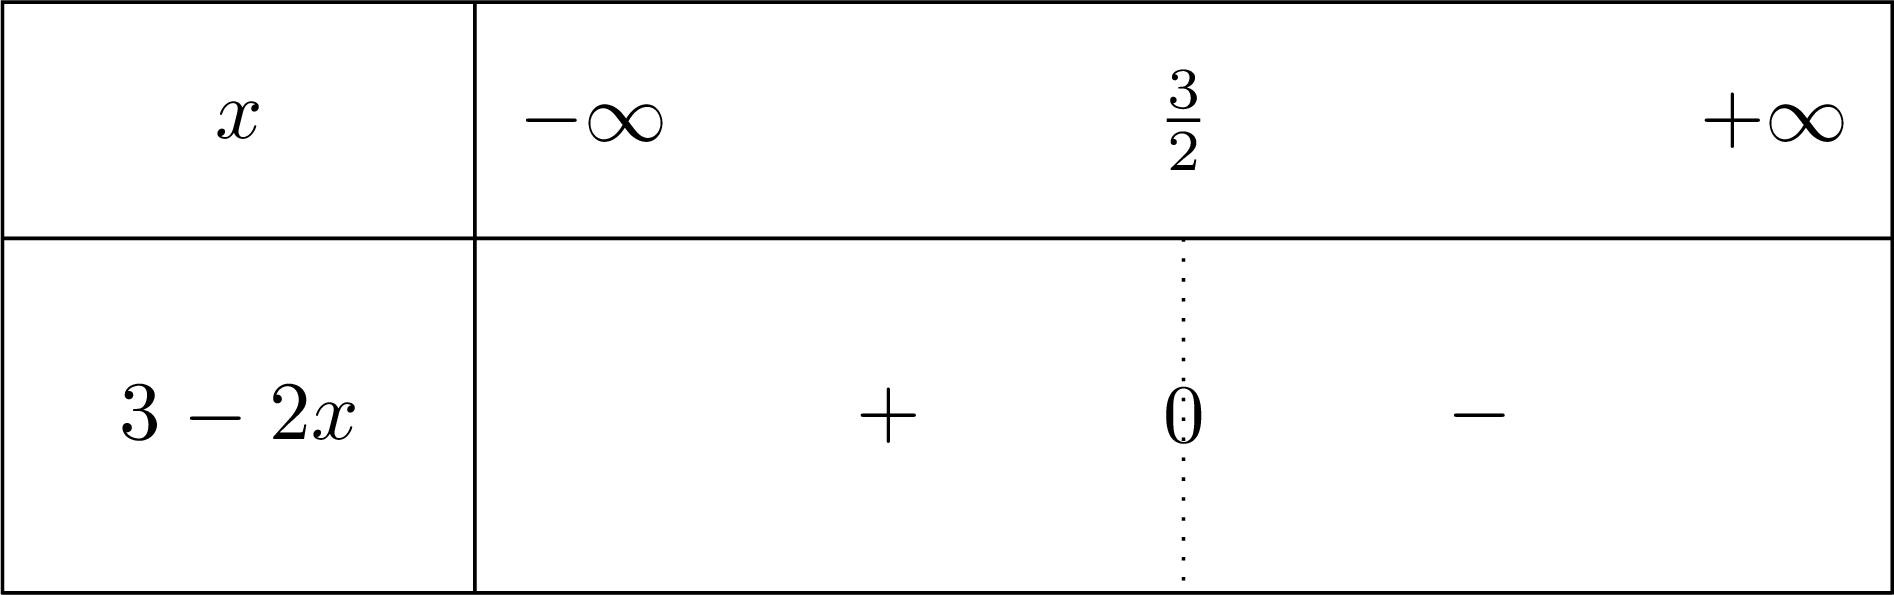
Check: \(3 - 2 \times 0 = 3 \gt 0\) and \(3 - 2 \times 2 = -1 \lt 0\).
Skills to practice
- Completing Sign Tables for Affine Expressions
VIII
Sign Tables of Products
When an inequality involves a product of factors, such as \((x-2)(x-1) > 0\), we cannot simply isolate \(x\). We must instead determine where the expression is positive or negative. The sign table (or sign chart) is a tool used to organise this analysis.
Proposition — Where an Expression Can Change Sign
A product of linear factors can change sign only at a critical value — a value where one of the factors is zero. Between two consecutive critical values, every factor keeps a constant sign, so the whole expression keeps a constant sign too.
A linear factor \(x - a\) is negative for \(x < a\) and positive for \(x > a\): it changes sign only at its own zero \(a\); a general factor \(ax+b = a\left(x + \frac{b}{a}\right)\) behaves the same way around its zero, the constant \(a\) never changing sign. On an interval containing no critical value, no factor changes sign; a product of factors of fixed signs has a fixed sign. This is why, in the table, each row keeps a single sign on each interval between two consecutive critical values — checking a single test value per interval would give the same result.
Method — Constructing a Sign Table
To create a sign table for a factored expression: - Find the critical values: Find the values of \(x\) that make each factor equal to zero. These are the points where the expression can change sign.
- Create the table: Write the critical values in increasing order in the top row of the table. List each factor in a separate row on the left, with the full expression in the last row.
- Determine the sign of each factor in the intervals created by the critical values. A linear factor \((x-a)\) is negative for \(x
- Determine the sign of the full expression in each interval by multiplying the signs of the factors in that column.
Example
Solve the inequality \((x-2)(x-1) \ge 0\). - Critical values: The factors are \((x-1)\) and \((x-2)\).
- \(x-1=0 \implies x=1\)
- \(x-2=0 \implies x=2\)
- Construct the sign table:
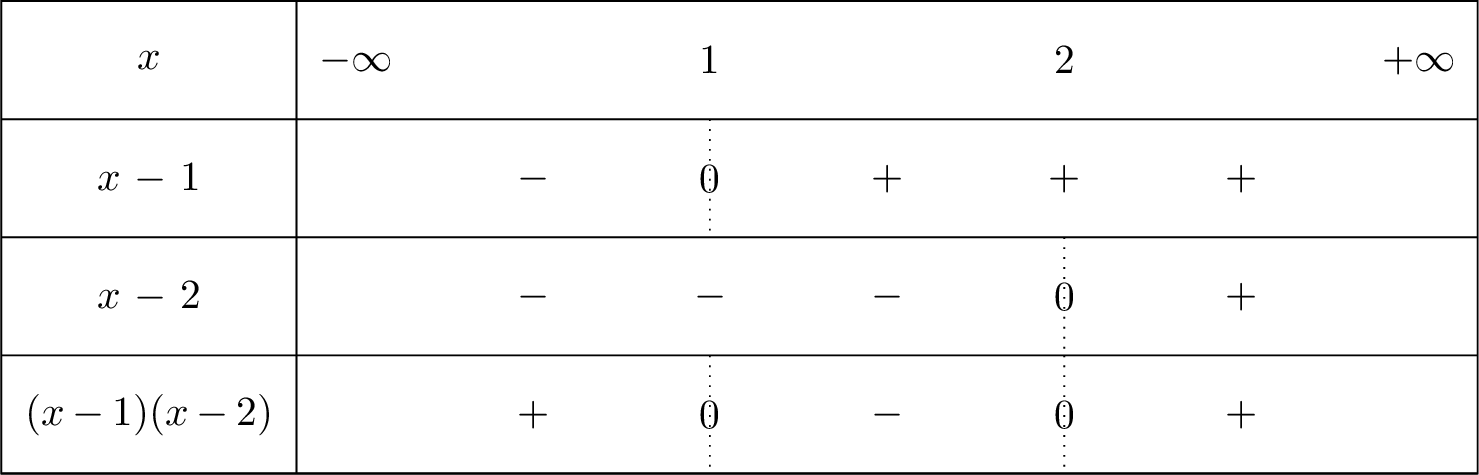
- Conclusion: The inequality asks for \((x-1)(x-2) \ge 0\), which means where the product is positive or zero. From the last row of the table, this occurs when \(x \le 1\) or \(x \ge 2\). In interval notation: \(x \in (-\infty,1] \cup [2,+\infty)\).
Skills to practice
- Identifying the Sign Table of an Expression
- Reading a Sign Table
- Building Sign Tables for Products
IX
Combining Transformations
Definition — Vertical Translation by Adding a Constant
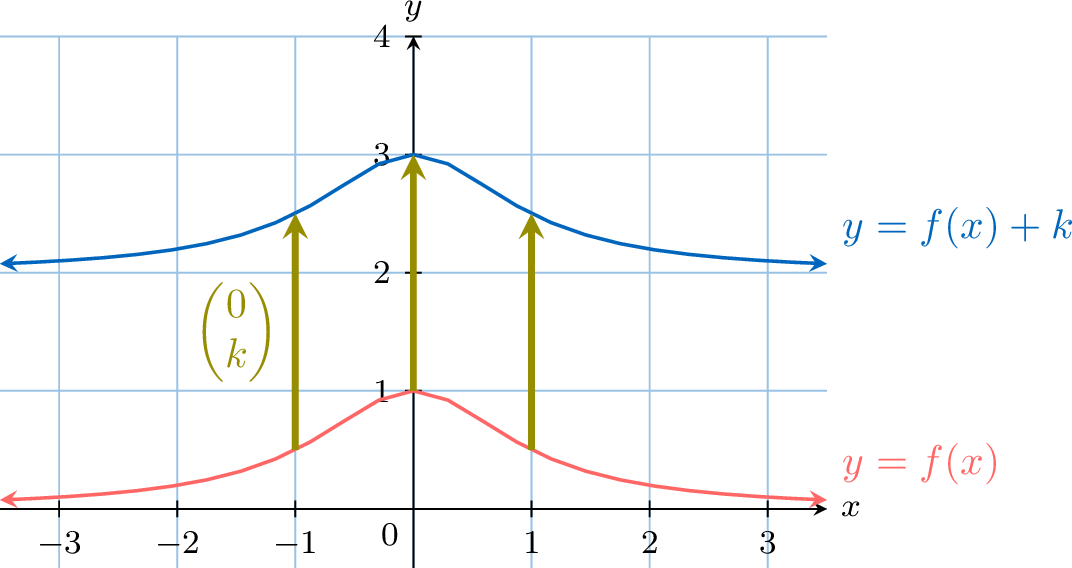
A vertical translation shifts the graph of a function up or down. The transformation is defined by:$$g(x) = f(x) + k$$ This transformation maps a point \((x, y)\) on the graph of \(f\) to a new point \((x, y+k)\) on the graph of \(g\). - If \(k>0\), the graph is translated \(\boldsymbol{k}\) units up.
- If \(k<0\), the graph is translated \(\boldsymbol{|k|}\) units down.
Definition — Horizontal Translation
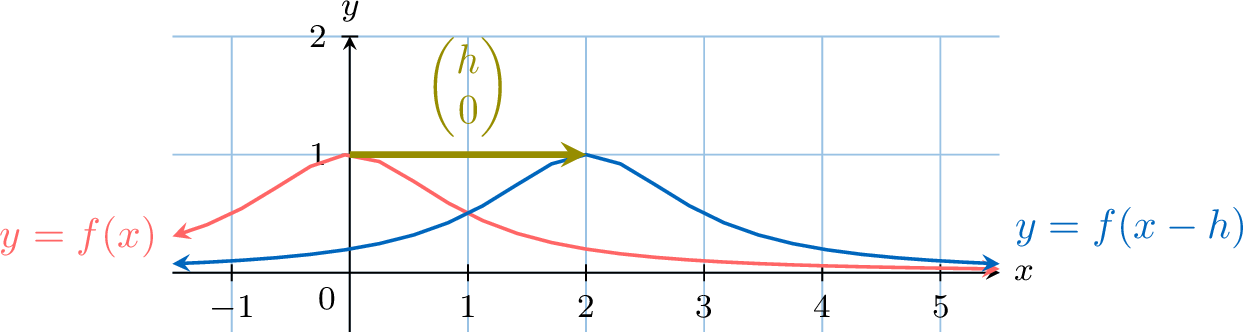
A horizontal translation shifts the graph of a function left or right. The transformation is defined by:$$g(x) = f(x-h)$$ This transformation maps a point \((x, y)\) on the graph of \(f\) to a new point \((x+h, y)\) on the graph of \(g\). - If \(h>0\), the graph is translated \(\boldsymbol{h}\) units to the right.
- If \(h<0\), the graph is translated \(\boldsymbol{|h|}\) units to the left.
Definition — Vertical Stretch
A vertical stretch stretches or compresses the graph of a function vertically. It is defined, for a number \(a \neq 0\), by:$$g(x) = a \cdot f(x)$$ This transformation maps a point \((x, y)\) to \((x, ay)\). - If \(|a|>1\), the graph is stretched vertically by a factor of \(|a|\).
- If \(0 < |a| < 1\), the graph is compressed vertically by a factor of \(|a|\).
- If \(a < 0\), the stretch or compression is followed by a reflection in the \(x\)-axis (\(a = -1\) gives the reflection alone).

Definition — Horizontal Stretch
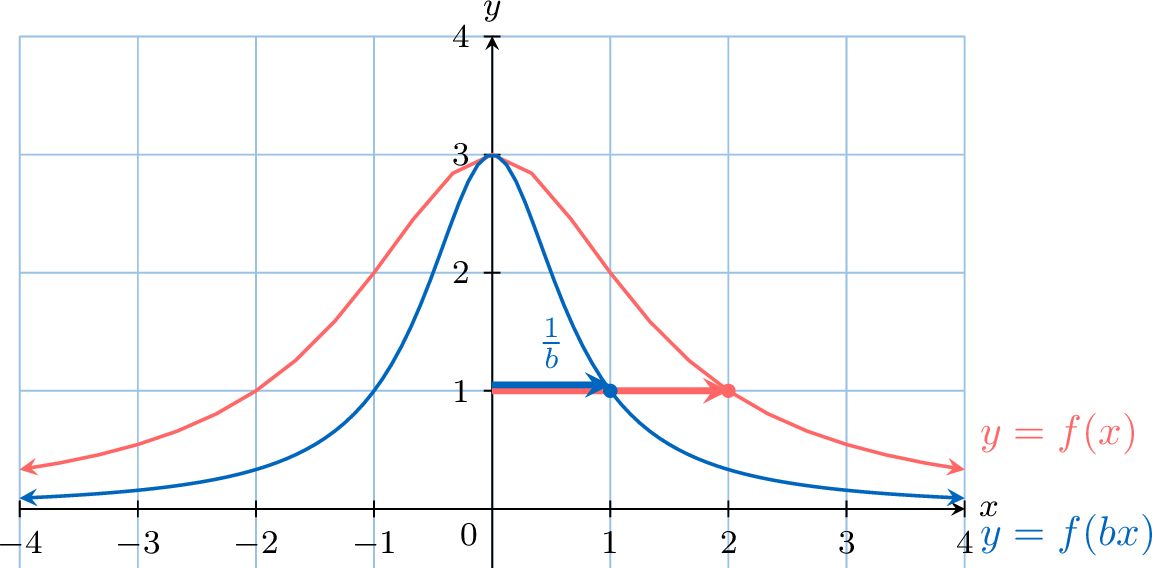
A horizontal stretch stretches or compresses the graph of a function horizontally. It is defined, for a number \(b \neq 0\), by:$$g(x) = f(bx)$$ This transformation maps a point \((x, y)\) to a new point \((\frac{x}{b}, y)\). - If \(|b|>1\), the graph is compressed horizontally by a factor of \(\frac{1}{|b|}\).
- If \(0 < |b| < 1\), the graph is stretched horizontally by a factor of \(\frac{1}{|b|}\).
- If \(b < 0\), the stretch or compression is followed by a reflection in the \(y\)-axis (\(b = -1\) gives the reflection alone).
When multiple transformations are applied to a function, the order in which they are performed is crucial. The standard form for a transformed function is:$$ g(x) = a \cdot f(b(x-c)) + d $$ To graph this function from the parent function \(f(x)\), apply the transformations in the following order:
Method — Order of Transformations
- Horizontal Transformations (inside the brackets):
- Apply the horizontal stretch/compression by the factor \(\frac{1}{|b|}\) (\(b \neq 0\)), followed by a reflection in the \(y\)-axis if \(b < 0\).
- Apply the horizontal translation (shift) by \(c\) units.
- Vertical Transformations (outside the brackets):
- Apply the vertical stretch/compression by the factor \(|a|\), followed by a reflection in the \(x\)-axis if \(a < 0\).
- Apply the vertical translation (shift) by \(d\) units.
Example
Describe the sequence of transformations that maps the graph of \(f(x)=\sqrt{x}\) onto the graph of \(g(x) = 3\sqrt{-x+2} - 4\).
First, we rewrite the function \(g(x)\) in the standard form \(a \cdot f(b(x-c)) + d\):$$ g(x) = 3\sqrt{-(x-2)} - 4 $$ Comparing this to \(f(x)=\sqrt{x}\), we have \(a=3\), \(b=-1\), \(c=2\), and \(d=-4\). The transformations are applied as follows: 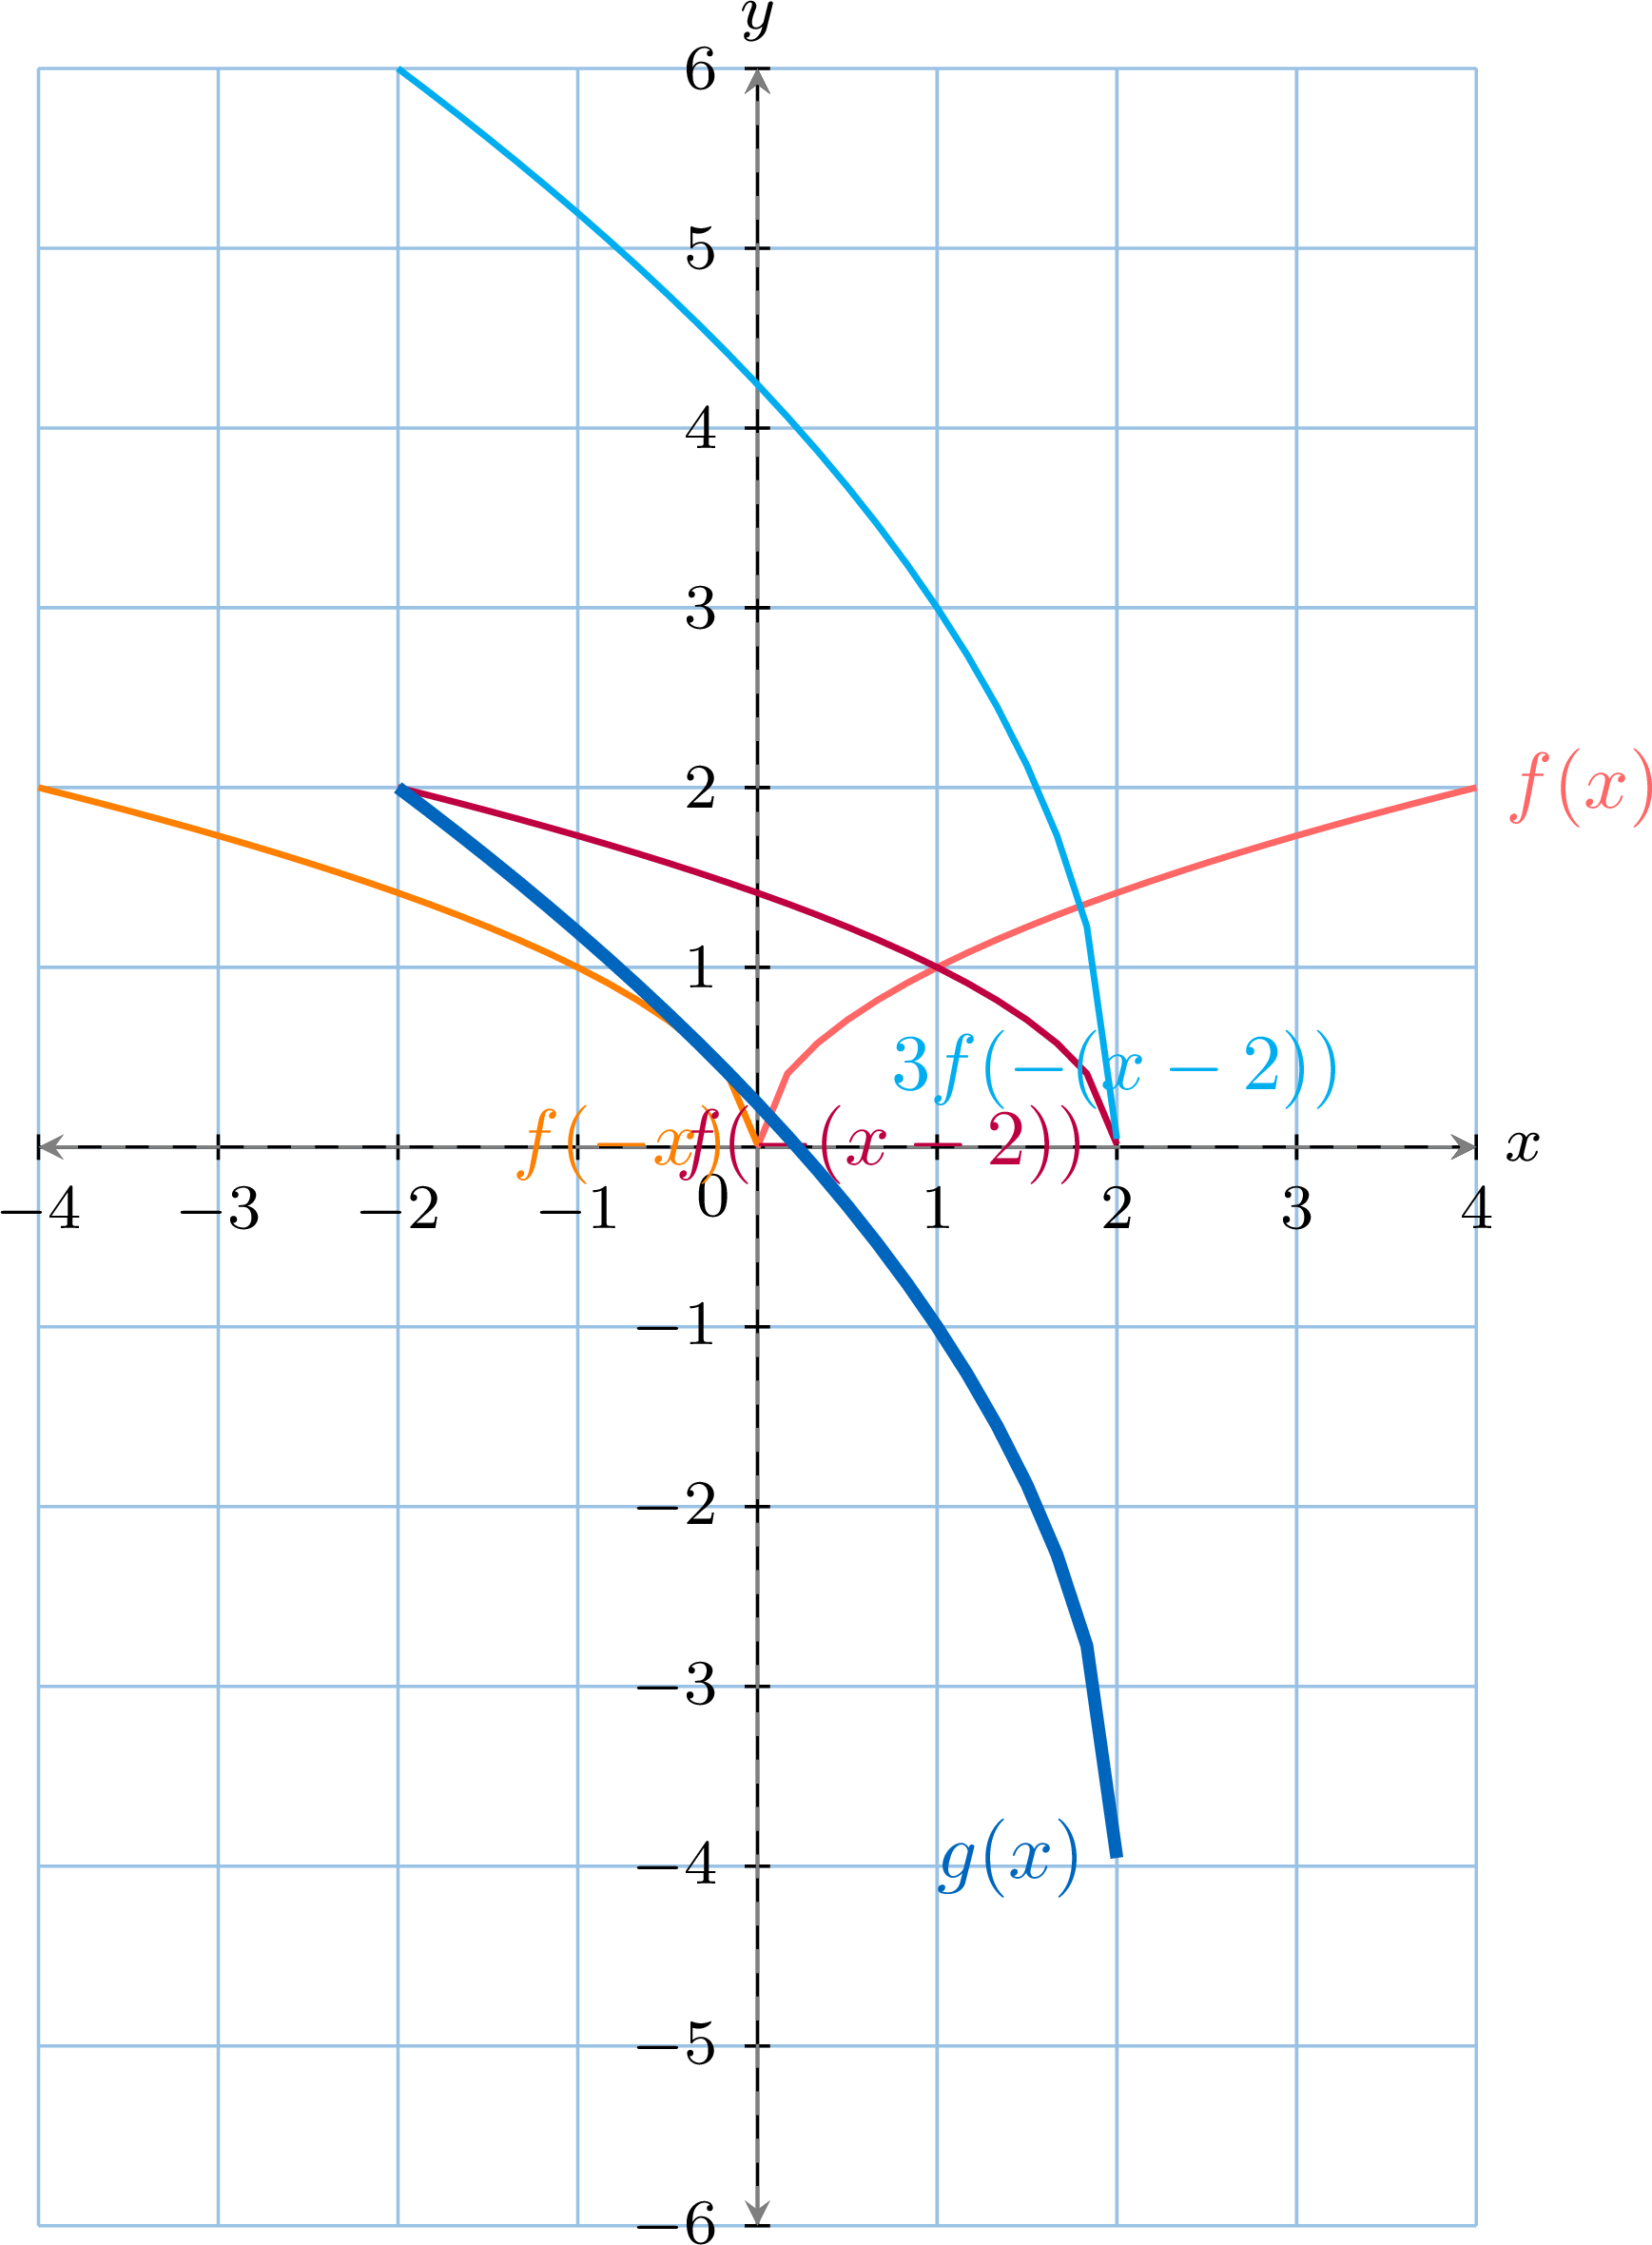
- Horizontal Transformations on \(f(x)=\sqrt{x}\):
- Reflection: Since \(b=-1\), reflect the graph in the y-axis (\(y = \sqrt{-x}\)).
- Translation: Since \(c=2\), translate the graph 2 units to the right (\(y = \sqrt{-(x-2)}\)).
- Vertical Transformations on the result:
- Stretch: Since \(a=3\), stretch the graph vertically by a factor of 3 (\(y = 3\sqrt{-(x-2)}\)).
- Translation: Since \(d=-4\), translate the graph 4 units down (\(y = 3\sqrt{-(x-2)} - 4\)).
Skills to practice
- Sketching Combined Transformations
- Finding Equations from a Sequence of Transformations
X
Going further
Skills to practice
- Reasoning about Functions
- Solving Problems with Functions
- Investigating Transformations of Graphs
- Quiz
Jump to section