International Baccalaureate · DP 2: Applications and Interpretation HL
Chi-squared Tests
I
The Test for Independence
I.1
The Chi-squared Test for Independence
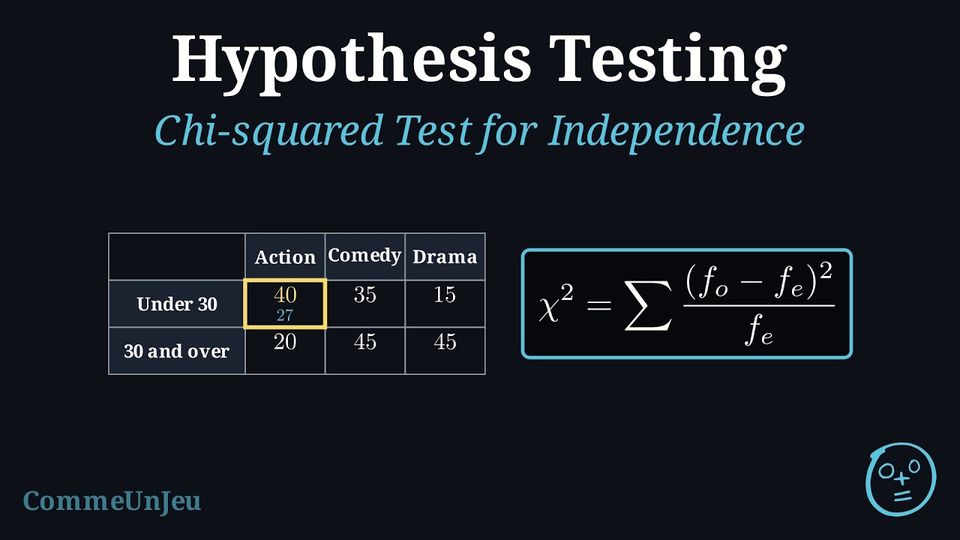
Every test so far has compared numerical measurements, such as means. The chi-squared test extends hypothesis testing to categorical data. In this sense it is the categorical analogue of correlation: a correlation coefficient measures the association between two numerical variables, while the chi-squared test of independence asks whether two categorical variables are associated.
Definition — Two-Way Table of Counts
Two qualitative variables are observed on the same population of \(N\) individuals. The two-way table of counts has one row for each category of the first variable and one column for each category of the second; the cell at row \(A\) and column \(B\) holds the count of the individuals that have both categories \(A\) and \(B\), written \(n(A \cap B)\). - The last column holds the row totals: \(n(A)\) is the number of individuals of category \(A\).
- The last row holds the column totals: \(n(B)\) is the number of individuals of category \(B\).
- The bottom-right cell holds the grand total \(N\), which is the sum of the row totals and the sum of the column totals.
The Chi-squared (\(\chi^2\)) test for independence determines if there is a significant association between two categorical variables. It compares the observed frequencies in a contingency table to the frequencies we would expect if the variables were completely independent.
Definition — Observed and Expected Frequencies
- Observed Frequencies (\(f_o\)): The actual data collected and recorded in a contingency table.
- Expected Frequencies (\(f_e\)): The theoretical counts calculated assuming the variables are independent.
Definition — Chi-squared Statistic
The test statistic \(\chi^2_{calc}\) measures the total deviation between observed and expected values:$$ \chi^2_{calc} = \sum \frac{(f_o - f_e)^2}{f_e} $$ The degrees of freedom (\(df\)) for a table with \(r\) rows and \(c\) columns is:$$ \mathrm{d}f = (r - 1)(c - 1) $$ Method — Steps for a Chi-squared Test
- Step 1: Write the Hypotheses
- \(H_0\): The variables are independent.
- \(H_1\): The variables are not independent (associated).
- Step 2: Enter data into GDC
- Enter the observed contingency table into a Matrix (e.g., Matrix A).
- Select \(\chi^2\)-Test (usually under Stat \(\to\) Tests).
- Step 3: Analyze Results
The calculator provides \(\chi^2_{calc}\), the p-value, and the degrees of freedom (\(df\)).
Note: As a rule of thumb, all expected frequencies should be at least 5 for the test to be reliable. - Step 4: Conclusion
Compare the p-value to the significance level \(\alpha\).- If \(p\text{-value} < \alpha\): Reject \(H_0\) (Variables are dependent/associated).
- If \(p\text{-value} \geq \alpha\): Fail to reject \(H_0\) (No evidence of association).
Example
A survey asked 200 people about their preferred type of movie and their age group. The results are shown below: | Action | Comedy | Drama | |
| Under 30 | 40 | 35 | 15 |
| 30 and over | 20 | 45 | 45 |
- Step 1: Hypotheses
\(H_0\): Age group and movie preference are independent.
\(H_1\): Age group and movie preference are not independent (they are associated). - Step 2: Calculator
Enter the \(2 \times 3\) matrix into the calculator and run the \(\chi^2\)-Test.- \(\chi^2_{calc} \approx 21.1\)
- \(\mathrm{d}f = (2-1)(3-1) = 2\)
- \(p\text{-value} \approx 0.000026\) (about \(2.6 \times 10^{-5}\))
- Step 3: Conclusion
\(0.000026 < 0.05\). Since \(p < \alpha\), we reject \(H_0\).
There is strong evidence to suggest that movie preference depends on age group.
Method — Deciding with a \(\chi^2\) Critical Value
The statistic \(\chi^2_{calc}\) is never negative, and it grows as the observed frequencies move away from the expected ones: only large values count against \(H_0\), so a \(\chi^2\) test is always upper-tailed. Its critical value \(\chi^2_{crit}\) is the number such that \(P(\chi^2 \geq \chi^2_{crit}) = \alpha\) for the \(\chi^2\) distribution with the degrees of freedom \(\nu\) of the test; it is read in a table or given in the question. - Expected frequencies: compute them, and check that each one is greater than \(5\).
- Statistic: \(\chi^2_{calc} = \sum \dfrac{(f_o - f_e)^2}{f_e}\), by hand for a small table or with the calculator, and the degrees of freedom \(\nu\).
- Decision: reject \(H_0\) if \(\chi^2_{calc} \geq \chi^2_{crit}\); otherwise do not reject it. It is the same decision as rejecting when \(p\text{-value} \leq \alpha\).
| \(\nu\) | \(1\) | \(2\) | \(3\) | \(4\) | \(5\) | \(6\) | \(9\) |
| \(\alpha = 0.10\) | \(2.706\) | \(4.605\) | \(6.251\) | \(7.779\) | \(9.236\) | \(10.645\) | \(14.684\) |
| \(\alpha = 0.05\) | \(3.841\) | \(5.991\) | \(7.815\) | \(9.488\) | \(11.070\) | \(12.592\) | \(16.919\) |
| \(\alpha = 0.01\) | \(6.635\) | \(9.210\) | \(11.345\) | \(13.277\) | \(15.086\) | \(16.812\) | \(21.666\) |
Example
A café asks \(150\) customers whether they prefer coffee or tea, and notes their age group. | Coffee | Tea | |
| Under \(40\) | \(45\) | \(30\) |
| \(40\) and over | \(25\) | \(50\) |
- \(H_0\): the preferred drink is independent of the age group; \(H_1\): it is not.
- The row totals are \(75\) and \(75\), the column totals \(70\) (coffee) and \(80\) (tea), the grand total \(150\). For the cell “under \(40\), coffee”: $$f_e = \frac{\text{row total} \times \text{column total}}{\text{grand total}} = \frac{75 \times 70}{150} = 35,$$ and likewise \(40\) for “under \(40\), tea”, \(35\) and \(40\) for the second row: all greater than \(5\).
- Every cell is \(10\) away from its expected frequency: $$\begin{aligned}[t] \chi^2_{calc} &= \sum \frac{(f_o - f_e)^2}{f_e} && \text{(statistic)} \\ &= \frac{10^2}{35} + \frac{10^2}{40} + \frac{10^2}{35} + \frac{10^2}{40} \\ &\approx 2.857 + 2.5 + 2.857 + 2.5 \approx 10.71, \end{aligned}$$ with \(\nu = (2 - 1)(2 - 1) = 1\).
- At \(\alpha = 0.05\) and \(\nu = 1\), \(\chi^2_{crit} = 3.841\). Since \(10.71 > 3.841\), reject \(H_0\) (the calculator gives \(p\text{-value} \approx 0.00106\), the same decision).
- At the \(5\pourcent\) level, the preferred drink depends on the age group: the younger customers lean towards coffee, the older towards tea.
Skills to practice
- Deciding with a Critical Value
- Computing Expected Frequencies and Degrees of Freedom
- Conducting Chi-squared Tests for Independence
II
Goodness of Fit
II.1
The Chi-squared Goodness of Fit Test
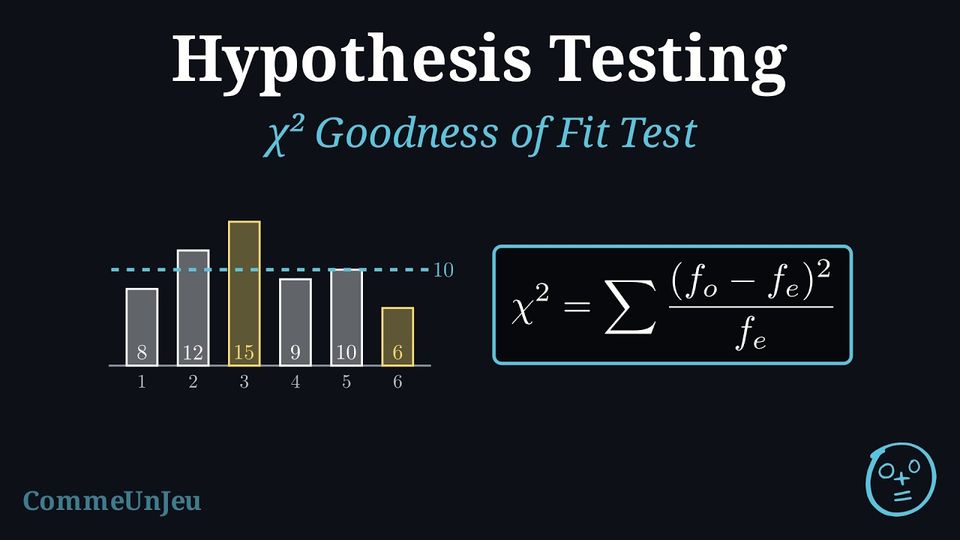
The Goodness of Fit (GOF) test is used to determine whether a variable is likely to come from a specified distribution (such as Uniform, Binomial, Normal, or a specific ratio). It compares the observed data with what we would expect theoretically.
Definition — Goodness of Fit Statistic
The test uses the same \(\chi^2\) statistic formula:$$ \chi^2_{calc} = \sum \frac{(f_o - f_e)^2}{f_e} $$ However, the degrees of freedom (\(df\)) calculation depends on the distribution:$$ \mathrm{d}f = k - 1 - m $$ Where: - \(k\) is the number of categories (bins).
- \(m\) is the number of population parameters estimated from the sample data (e.g., if you calculate mean and standard deviation from the sample to fit a Normal distribution, \(m=2\)).
Method — Steps for a GOF Test
- Step 1: Hypotheses
- \(H_0\): The data follow the specified distribution.
- \(H_1\): The data do not follow the specified distribution.
- Step 2: Expected Frequencies
Calculate the expected frequency for each category: $$ f_e = n \times P(\text{category}) $$ (As for the independence test, all expected frequencies should be at least 5 for the \(\chi^2\) approximation to be reliable.) Note: Usually done in List 2 of the GDC. - Step 3: Calculator
- Enter observed values in List 1 (\(f_o\)).
- Enter expected values in List 2 (\(f_e\)).
- Select \(\chi^2\) GOF Test.
- Enter the correct \(df\).
- Step 4: Conclusion
Compare p-value to \(\alpha\) and interpret in context.
Example
A die is rolled 60 times. The results are: | Outcome | 1 | 2 | 3 | 4 | 5 | 6 |
| Frequency | 8 | 12 | 15 | 9 | 10 | 6 |
- Hypotheses:
\(H_0\): The die is fair (Uniform distribution).
\(H_1\): The die is not fair. - Expected Frequencies:
Total \(n=60\). If fair, \(P(X=k) = 1/6\). $$ f_e = 60 \times \frac{1}{6} = 10 \quad \text{for all outcomes} $$ - Calculator / Working:
\(L_1: \{8, 12, 15, 9, 10, 6\}\)
\(L_2: \{10, 10, 10, 10, 10, 10\}\) $$ \chi^2_{calc} = \sum \frac{(f_o - f_e)^2}{f_e} = \frac{(8-10)^2}{10} + \frac{(12-10)^2}{10} + \cdots + \frac{(6-10)^2}{10} = 5.0 $$ Degrees of freedom: \(\mathrm{d}f = k - 1 = 6 - 1 = 5\) (no parameters estimated).
\(p\text{-value} \approx 0.416\). - Conclusion:
\(0.416 > 0.05\). We fail to reject \(H_0\): there is insufficient evidence at the 5\,\(\pourcent\) level to conclude the die is unfair.
Skills to practice
- Finding Expected Frequencies for a Goodness of Fit
- Conducting Chi-squared Goodness of Fit Tests
II.2
Goodness of Fit with Estimated Parameters
When the Model Is Not Fully Given
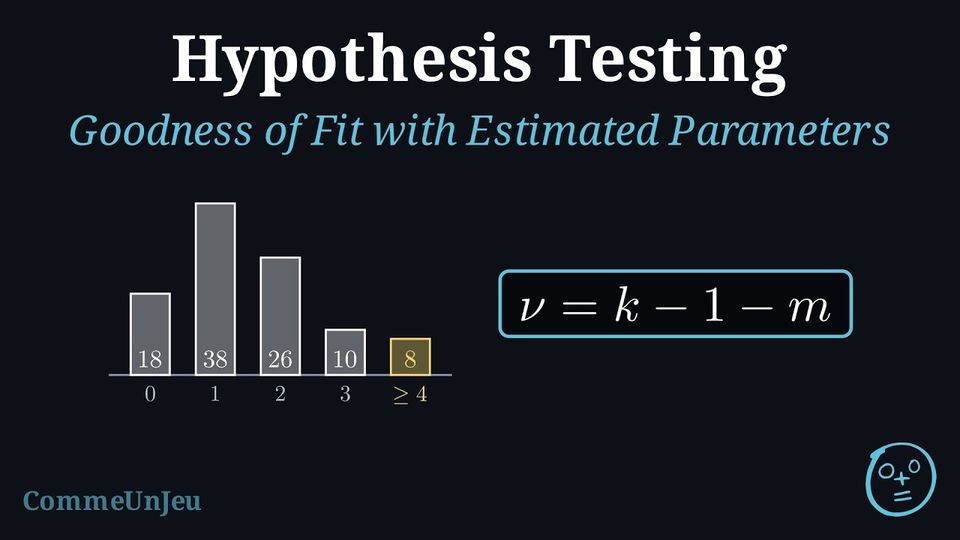
In the goodness-of-fit tests met so far, the model was given in full: a fair die, a ratio \(9:3:3:1\), a binomial distribution with known \(n\) and \(p\). Often only the family of the model is claimed — “the counts follow a Poisson distribution”, “the heights are normally distributed” — and its parameters are estimated from the same data: \(\lambda\) by the sample mean \(\bar{x}\), \(p\) by \(\dfrac{\bar{x}}{n}\) for \(\mathcal{B}(n, p)\), \(\mu\) and \(\sigma\) by \(\bar{x}\) and \(s_{n-1}\). Parameters fitted to the data make the model follow these very data more closely than a model fixed in advance would, so \(\chi^2_{calc}\) tends to be smaller: to compensate, each estimated parameter costs one degree of freedom, \(\nu = k - 1 - m\) (the usual rule, an approximation that works well in practice). When the data are numerical, the test also needs categories: values or intervals chosen so that every expected frequency is greater than \(5\).
Method — Testing the Fit of a Model with Estimated Parameters
- Hypotheses: \(H_0\): the data follow a distribution of the claimed family (Poisson, binomial, normal); \(H_1\): they do not.
- Estimates: \(\lambda = \bar{x}\) for a Poisson model; \(p = \dfrac{\bar{x}}{n}\) for \(\mathcal{B}(n, p)\); \(\mu = \bar{x}\) and \(\sigma = s_{n-1}\) for a normal model.
- Categories and probabilities: for a discrete model, one category per value and a last open category “\(\geq k\)”, so that the probabilities add up to \(1\); for a normal model, class intervals whose first and last classes are open (below the first bound, above the last).
- Expected frequencies: \(f_e = N \times P(\text{category})\), with \(N\) the number of observations; combine adjacent categories, and their observed frequencies with them, until every expected frequency is greater than \(5\).
- Degrees of freedom: \(\nu = k - 1 - m\), with \(k\) the number of categories after combining and \(m\) the number of estimated parameters; \(\nu\) must be at least \(1\), otherwise there are too few categories for the number of estimated parameters and the test cannot be carried out.
- Test: run the \(\chi^2\) goodness-of-fit test of the calculator, entering \(\nu\) by hand — the calculator does not know how many parameters were estimated — or compare \(\chi^2_{calc}\) with the critical value for \(\nu\).
Example
Over \(100\) one-minute intervals, the number of customers arriving at a ticket counter is recorded; no interval had more than \(5\) customers. | Customers | \(0\) | \(1\) | \(2\) | \(3\) | \(4\) | \(5\) |
| Intervals | \(18\) | \(38\) | \(26\) | \(10\) | \(5\) | \(3\) |
- \(H_0\): the number of customers per minute follows a Poisson distribution; \(H_1\): it does not.
- The parameter is estimated by the mean number of customers per minute: $$\lambda = \bar{x} = \frac{0 \times 18 + 1 \times 38 + 2 \times 26 + 3 \times 10 + 4 \times 5 + 5 \times 3}{100} = \frac{155}{100} = 1.55.$$
- With \(X \sim \mathcal{P}(1.55)\) and \(N = 100\), the expected frequencies are \(100\,P(X = k)\), the last category “\(\geq 4\)” taking \(1 - P(X \leq 3)\):
Customers \(0\) \(1\) \(2\) \(3\) \(\geq 4\) \(f_o\) \(18\) \(38\) \(26\) \(10\) \(8\) \(f_e\) \(21.22\) \(32.90\) \(25.50\) \(13.17\) \(7.21\) - \(k = 5\) categories and \(m = 1\) estimated parameter: \(\nu = 5 - 1 - 1 = 3\).
- The \(\chi^2\) goodness-of-fit test with \(\nu = 3\) gives \(\chi^2_{calc} \approx 2.14\) and \(p\text{-value} \approx 0.543\). Since \(0.543 > 0.05\) (equivalently \(2.14 < 7.815\)), \(H_0\) is not rejected: at the \(5\pourcent\) level, a Poisson distribution with mean \(1.55\) is consistent with the arrivals.
Example
The heights, in cm, of \(200\) plants of a nursery are grouped in classes. From the raw data, \(\bar{x} = 27.4\) and \(s_{n-1} = 5.1\). | Height | \(< 20\) | \(20\)–\(24\) | \(24\)–\(28\) | \(28\)–\(32\) | \(32\)–\(36\) | \(\geq 36\) |
| Plants | \(10\) | \(38\) | \(74\) | \(42\) | \(20\) | \(16\) |
- \(H_0\): the heights follow a normal distribution; \(H_1\): they do not.
- The parameters are estimated from the data: \(\mu = 27.4\) and \(\sigma = 5.1\), so the model is \(X \sim \mathcal{N}(27.4, 5.1^2)\).
- Each expected frequency is \(200\) times the probability of its class, the first and last classes being open. For the first: $$\begin{aligned}[t] f_e &= 200\,P(X < 20) = 200\,P\left(Z < \frac{20 - 27.4}{5.1}\right) \\
&\approx 200 \times 0.0734 \approx 14.68, \end{aligned}$$ and in the same way:
Height \(< 20\) \(20\)–\(24\) \(24\)–\(28\) \(28\)–\(32\) \(32\)–\(36\) \(\geq 36\) \(f_o\) \(10\) \(38\) \(74\) \(42\) \(20\) \(16\) \(f_e\) \(14.68\) \(35.82\) \(58.87\) \(53.93\) \(27.53\) \(9.17\) - \(k = 6\) classes and \(m = 2\) estimated parameters: \(\nu = 6 - 1 - 2 = 3\).
- The \(\chi^2\) goodness-of-fit test with \(\nu = 3\) gives \(\chi^2_{calc} \approx 15.29\) and \(p\text{-value} \approx 0.00158\). Since \(0.00158 \leq 0.05\) (equivalently \(15.29 > 7.815\)), \(H_0\) is rejected: at the \(5\pourcent\) level, the heights are not normally distributed — there are too many plants in the middle class and in the tallest class for a symmetric bell curve.
Skills to practice
- Counting Degrees of Freedom
- Testing the Fit of a Model
III
Going further
Skills to practice
- Problems: Choosing and Carrying Out Tests
- Quiz
Jump to section