International Baccalaureate · DP 2: Analysis and Approaches SL
Trigonometric Functions
I
Periodic Functions
I.1
Periodic Behaviour
Recappreviously studied — click to reread
A function \(f\) is periodic if it repeats itself in regular intervals.
Definition — Periodic Function
A function \(f\) is periodic if there exists a constant \(P>0\) such that$$f(x+P) = f(x), \forall x$$ - The period is the length of one full repetition or cycle. It is the smallest positive value \(p\) such that \(f(x+p) = f(x)\) for all \(x\).
- The principal axis or mean line is the horizontal line about which the wave oscillates, given by $$y = \frac{\text{maximum value} + \text{minimum value}}{2}$$
- The amplitude is the distance from the principal axis to a maximum or minimum point, given by $$\frac{\text{maximum value} - \text{minimum value}}{2}$$
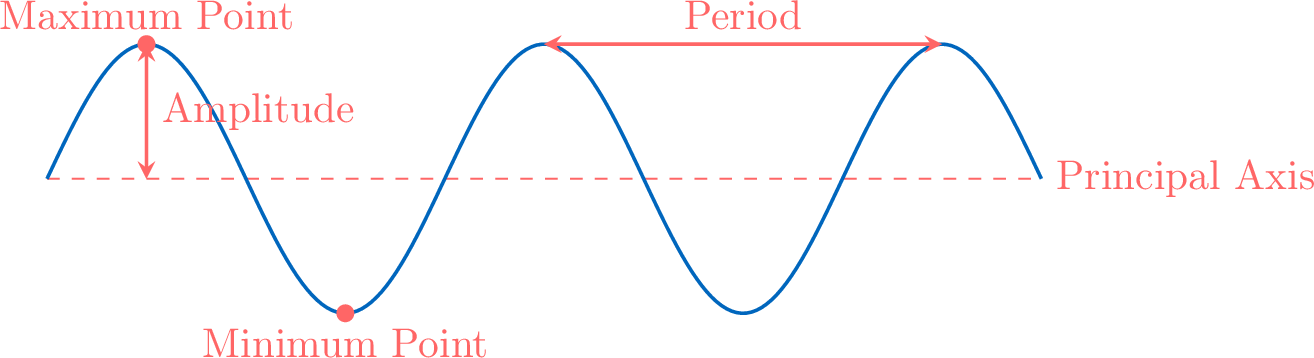
Among the many types of periodic functions, some exhibit a smooth, wave-like pattern. These sinusoidal functions are modelled with the sine and cosine trigonometric functions.
Skills to practice
- Identifying Periodic Behaviour from a Graph
II
The Sine and Cosine Functions
II.1
Sine and Cosine as Functions
Recappreviously studied — click to reread
Let \(M(\cos x, \sin x)\) be the point on the unit circle corresponding to an angle \(x\) (in radians).
See for example: \href{https://www.geogebra.org/m/j7w29vj4}{GeoGebra demo}. 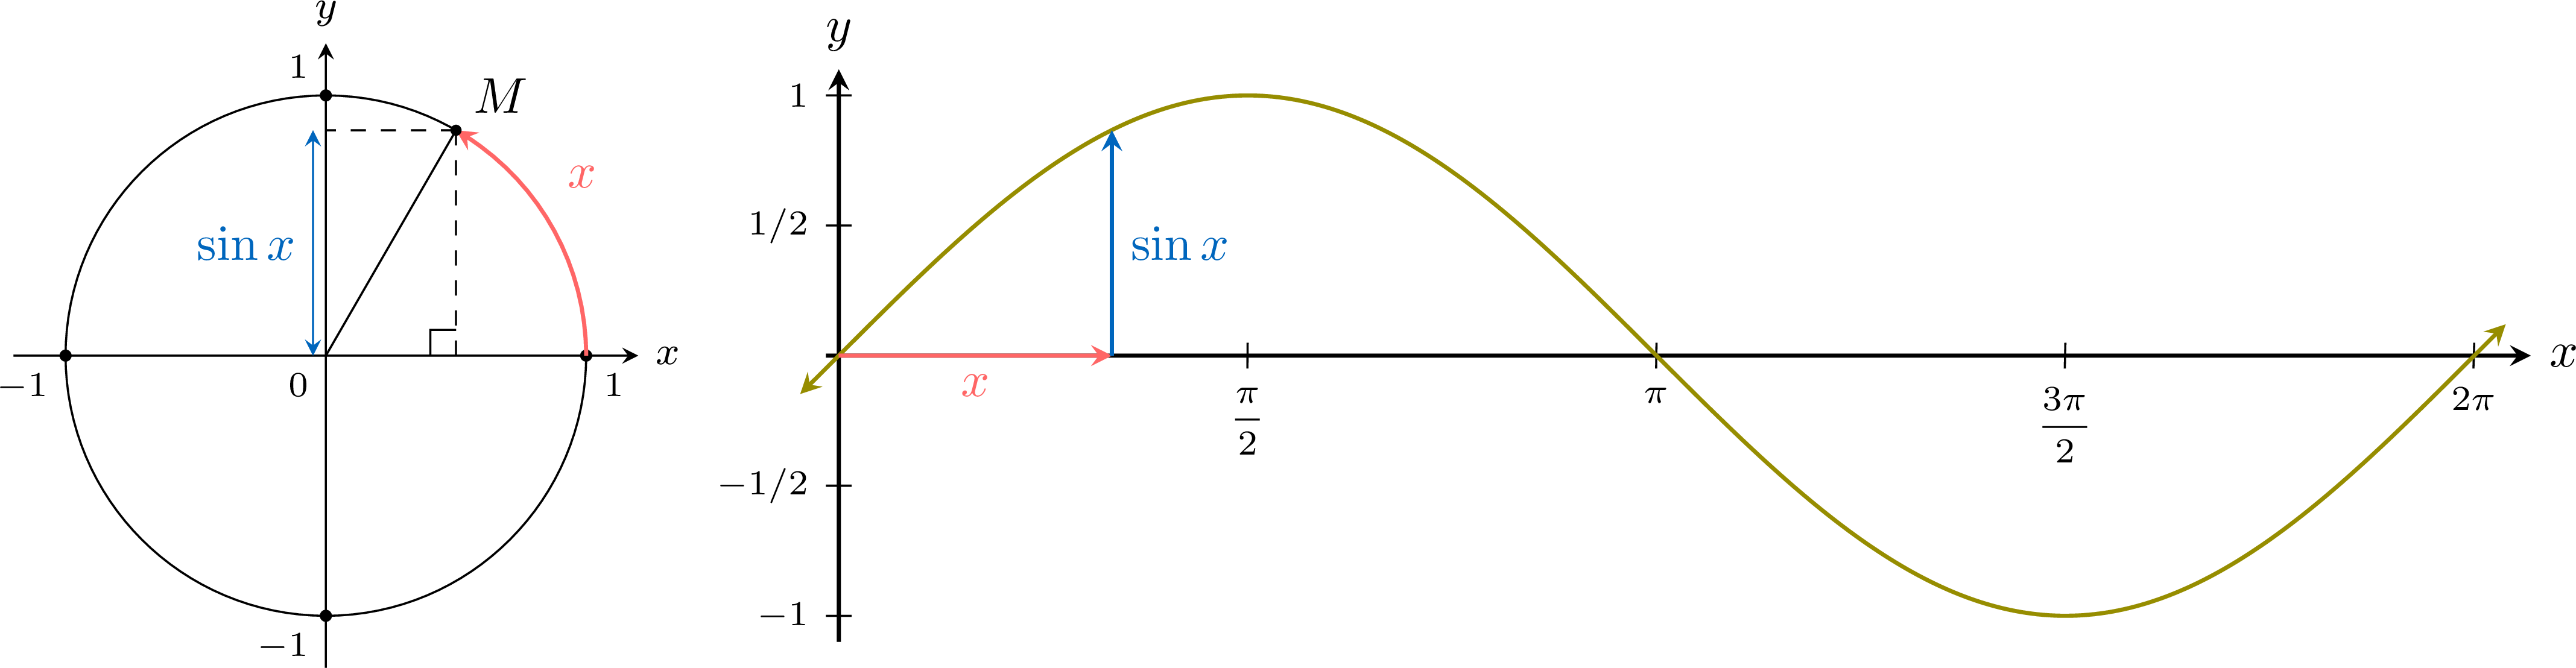
- The angle \(x\) on the unit circle corresponds to the input for the sine function.
- The \(y\)-coordinate of point \(M\) on the unit circle, \(\sin x\), gives the output of the sine function.
See for example: \href{https://www.geogebra.org/m/j7w29vj4}{GeoGebra demo}.
Definition — Sine Function
The sine function, denoted \(\sin\), is the function defined on \(\mathbb{R}\) which maps every real number \(x\) to the \(y\)-coordinate of the point \(M\) of the trigonometric circle associated with \(x\): \(x\mapsto \sin(x)\). Example
Complete the following table with the values of the sine function at key angles: | \(x\) | 0 | \(\dfrac{\pi}{6}\) | \(\dfrac{\pi}{4}\) | \(\dfrac{\pi}{3}\) | \(\dfrac{\pi}{2}\) | \(\dfrac{2 \pi}{3}\) | \(\dfrac{3 \pi}{4}\) | \(\dfrac{5 \pi}{6}\) | \(\pi\) |
| \(\sin (x)\) |
| \(x\) | 0 | \(\dfrac{\pi}{6}\) | \(\dfrac{\pi}{4}\) | \(\dfrac{\pi}{3}\) | \(\dfrac{\pi}{2}\) | \(\dfrac{2 \pi}{3}\) | \(\dfrac{3 \pi}{4}\) | \(\dfrac{5 \pi}{6}\) | \(\pi\) |
| \(\sin (x)\) | 0 | \(\dfrac{1}{2}\) | \(\dfrac{\sqrt{2}}{2}\) | \(\dfrac{\sqrt{3}}{2}\) | 1 | \(\dfrac{\sqrt{3}}{2}\) | \(\dfrac{\sqrt{2}}{2}\) | \(\dfrac{1}{2}\) | \(0\) |
If we instead project the values of \(\cos x\) from the unit circle onto a graph, we obtain the graph of the cosine function \(x \mapsto \cos x\). 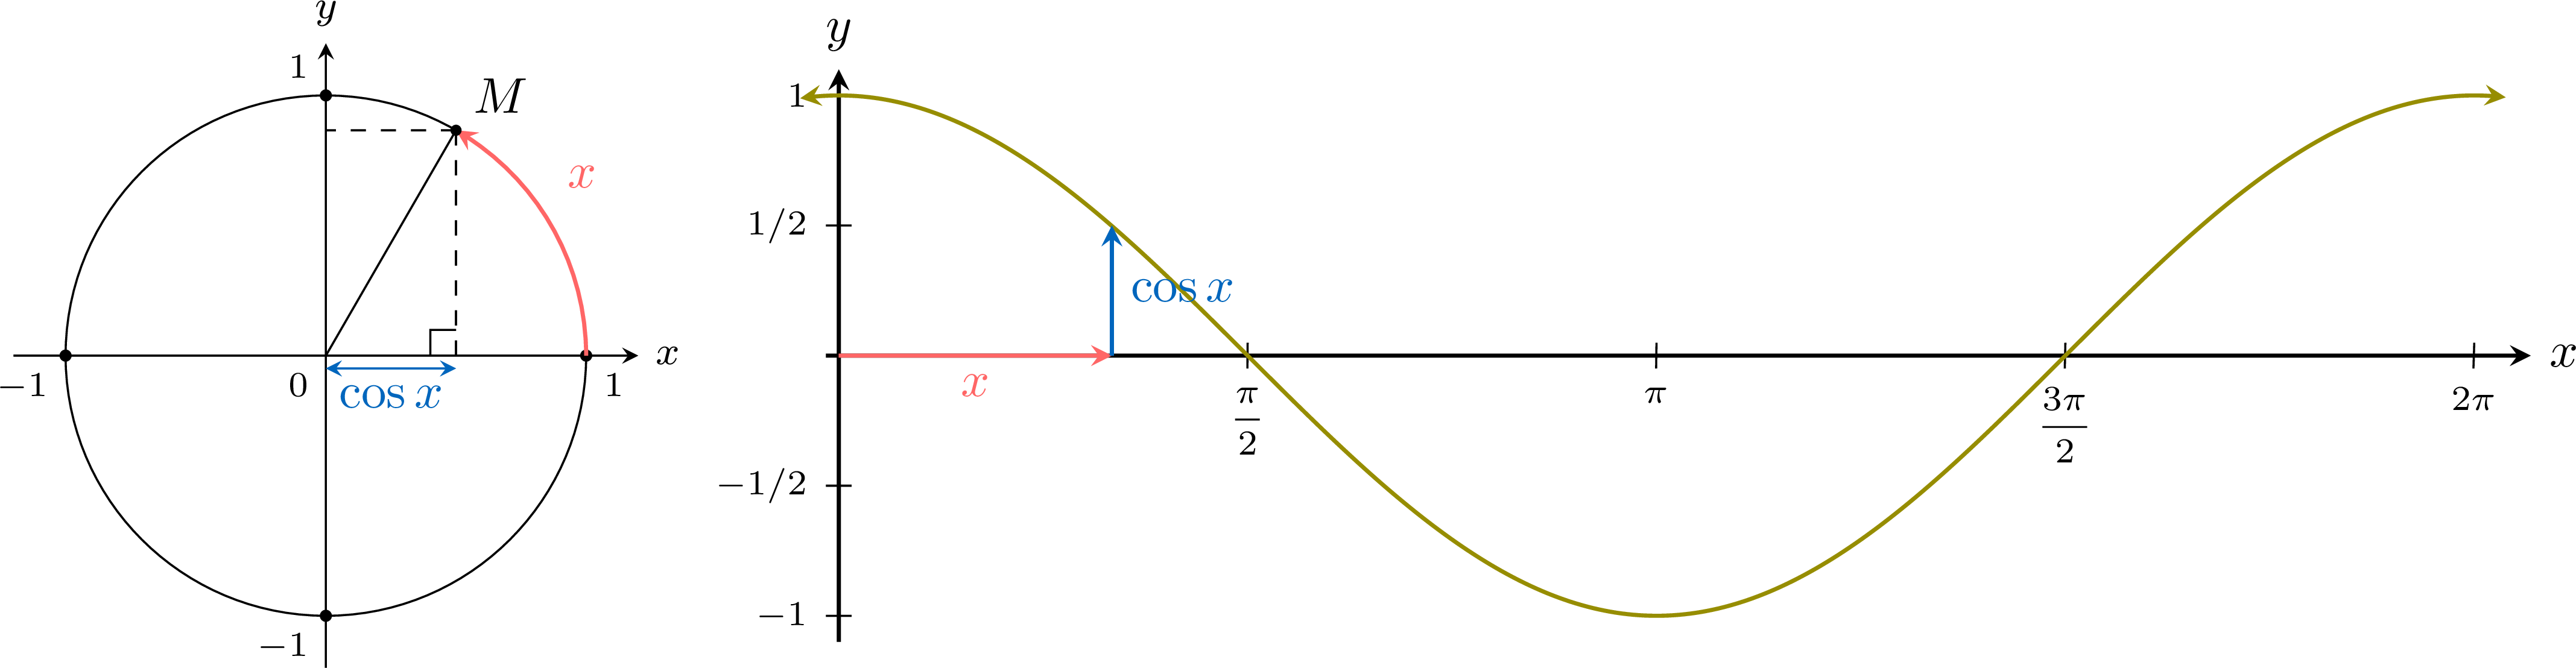
Definition — Cosine Function
The cosine function, denoted \(\cos\), is the function defined on \(\mathbb{R}\) which maps every real number \(x\) to the \(x\)-coordinate of the point \(M\) of the trigonometric circle associated with \(x\): \(x\mapsto\cos(x)\). Example
Complete the following table with the values of the cosine function at key angles: | \(x\) | 0 | \(\dfrac{\pi}{6}\) | \(\dfrac{\pi}{4}\) | \(\dfrac{\pi}{3}\) | \(\dfrac{\pi}{2}\) | \(\dfrac{2 \pi}{3}\) | \(\dfrac{3 \pi}{4}\) | \(\dfrac{5 \pi}{6}\) | \(\pi\) |
| \(\cos (x)\) |
| \(x\) | \(0\) | \(\dfrac{\pi}{6}\) | \(\dfrac{\pi}{4}\) | \(\dfrac{\pi}{3}\) | \(\dfrac{\pi}{2}\) | \(\dfrac{2 \pi}{3}\) | \(\dfrac{3 \pi}{4}\) | \(\dfrac{5 \pi}{6}\) | \(\pi\) |
| \(\cos (x)\) | \(1\) | \(\dfrac{\sqrt{3}}{2}\) | \(\dfrac{\sqrt{2}}{2}\) | \(\dfrac{1}{2}\) | \(0\) | \(-\dfrac{1}{2}\) | \(-\dfrac{\sqrt{2}}{2} \) | \(-\dfrac{\sqrt{3}}{2}\) | \(-1\) |
Proposition — Domain and Range of the Sine and Cosine Functions
The sine and cosine functions are defined on \(\mathbb{R}\). For every real \(x\), \(-1 \le \sin x \le 1\) and \(-1 \le \cos x \le 1\), and, the point associated with \(x\) running over the whole unit circle, its \(x\)-coordinate and its \(y\)-coordinate take every value between \(-1\) and \(1\): the range of each function is \([-1, 1]\). Proposition — Properties of Sine and Cosine
- Periodicity: Both functions are periodic with a period of \(2\pi\). \(\sin(x+2\pi) = \sin(x)\) and \(\cos(x+2\pi) = \cos(x)\).
- Parity: Cosine is an even function (\(\cos(-x)=\cos(x)\)). Sine is an odd function (\(\sin(-x)=-\sin(x)\)).
Skills to practice
- Completing Tables and Reading Graphs
- Plotting the Sine and Cosine Curves
- Reading Solutions and Periods on the Curves
II.2
Variations and Symmetries of the Curves
Recappreviously studied — click to reread
Periodicity says that the curves of cosine and sine repeat a pattern of length \(2\pi\). The trigonometric circle tells more about this pattern: where it rises, where it falls, and which symmetries it has.
Proposition — Variations of the Cosine and Sine Functions
On \(\left[-\pi, \pi\right]\): - the cosine function is increasing on \(\left[-\pi, 0\right]\) and decreasing on \(\left[0, \pi\right]\);
- the sine function is increasing on \(\left[-\dfrac{\pi}{2}, \dfrac{\pi}{2}\right]\), and decreasing on \(\left[-\pi, -\dfrac{\pi}{2}\right]\) and on \(\left[\dfrac{\pi}{2}, \pi\right]\).
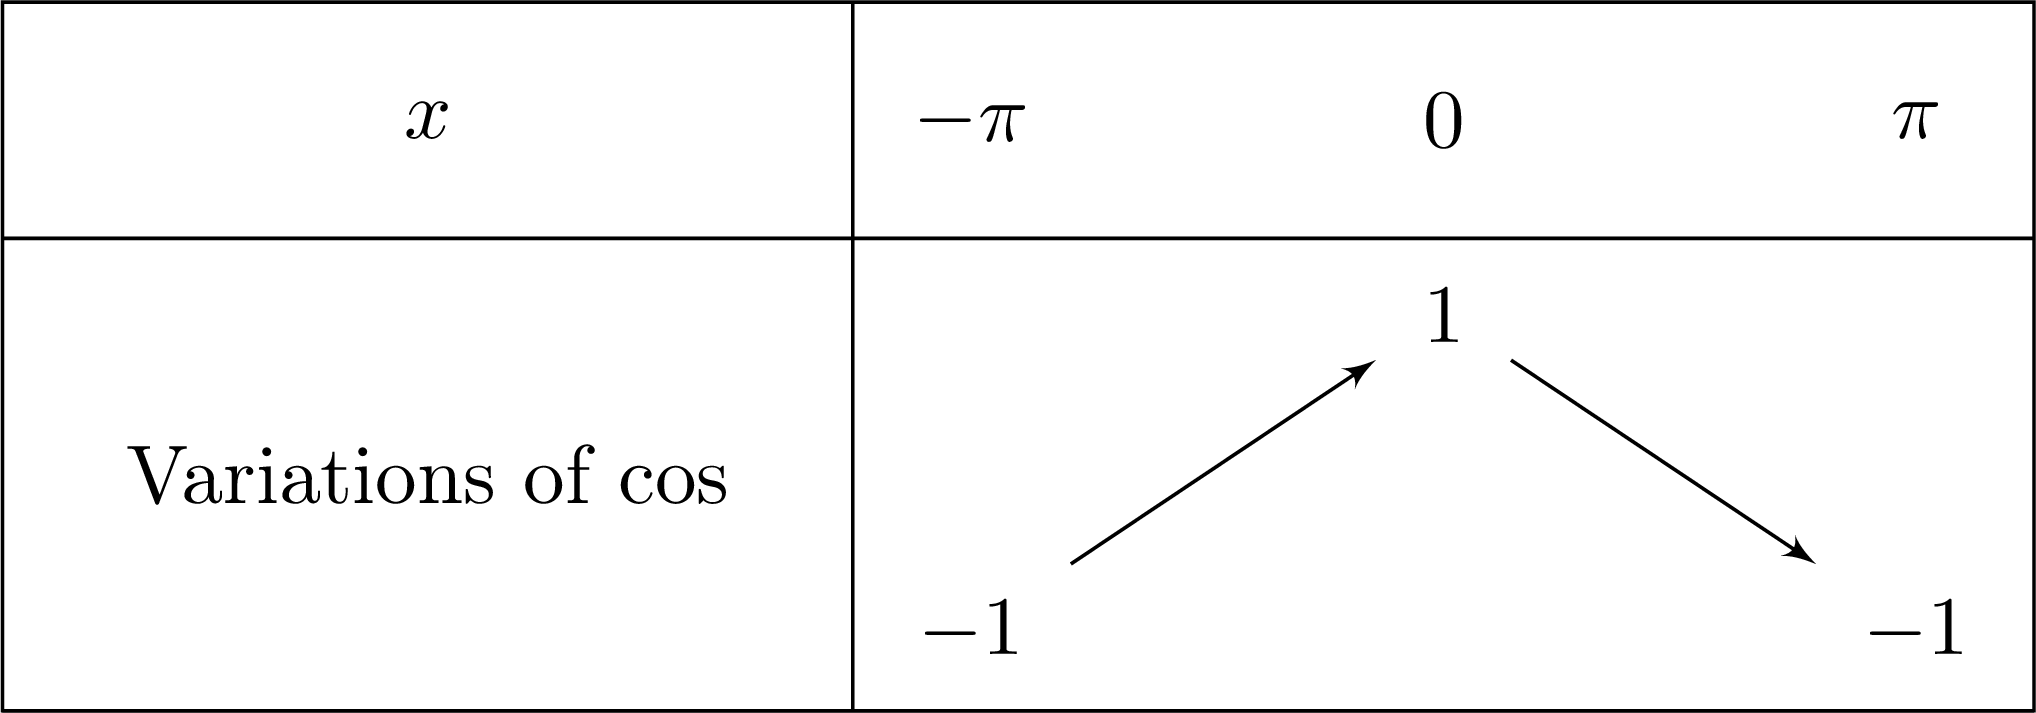
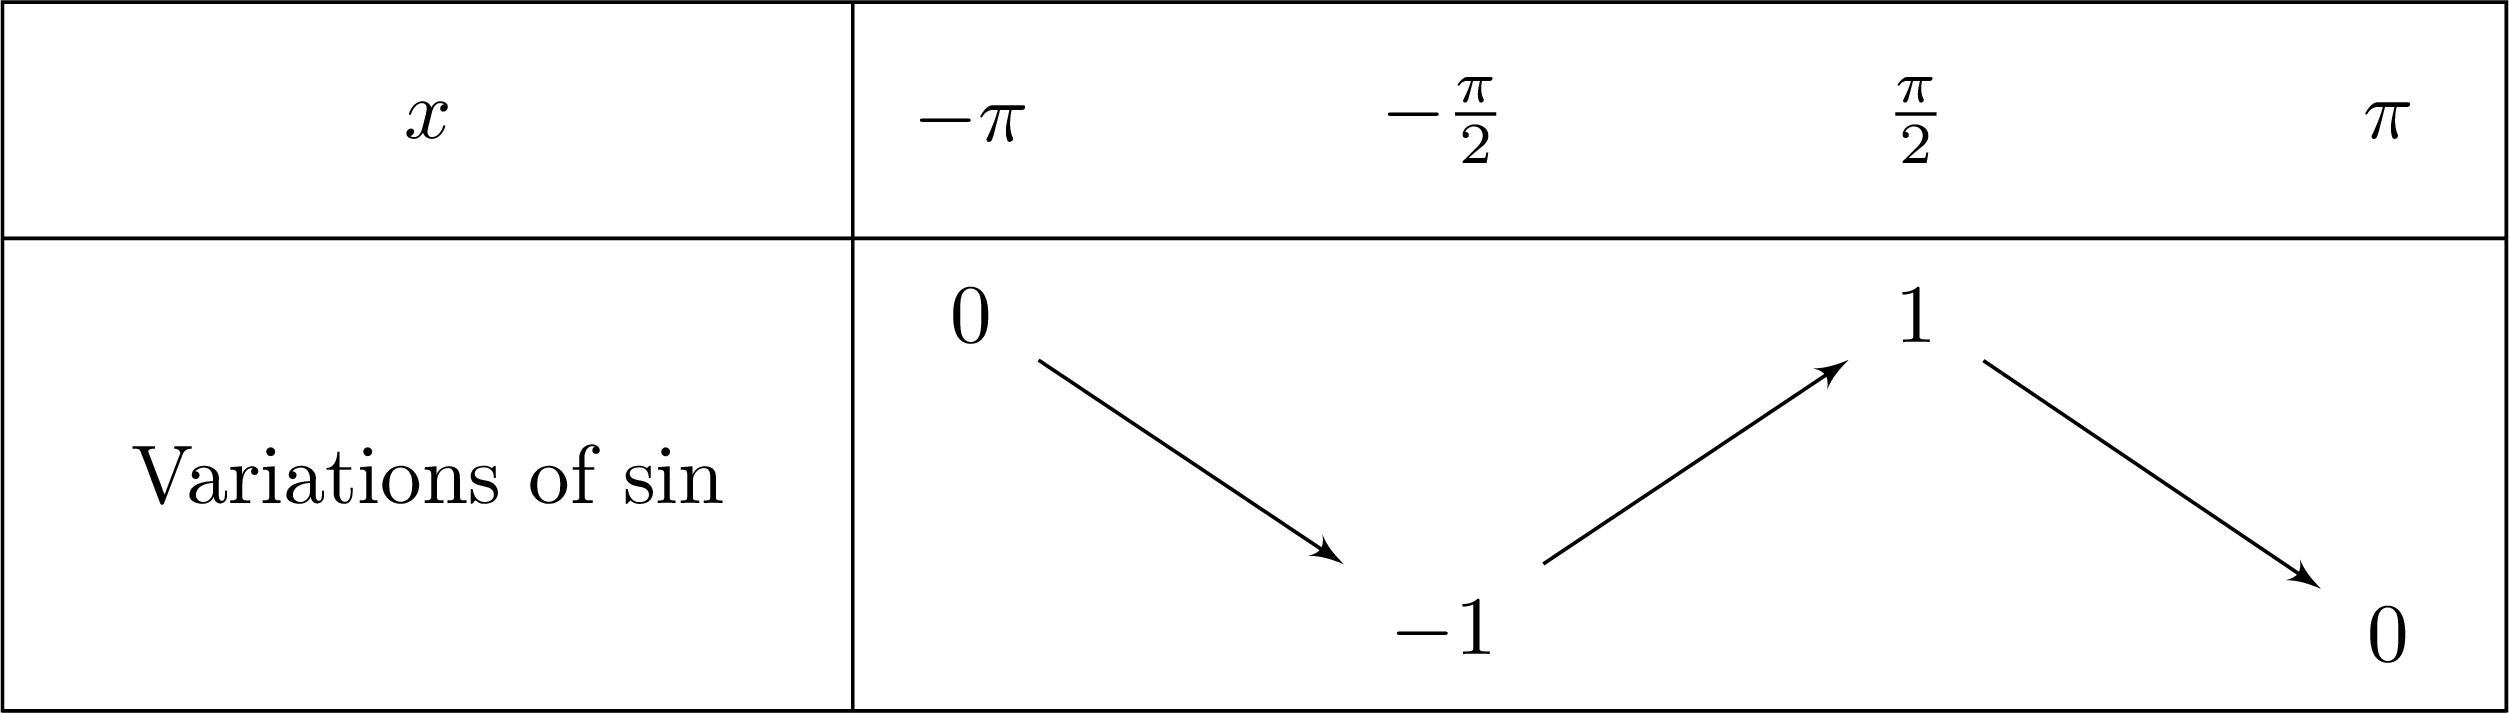
Read on the trigonometric circle, where the image \(M(x)\) has coordinates \((\cos x, \sin x)\).
- When \(x\) goes from \(0\) to \(\pi\), \(M(x)\) travels the upper half-circle from \((1, 0)\) to \((-1, 0)\): its \(x\)-coordinate \(\cos x\) goes down from \(1\) to \(-1\). When \(x\) goes from \(-\pi\) to \(0\), \(M(x)\) travels the lower half-circle from \((-1, 0)\) to \((1, 0)\): \(\cos x\) goes up from \(-1\) to \(1\).
- When \(x\) goes from \(-\dfrac{\pi}{2}\) to \(\dfrac{\pi}{2}\), \(M(x)\) travels the right half-circle from \((0, -1)\) to \((0, 1)\): its \(y\)-coordinate \(\sin x\) goes up from \(-1\) to \(1\). From \(\dfrac{\pi}{2}\) to \(\pi\), \(M(x)\) goes from \((0, 1)\) to \((-1, 0)\) and \(\sin x\) goes down from \(1\) to \(0\); from \(-\pi\) to \(-\dfrac{\pi}{2}\), it goes from \((-1, 0)\) to \((0, -1)\) and \(\sin x\) goes down from \(0\) to \(-1\).
Proposition — Symmetries of the Cosine and Sine Curves
For every real number \(x\), the associated angles give: - \(\sin(\pi - x) = \sin x\): the sine curve is symmetric about the vertical line \(x = \dfrac{\pi}{2}\);
- \(\sin(\pi + x) = -\sin x\) and \(\sin(\pi - x) = \sin x\): the sine curve is symmetric about the point \((\pi, 0)\);
- \(\cos(\pi - x) = -\cos x\): the cosine curve is symmetric about the point \(\left(\dfrac{\pi}{2}, 0\right)\);
- \(\cos\left(x - \dfrac{\pi}{2}\right) = \sin x\): the sine curve is the cosine curve translated by \(\dfrac{\pi}{2}\) to the right.
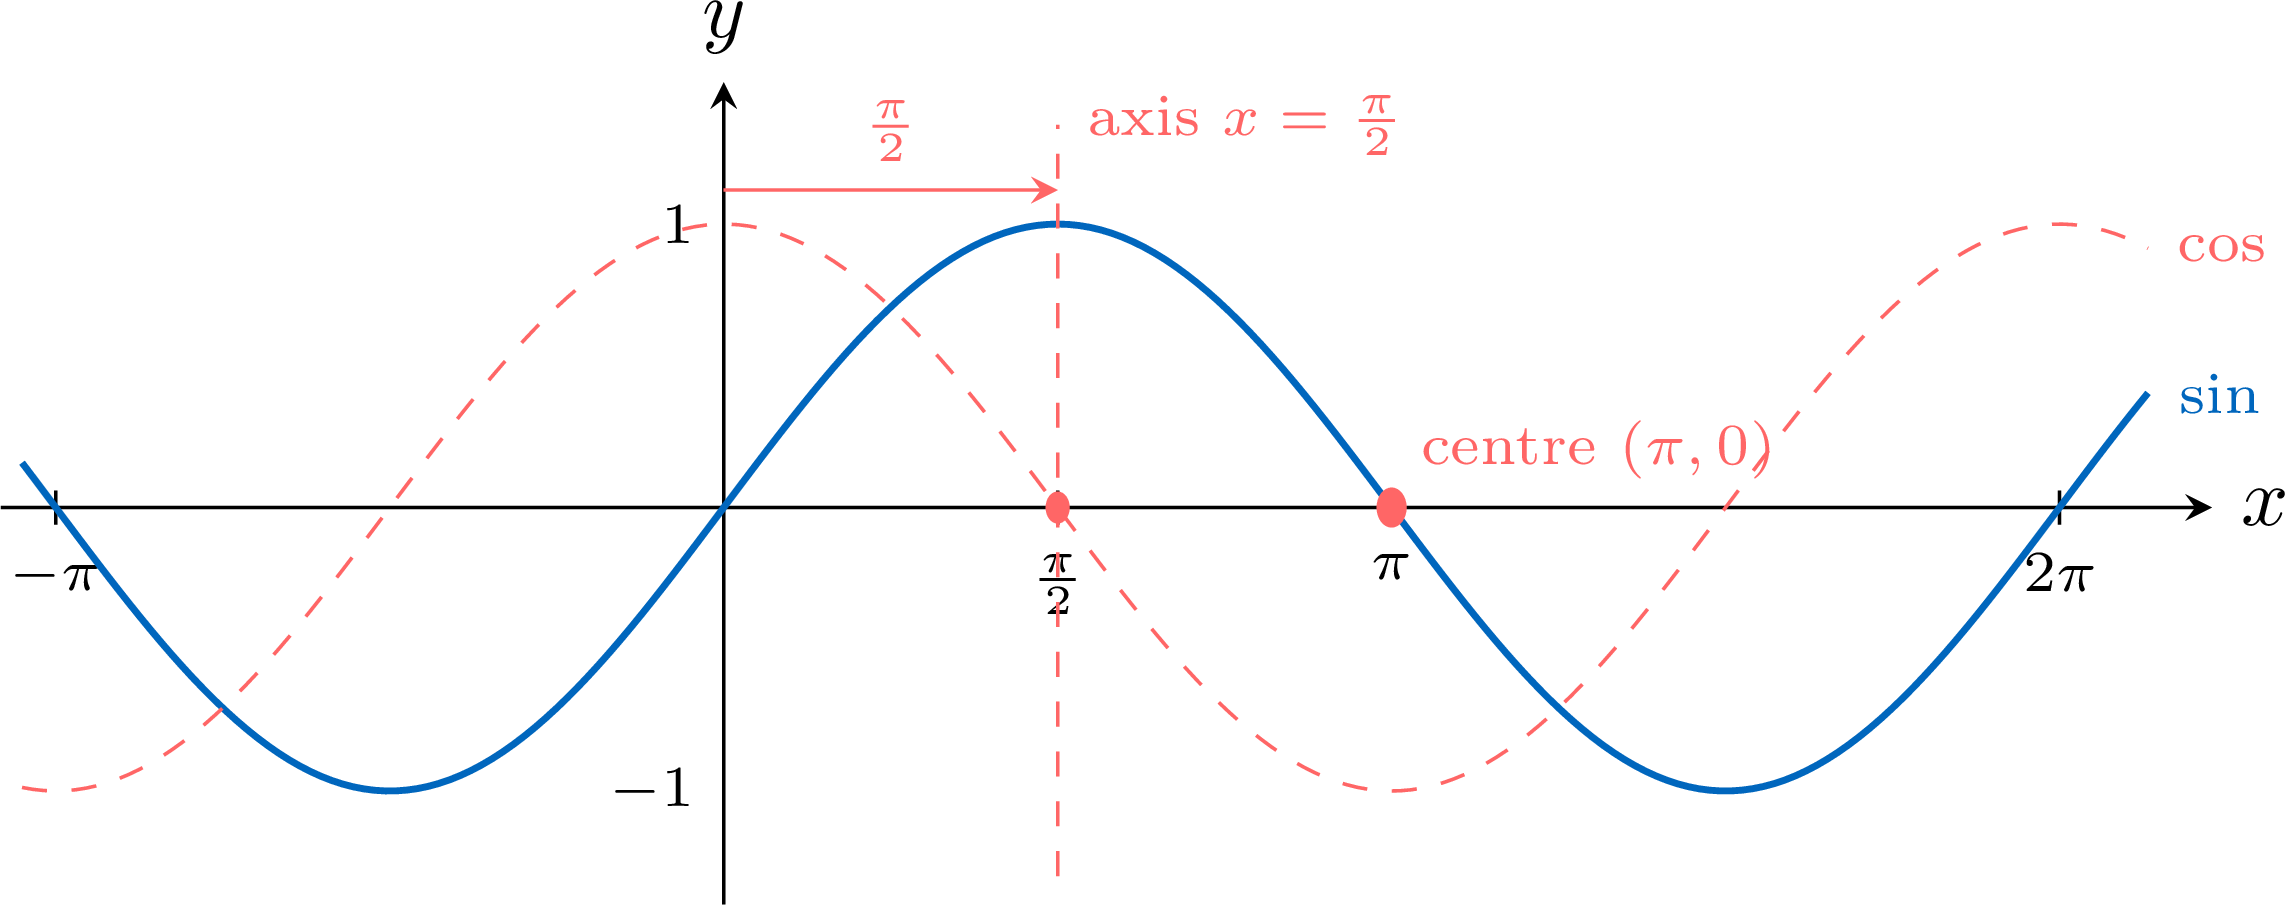
The relations come from the trigonometric circle: the images of \(x\) and \(\pi - x\) are symmetric about the vertical axis (same \(y\)-coordinate, opposite \(x\)-coordinates), so \(\sin(\pi - x) = \sin x\) and \(\cos(\pi - x) = -\cos x\); the images of \(x\) and \(\pi + x\) are symmetric about the centre (half-turn), so \(\sin(\pi + x) = -\sin x\); the images of \(x\) and \(\dfrac{\pi}{2} - x\) are symmetric about the line \(y = x\), which swaps the two coordinates, so \(\cos\left(\dfrac{\pi}{2} - x\right) = \sin x\). Two points \((a, b)\) and \((a', b')\) are symmetric about the vertical line \(x = m\) when \(b' = b\) and \(\dfrac{a + a'}{2} = m\), and about the point \((m, 0)\) when \(b' = -b\) and \(\dfrac{a + a'}{2} = m\).
- The points \((x, \sin x)\) and \((\pi - x, \sin(\pi - x)) = (\pi - x, \sin x)\) of the sine curve have the same \(y\)-coordinate, and \(\dfrac{x + (\pi - x)}{2} = \dfrac{\pi}{2}\).
- The points \((\pi - x, \sin(\pi - x)) = (\pi - x, \sin x)\) and \((\pi + x, \sin(\pi + x)) = (\pi + x, -\sin x)\) have opposite \(y\)-coordinates, and \(\dfrac{(\pi - x) + (\pi + x)}{2} = \pi\).
- The points \((x, \cos x)\) and \((\pi - x, \cos(\pi - x)) = (\pi - x, -\cos x)\) have opposite \(y\)-coordinates, and \(\dfrac{x + (\pi - x)}{2} = \dfrac{\pi}{2}\).
- The point \((x, \sin x) = \left(x, \cos\left(x - \frac{\pi}{2}\right)\right)\) of the sine curve is the point \(\left(x - \frac{\pi}{2}, \cos\left(x - \frac{\pi}{2}\right)\right)\) of the cosine curve moved \(\dfrac{\pi}{2}\) to the right; and \(\cos\left(x - \frac{\pi}{2}\right) = \cos\left(\frac{\pi}{2} - x\right) = \sin x\), since cosine is even.
Example
Without a calculator, compare: - \(\cos 1\) and \(\cos 2\);
- \(\sin 0.5\) and \(\sin 1\);
- \(\sin 1\) and \(\sin 2\).
- \(1\) and \(2\) lie in \(\left[0, \pi\right]\), where cosine is decreasing, and \(1 \lt 2\): so \(\cos 1 \gt \cos 2\).
- \(0.5\) and \(1\) lie in \(\left[-\frac{\pi}{2}, \frac{\pi}{2}\right]\) (as \(\frac{\pi}{2} \approx 1.57\)), where sine is increasing, and \(0.5 \lt 1\): so \(\sin 0.5 \lt \sin 1\).
- \(2 \gt \frac{\pi}{2}\), so \(1\) and \(2\) are not in the same interval of variation. The symmetry about \(x = \frac{\pi}{2}\) brings \(2\) back: \(\sin 2 = \sin(\pi - 2)\), with \(\pi - 2 \gt 1\) since \(\pi \gt 3\), and \(\pi - 2 \lt \frac{\pi}{2}\) since \(\pi \lt 4\). Now \(1\) and \(\pi - 2\) lie in \(\left[-\frac{\pi}{2}, \frac{\pi}{2}\right]\) and \(1 \lt \pi - 2\): so \(\sin 1 \lt \sin(\pi - 2) = \sin 2\).
Skills to practice
- Using the Variations and Symmetries of the Curves
III
General Sine and Cosine Functions
III.1
The Functions \(y = a\sin\big(b(x - c)\big) + d\)
Recappreviously studied — click to reread
Now that we are familiar with the graphs of \(y = \sin x\) and \(y = \cos x\), we can use transformations to graph more complicated trigonometric functions.
Definition — General Sine and Cosine Function
For functions of the form \(y = a\sin(b(x-c)) + d\) and \(y = a\cos(b(x-c)) + d\), with \(a \neq 0\) and \(b \neq 0\): - \(|a|\) is the amplitude.
- \(\frac{2\pi}{|b|}\) is the period (\(x\) in radians; with \(x\) in degrees, the period is \(\frac{360^\circ}{|b|}\)).
- \(c\) is the phase shift (horizontal translation).
- \(d\) is the vertical shift (the principal axis is \(y=d\)).
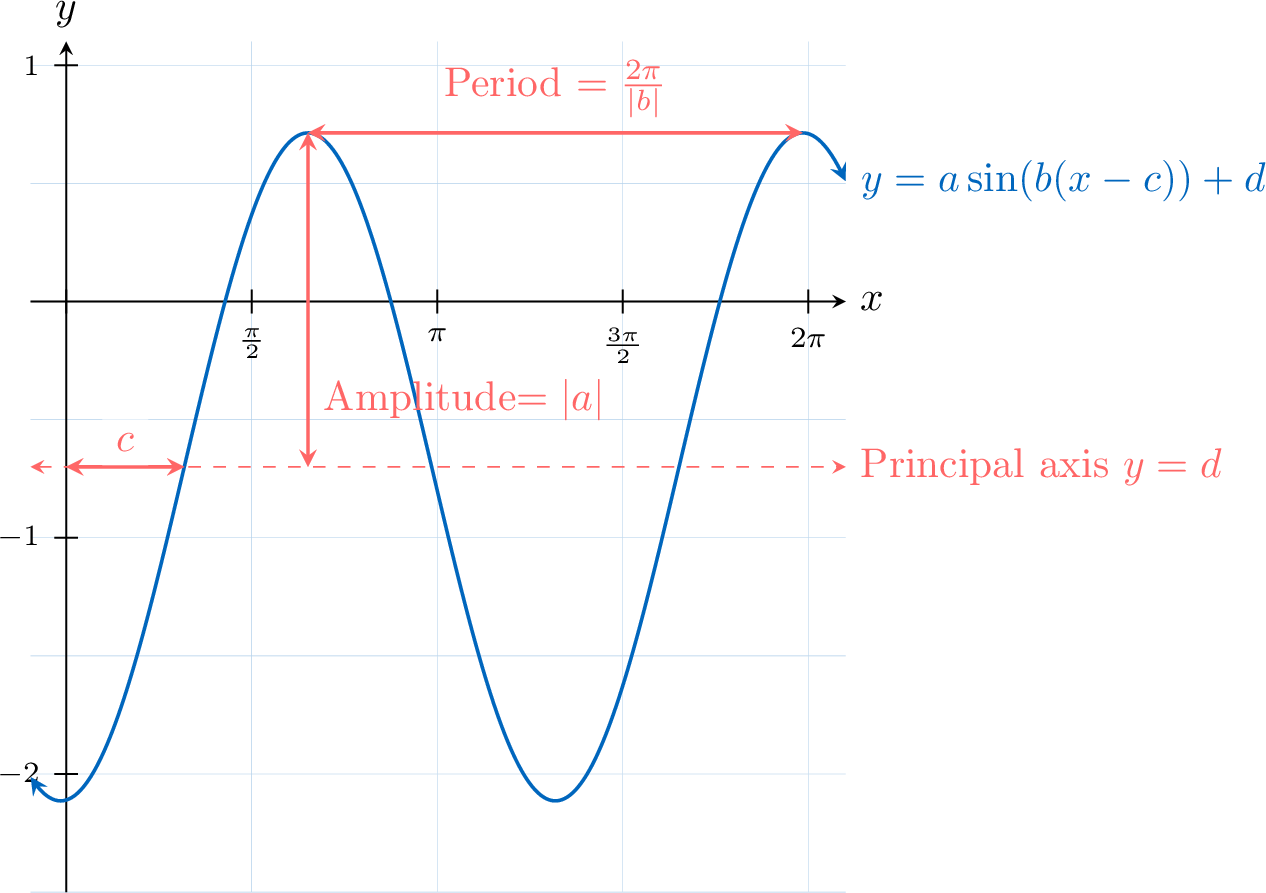
Proposition — Transformations of Trigonometric Functions
For real parameters \(a,b,c,d\) with \(b\neq 0\), the graph of \(y = a\sin\!\big(b(x-c)\big) + d\) is obtained from the graph of \(y=\sin x\) by: - a vertical stretch by factor \(|a|\); if \(a<0\), there is also a reflection in the \(x\)-axis,
- a horizontal stretch by factor \(\dfrac{1}{|b|}\); if \(b<0\), there is also a reflection in the \(y\)-axis,
- a horizontal translation by \(c\) units (to the right if \(c>0\), left if \(c<0\)) and a vertical translation by \(d\) units (up if \(d>0\), down if \(d<0\)).
Example
Sketch the graph of \(y=\sqrt{2} \sin x-1\) for \(0 \leq x \leq 2 \pi\). - The graph of \(y=\sqrt{2} \sin x\) is the vertical stretch of the graph of \(y=\sin x\) with scale factor \(\sqrt{2}\).
- The graph of \(y=\sqrt{2} \sin x-1\) is the vertical translation of the graph of \(y=\sqrt{2}\sin x\) by \(-1\).
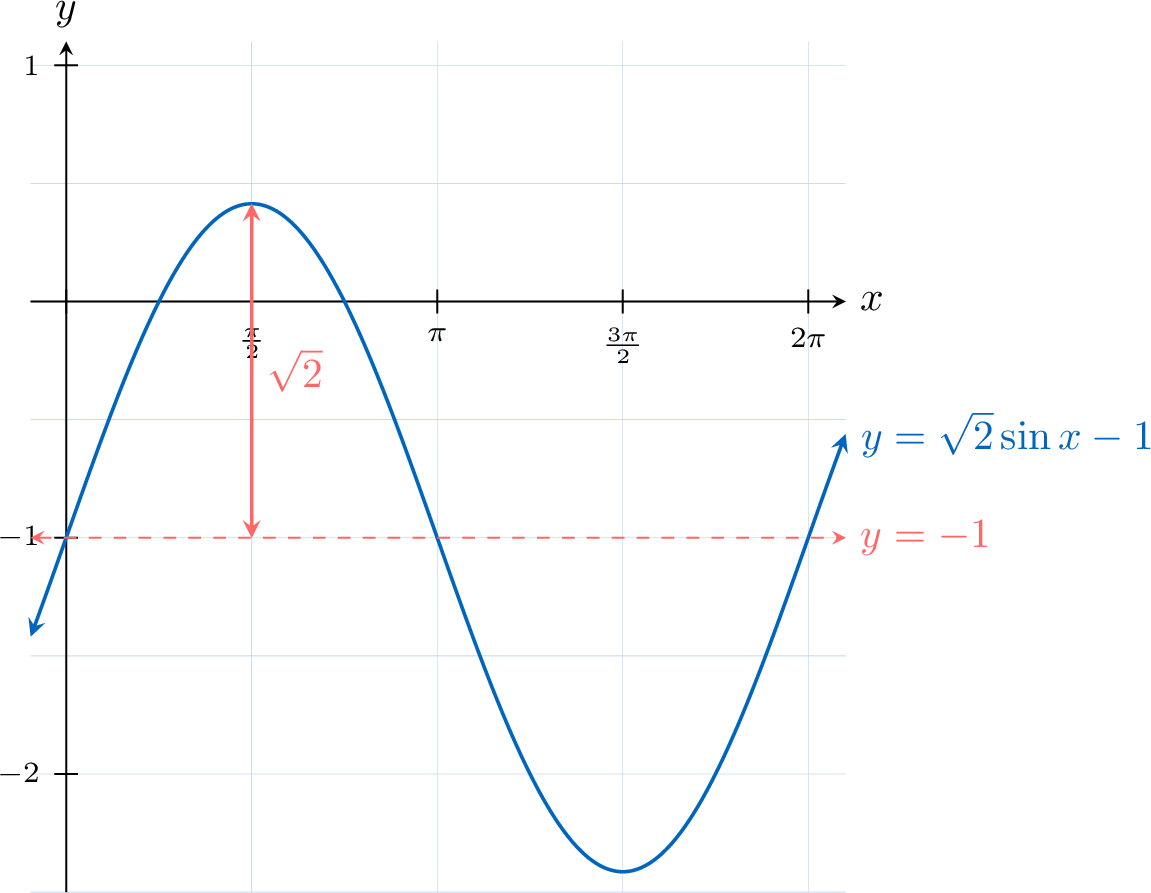
Skills to practice
- Finding the Equation from a Graph
- Identifying Properties from an Equation
IV
Modelling Periodic Behaviour
IV.1
Sinusoidal Models
Common real-world examples of sinusoidal models include phenomena that oscillate (fluctuate periodically):
- \(D(t)\) is the depth of water at a shore \(t\) hours after midnight
- \(T(d)\) is the temperature of a city \(d\) days after January 1st
- \(H(t)\) is the vertical height above ground of a person \(t\) seconds after entering a Ferris wheel
Definition — Sine and Cosine Models
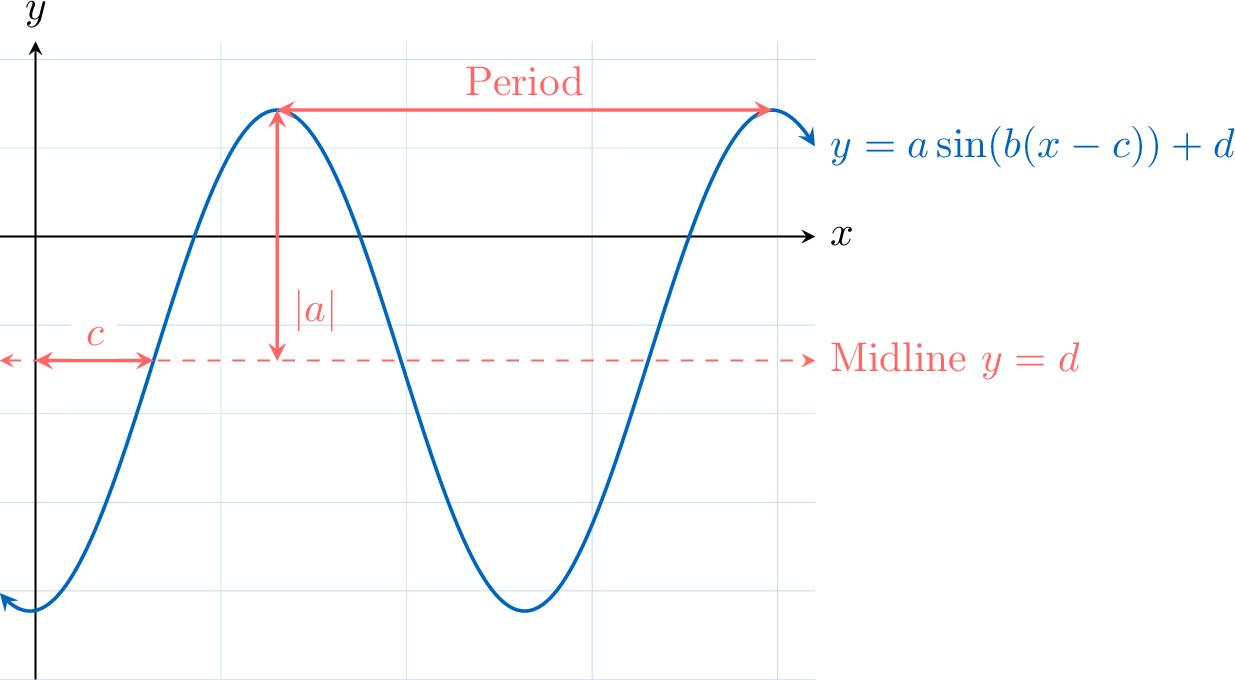
An Sine/Cosine Model is a function of the form $$y = a\sin(b(x-c)) + d\text{ or }y = a\cos(b(x-c)) + d$$ - \(|a|\) is the amplitude.
- \(\frac{2\pi}{|b|}\) (or \(\frac{360}{|b|}\)) is the period.
- \(c\) is the phase shift (horizontal translation).
- \(d\) is the vertical shift (the midline is \(y=d\)).
Example
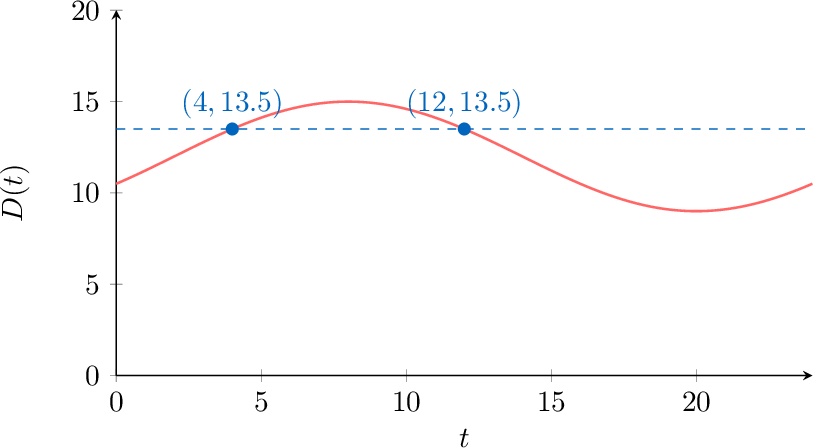
The water depth, \(D\), in metres, at a port can be modelled by the function$$ D(t) = 3 \sin\left( \frac{\pi}{12} (t - 2) \right) + 12, \quad 0 \leq t < 24 $$ where \(t\) is the elapsed time, in hours, since midnight. - Write down the depth of the water at midnight.
- Find the minimum water depth and the time it occurs.
- Calculate how long the water depth is at least 13.5 metres each day.
- At midnight (\(t=0\)): $$ D(0) = 3 \sin\left( \frac{\pi}{12} (0 - 2) \right) + 12 = 3 \sin\!\left(-\frac{\pi}{6}\right) + 12. $$ $$ D(0) = 3(-0.5) + 12 = 10.5 \text{ metres}. $$
- Minimum depth: The sine function ranges from \(-1\) to \(1\), so the minimum occurs when \(\sin(\dots)=-1\): $$ D_{\min} = 3(-1) + 12 = 9 \text{ metres}. $$ This occurs when the argument equals \(-\frac{\pi}{2} + 2\pi k\). In the interval \(0\le t<24\), we may use \(\frac{3\pi}{2}\): $$ \frac{\pi}{12}(t-2) = \frac{3\pi}{2} \implies t-2 = 18 \implies t = 20 \text{ hours (8 PM)}. $$
- Depth \(\ge 13.5\): $$ 3 \sin\left( \frac{\pi}{12} (t - 2) \right) + 12 \ge 13.5 \iff \sin\left( \frac{\pi}{12} (t - 2) \right) \ge 0.5. $$ The equality \(\sin\theta=0.5\) occurs at \(\theta=\frac{\pi}{6}\) and \(\theta=\frac{5\pi}{6}\) (within one period).
- \(\frac{\pi}{12}(t-2) = \frac{\pi}{6} \implies t-2 = 2 \implies t=4\).
- \(\frac{\pi}{12}(t-2) = \frac{5\pi}{6} \implies t-2 = 10 \implies t=12\).
Skills to practice
- Using Sinusoidal Models with Technology
IV.2
Fitting a Sine Model to Data
Method — Modelling Periodic Data with a Sine Function
To find a sinusoidal model of the form \(y = a\sin(b(x-c)) + d\) that fits a set of periodic data: - Find the vertical shift, \(d\): Calculate the principal axis, which is the average of the maximum and minimum values. $$d = \frac{\text{max value} + \text{min value}}{2}$$
- Find the amplitude, \(a\): Calculate half the distance between the maximum and minimum values. $$a = \frac{\text{max value} - \text{min value}}{2}$$
- Find the period and the parameter \(b\): Determine the period, \(P\), which is the length of one full cycle of the data. Use the formula \(P = \frac{2\pi}{b}\) to solve for \(b\). $$b = \frac{2\pi}{P}$$
- Find the phase shift, \(c\): Substitute a data point \((x,y)\) into the equation \(y = a\sin(b(x-c))+d\) and solve for the horizontal shift \(c\). It is often easiest to choose a point where the function crosses its principal axis, as this corresponds to a point where the sine function is zero.
Sine Regression on a Calculator
A graphing calculator can also fit a sine model to a set of data by sine regression, in radian mode. It returns the model in the form \(y = a\sin(bx + k) + d\). The constant written \(k\) here is the one most calculators call \(c\), and it is not the horizontal translation \(c\) of \(y = a\sin\big(b(x - c)\big) + d\). To go from one form to the other, factorise by \(b\) inside the sine: $$a\sin(bx + k) + d = a\sin\left(b\left(x + \frac{k}{b}\right)\right) + d, \qquad \text{so} \qquad c = -\frac{k}{b}.$$ For instance, a regression that returns \(y = 6.5\sin(0.524x - 5.24) + 21.5\) gives \(c = -\dfrac{-5.24}{0.524} = 10\): the model is \(y = 6.5\sin\big(0.524(x - 10)\big) + 21.5\), with \(b \approx 0.524 \approx \dfrac{\pi}{6}\), a period of about \(12\). The values displayed are rounded, and a calculator may return another form of the same curve — a value of \(k\) that differs by a multiple of \(2\pi\), or the opposite of \(a\) with \(\pi\) added to \(k\), since \(a\sin\theta = -a\sin(\theta + \pi)\). The model is read from the values, whatever the form.
Example
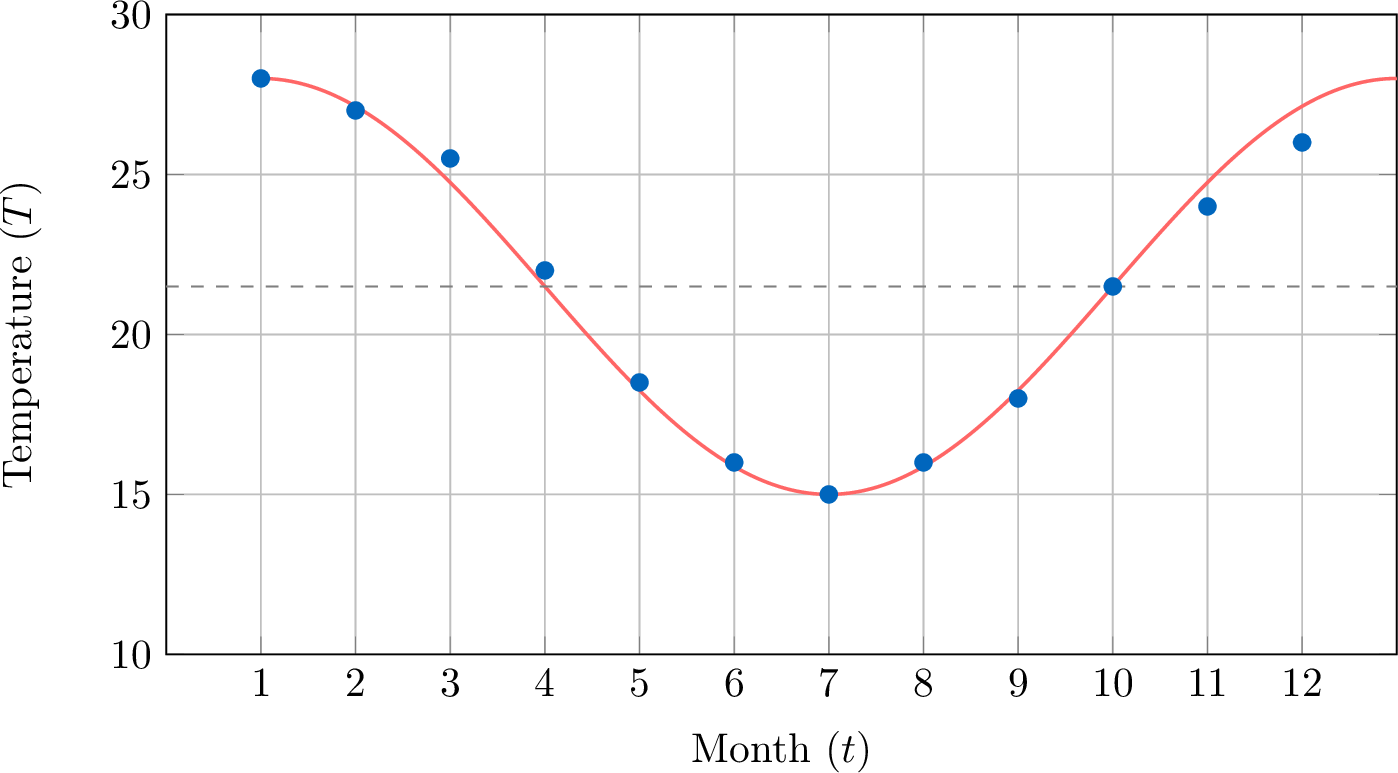
The mean monthly maximum temperatures for Cape Town, South Africa are shown below: | Month (\(t\)) | 1 | 2 | 3 | 4 | 5 | 6 | 7 | 8 | 9 | 10 | 11 | 12 |
| Temp (\(T\)) | 28 | 27 | 25.5 | 22 | 18.5 | 16 | 15 | 16 | 18 | 21.5 | 24 | 26 |
- Find Vertical Shift (\(d\)): The max value is 28 and the min value is 15. $$ d = \frac{28+15}{2} = \frac{43}{2} = 21.5 $$
- Find Amplitude (\(a\)): $$ a = \frac{28-15}{2} = \frac{13}{2} = 6.5 $$
- Find Period (\(b\)): The data repeats every 12 months, so the period \(P=12\). $$ b = \frac{2\pi}{P} = \frac{2\pi}{12} = \frac{\pi}{6} $$
- Find Phase Shift (\(c\)): Our model so far is \(T = 6.5\sin(\frac{\pi}{6}(t-c)) + 21.5\). A standard sine function starts at its principal axis and goes up. From the data, the temperature is 21.5 (the principal axis value) at \(t=10\) and is increasing. We can therefore choose the phase shift to be \(c=10\).
- Final Model: $$ T(t) = 6.5\sin\left(\frac{\pi}{6}(t-10)\right) + 21.5 $$
Skills to practice
- Building and Using Sinusoidal Models
V
The Tangent Function
V.1
The General Tangent Function
Proposition — Graph of the Tangent Function
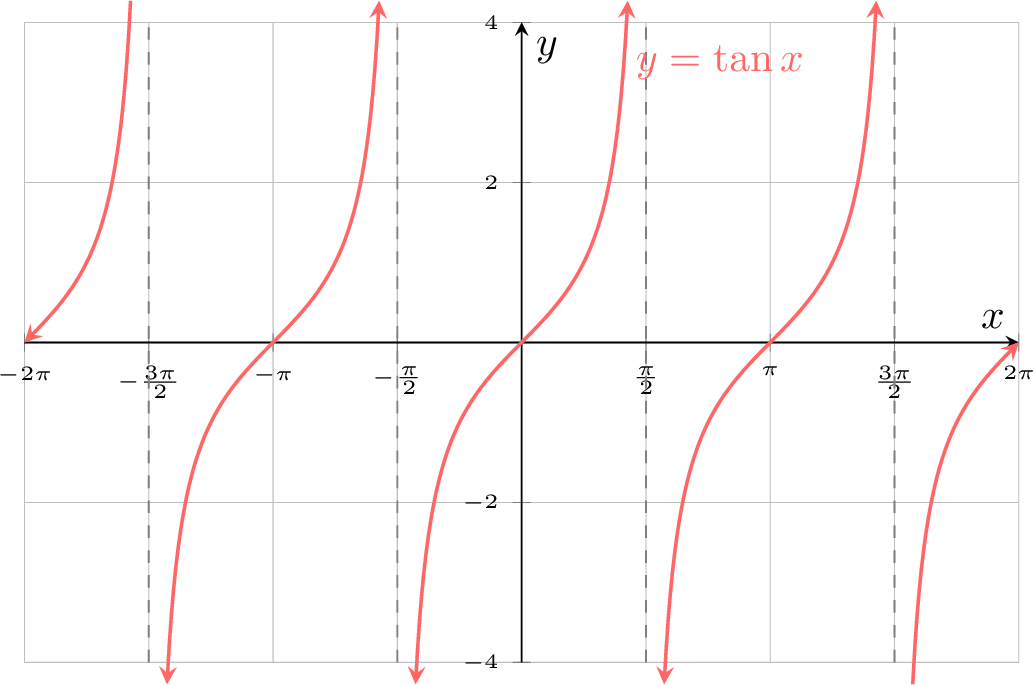
The graph of \(y = \tan(x) = \frac{\sin x}{\cos x}\) has: - Domain: \(\{x \in \mathbb{R} \mid x \neq \frac{\pi}{2} + k\pi,\forall k\in\mathbb{Z}\}\) (all real numbers \(x\) except those for which \(\cos x = 0\))
- Period: \(\pi\).
- Vertical Asymptotes: at \(x = \frac{\pi}{2} + k\pi\) for any integer \(k\).
- Range: \(\mathbb{R}\).
Proposition — General Tangent Function
Let \(a\), \(b\), \(c\) and \(d\) be real numbers, with \(a \neq 0\) and \(b \neq 0\), and let \(f(x) = a\tan\big(b(x - c)\big) + d\). The function \(f\): - has period \(\dfrac{\pi}{|b|}\);
- has the vertical asymptotes \(x = c + \dfrac{1}{b}\left(\dfrac{\pi}{2} + k\pi\right)\), for every integer \(k\): the values of \(x\) for which \(\cos\big(b(x - c)\big) = 0\);
- meets the line \(y = d\) at \(x = c + \dfrac{k\pi}{b}\), for every integer \(k\), halfway between two consecutive asymptotes: this line through the centres of the branches is called its principal axis;
- has no amplitude: its range is \(\mathbb{R}\).
Write \(u = b(x - c)\), so that \(f(x) = a\tan u + d\). The tangent function has period \(\pi\), vertical asymptotes \(u = \dfrac{\pi}{2} + k\pi\) and range \(\mathbb{R}\) (Proposition “Graph of the Tangent Function”); moreover \(\tan u = 0\) exactly when \(\sin u = 0\), that is when \(u\) is a multiple of \(\pi\) (the points \((1, 0)\) and \((-1, 0)\) of the unit circle).
- Period. Since \(b \times \dfrac{\pi}{|b|}\) equals \(\pi\) or \(-\pi\), for every \(x\) where \(f\) is defined, $$\begin{aligned}[t] f\left(x + \frac{\pi}{|b|}\right) &= a\tan\big(b(x - c) \pm \pi\big) + d && \text{(expand)}\\ &= a\tan\big(b(x - c)\big) + d && \text{(period } \pi \text{ of } \tan\text{)}\\ &= f(x). \end{aligned}$$ No smaller positive number works: if \(p > 0\) and \(f(x + p) = f(x)\) for every \(x\), then at \(x = c\), \(a\tan(bp) + d = a\tan 0 + d = d\), so \(\tan(bp) = 0\) since \(a \neq 0\). Hence \(bp\) is a multiple of \(\pi\), nonzero since \(bp \neq 0\), and \(|b|p \geq \pi\), that is \(p \geq \dfrac{\pi}{|b|}\).
- Asymptotes. \(f(x)\) is defined exactly when \(\cos u \neq 0\). Solving \(b(x - c) = \dfrac{\pi}{2} + k\pi\) for \(x\) gives \(x = c + \dfrac{1}{b}\left(\dfrac{\pi}{2} + k\pi\right)\). As \(x\) approaches one of these values, \(\tan u\) takes arbitrarily large values in absolute value, and so does \(f(x)\), since \(a \neq 0\).
- Principal axis. $$\begin{aligned}[t] f(x) = d &\iff a\tan u = 0 && \text{(subtract } d\text{)}\\ &\iff \tan u = 0 && (a \neq 0)\\ &\iff u = k\pi && (k \text{ an integer})\\ &\iff x = c + \frac{k\pi}{b}. && \text{(divide by } b\text{, add } c\text{)} \end{aligned}$$ Two consecutive asymptotes correspond to \(u = \dfrac{\pi}{2} + k\pi\) and \(u = \dfrac{\pi}{2} + (k + 1)\pi\); halfway between them, \(u = (k + 1)\pi\), one of the values found.
- Range. For every real number \(y\), the number \(\dfrac{y - d}{a}\) is a value of the tangent function, \(\tan u_0\) for some \(u_0\); then \(y = a\tan u_0 + d\) is a value of \(f\).
Example
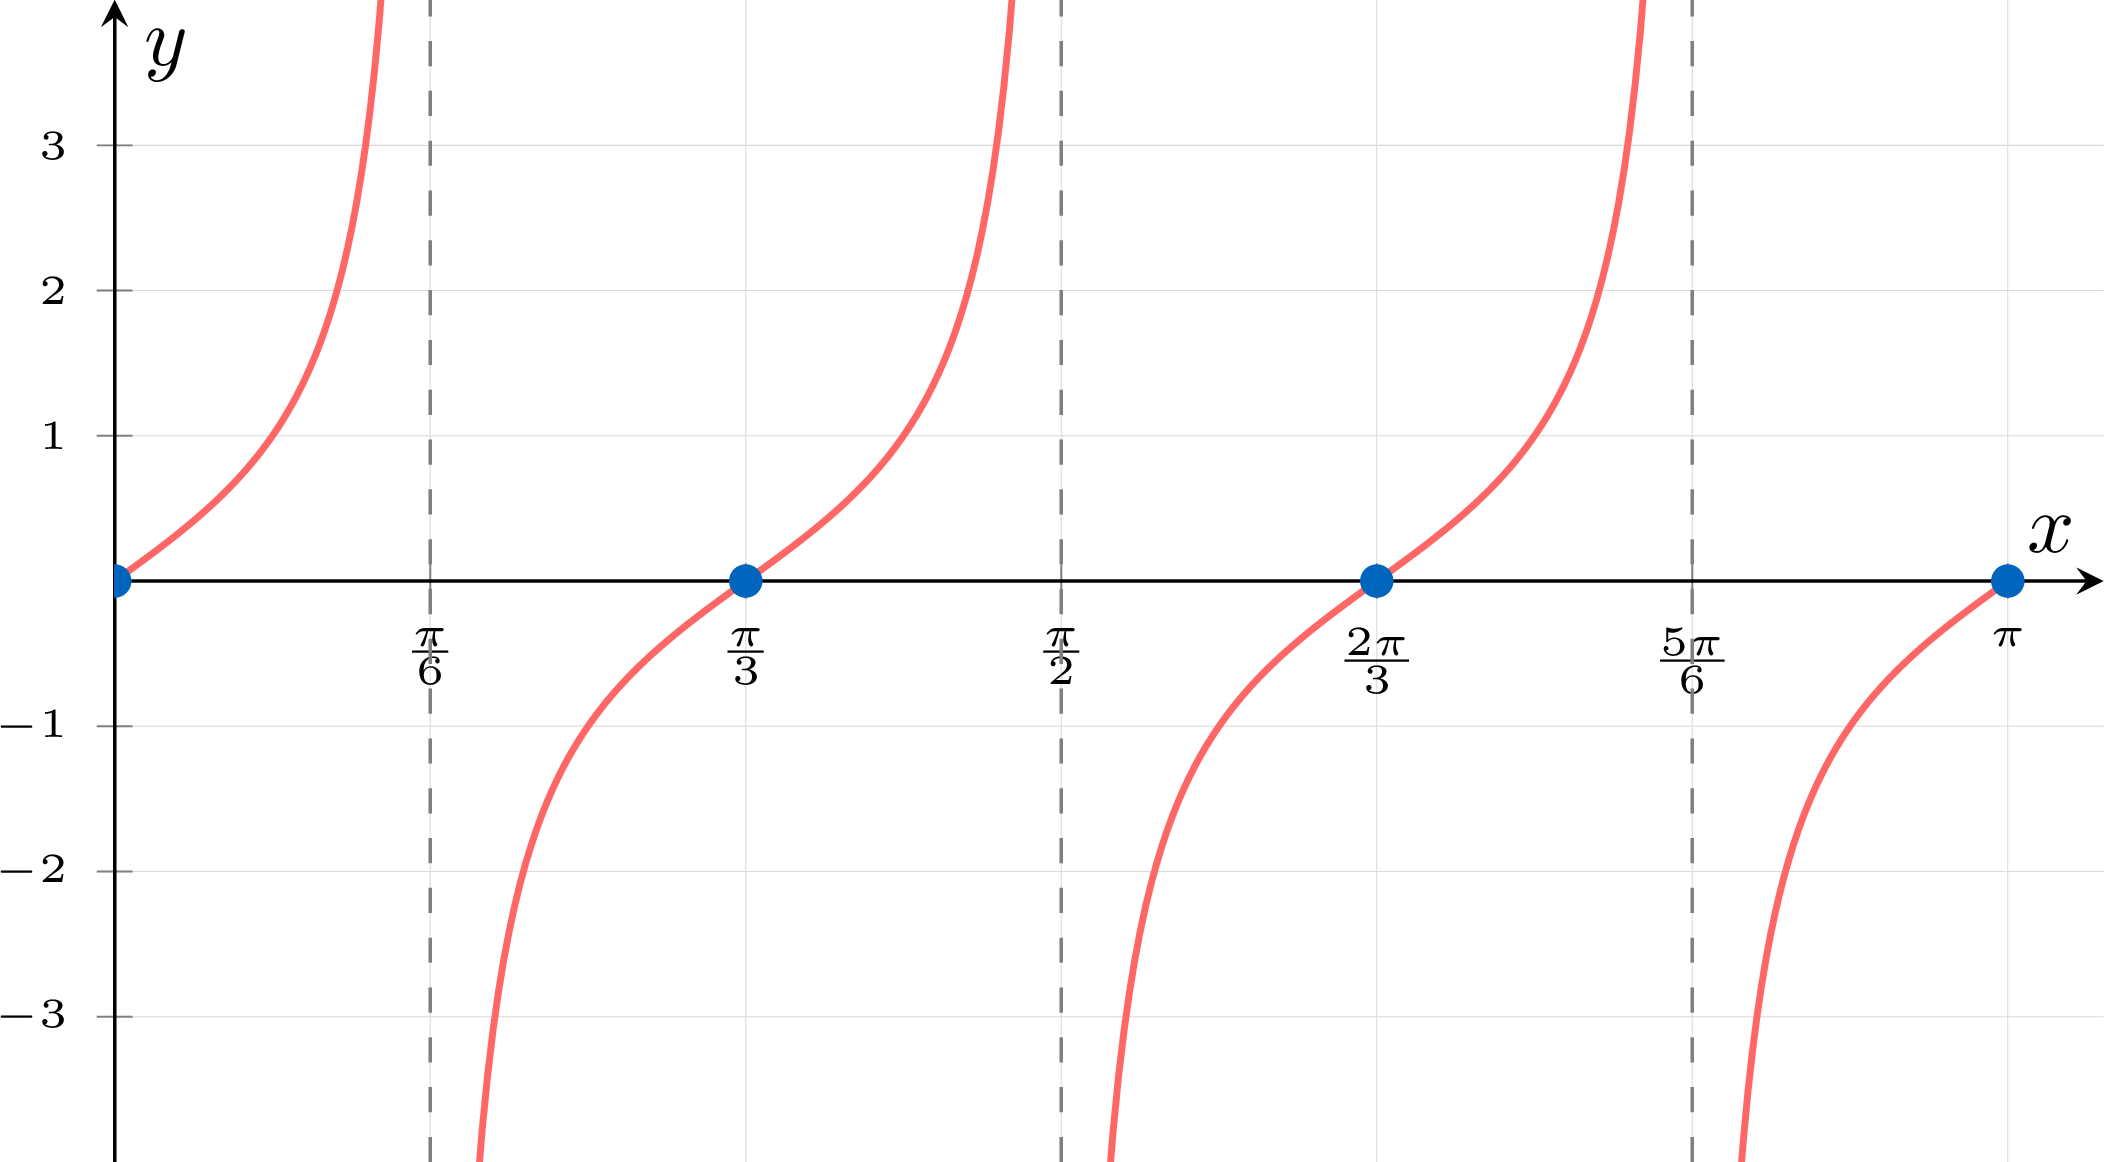
- For \(y = \tan(3x)\), state the period, then find the vertical asymptotes and the points where the graph meets its principal axis for \(0 \le x \le \pi\). Sketch the graph for \(0 \le x \le \pi\).
- For \(y = 2\tan\left(x - \dfrac{\pi}{4}\right) + 1\), state the period and the principal axis, and write the equations of the vertical asymptotes.
- Here \(a = 1\), \(b = 3\), \(c = 0\) and \(d = 0\). The period is \(\dfrac{\pi}{|b|} = \dfrac{\pi}{3}\). The asymptotes are the values of \(x\) for which \(\cos(3x) = 0\): $$\begin{aligned}[t] 3x = \frac{\pi}{2} + k\pi &\iff x = \frac{\pi}{6} + \frac{k\pi}{3}. && \text{(divide by } 3\text{)} \end{aligned}$$ For \(0 \le x \le \pi\), the values \(k = 0\), \(1\), \(2\) give the asymptotes \(x = \dfrac{\pi}{6}\), \(x = \dfrac{\pi}{2}\) and \(x = \dfrac{5\pi}{6}\). The principal axis is \(y = 0\), met at \(x = \dfrac{k\pi}{3}\): at \(x = 0\), \(\dfrac{\pi}{3}\), \(\dfrac{2\pi}{3}\) and \(\pi\), halfway between the asymptotes. Since \(a > 0\), each branch increases.
- Here \(a = 2\), \(b = 1\), \(c = \dfrac{\pi}{4}\) and \(d = 1\). The period is \(\dfrac{\pi}{1} = \pi\) and the principal axis is \(y = 1\). The asymptotes: $$\begin{aligned}[t] x - \frac{\pi}{4} = \frac{\pi}{2} + k\pi &\iff x = \frac{3\pi}{4} + k\pi, && \text{(add } \tfrac{\pi}{4}\text{)} \end{aligned}$$ for every integer \(k\). The graph meets its principal axis \(y = 1\) at \(x = \dfrac{\pi}{4} + k\pi\).
Skills to practice
- Finding the Period and Asymptotes of a Tangent Function
- Sketching Tangent Functions
VI
Going further
Skills to practice
- Reasoning and Problem-Solving
- Solving Problems
- Quiz
Jump to section