International Baccalaureate · DP 2: Applications and Interpretation SL
Hypothesis Testing
I
The Logic of a Test
I.1
Null and Alternative Hypotheses
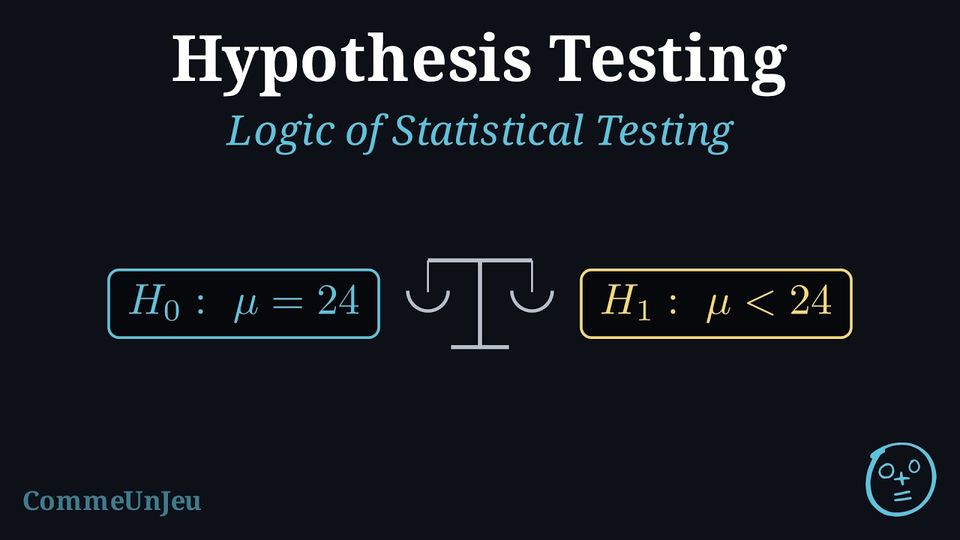
Statistical testing functions much like a court trial.
- The Assumption (Innocence): We start by assuming there is no effect or no difference until proven otherwise.
- The Evidence (Data): We collect data from a sample.
- The Verdict: If the evidence is strong enough (beyond reasonable doubt), we reject the initial assumption.
Definition — Null and Alternative Hypotheses
- The Null Hypothesis (\(H_0\)) represents the status quo, “no difference,” or “no effect.” For tests on a numerical parameter, it includes an equality (\(\mu = k\), \(\mu \leq k\), or \(\mu \geq k\)); for chi-squared tests, \(H_0\) states independence or a given distribution.
- The Alternative Hypothesis (\(H_1\)) is the claim we are trying to find evidence for. It uses strict inequalities (\(\mu \neq k\), \(\mu > k\), or \(\mu < k\)).
Example
A company claims that the average battery life of their new phone is 24 hours. A consumer group suspects the battery life is actually shorter. Write the null and alternative hypotheses.
Let \(\mu\) be the true mean battery life.
- \(H_0: \mu = 24\) (The company's claim is true; there is no difference).
- \(H_1: \mu < 24\) (The consumer group's suspicion; the mean is less than claimed).
Skills to practice
- Choosing the Hypotheses
- Formulating Null and Alternative Hypotheses
I.2
p-value and Significance Level
Definition — p-value and \(\alpha\)
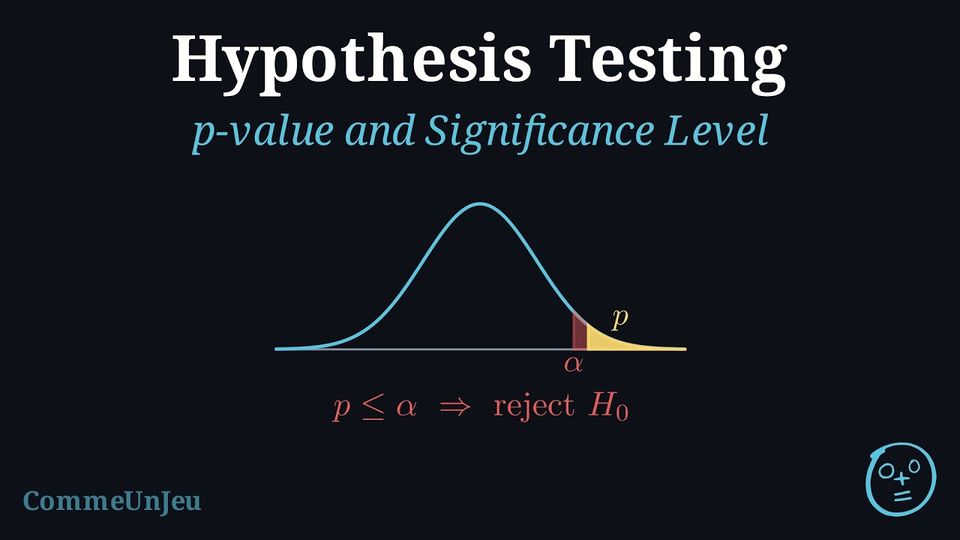
- The significance level (\(\alpha\)) is the threshold for evidence (usually \(0.05\), \(0.01\), or \(0.10\)). It is the maximum probability, accepted in advance, of rejecting \(H_0\) when it is actually true (a Type I error).
- The p-value is the probability of obtaining sample results at least as extreme as the ones observed, assuming \(H_0\) is true.
Decision Rule:
- If \(p\text{-value} \leq \alpha \implies\) Reject \(H_0\). (The result is statistically significant).
- If \(p\text{-value} > \alpha \implies\) Fail to reject \(H_0\). (Not enough evidence against \(H_0\)).
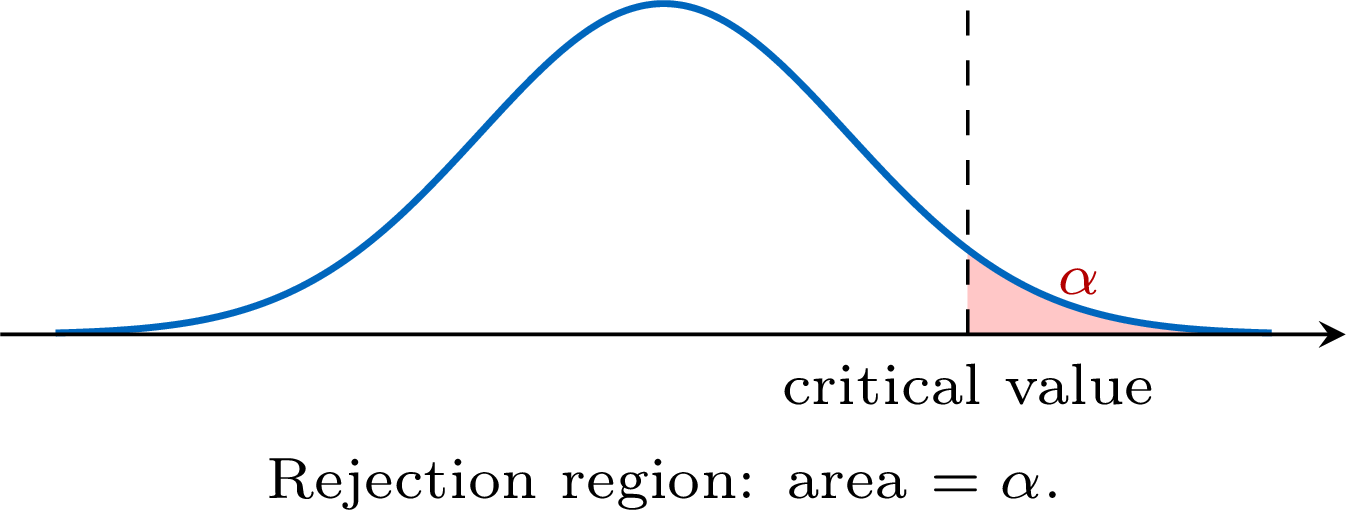
The decision rule has a clear visual meaning. If \(H_0\) is true, the test statistic follows a known distribution. The p-value is the area in the tail beyond the observed statistic — the probability of a result at least as extreme. The rejection region is the set of most-extreme values whose total area is exactly \(\alpha\). Rejecting \(H_0\) when the statistic lands in the rejection region is the same decision as rejecting when the p-value is at most \(\alpha\). 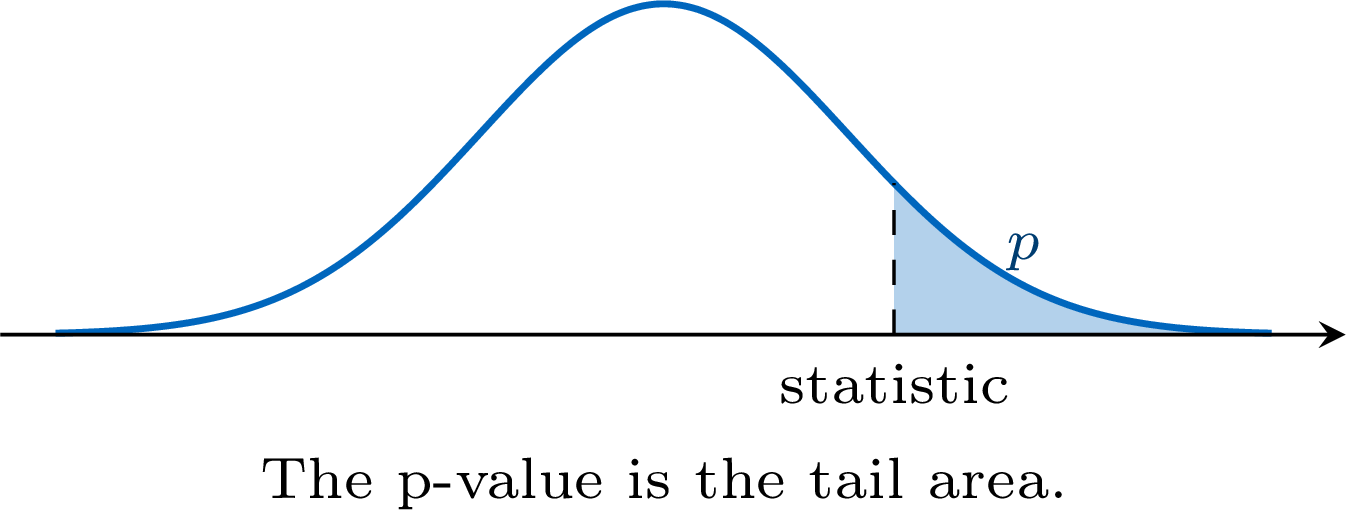 \hspace{0.4cm}
\hspace{0.4cm} Example
A researcher performs a hypothesis test to check if a new fertilizer increases plant growth.The calculated \(p\)-value is \(0.042\).
Make a conclusion for the following significance levels:
- \(\alpha = 0.05\) (\(5\pourcent\) significance level).
- \(\alpha = 0.01\) (\(1\pourcent\) significance level).
- For \(\alpha = 0.05\): $$ p\text{-value} = 0.042 < 0.05 $$ Since the \(p\)-value is smaller than \(\alpha\), the result is statistically significant at the 5\(\pourcent\) level. We reject the null hypothesis (\(H_0\)). There is sufficient evidence at the 5\(\pourcent\) significance level to support the claim.
- For \(\alpha = 0.01\): $$ p\text{-value} = 0.042 \geq 0.01 $$ Since the \(p\)-value is greater than \(\alpha\), the result is not statistically significant at this level. We fail to reject the null hypothesis (\(H_0\)). There is not enough evidence at the 1\(\pourcent\) significance level to support the claim.
Skills to practice
- Deciding from a p-value
- Interpreting the p-value
I.3
The Five Steps of a Test
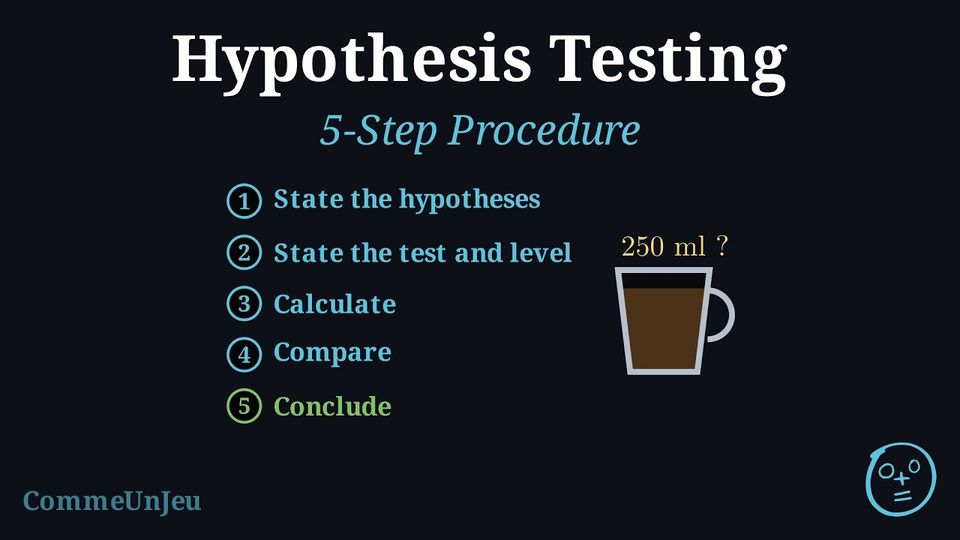
Method — Performing a Hypothesis Test
- State the Hypotheses: Define the parameter (e.g., \(\mu\)) and write \(H_0\) and \(H_1\).
- State the Test and Level: Identify the test (e.g., t-test) and the significance level \(\alpha\).
- Calculate Statistics: Use the GDC to find the test statistic and the p-value.
- Compare: Explicitly compare the p-value to \(\alpha\) (usually check whether \(p \leq \alpha\) or \(p > \alpha\)).
- Conclude: Write a conclusion in the context of the problem, referring to the original claim.
Example
(This example uses the one-sample t-test; the focus here is the five-step logic.)A coffee machine is supposed to dispense \(250\) ml per cup. A manager suspects it is dispensing less. He measures a sample of 10 cups and finds a mean of \(\bar{x} = 248\) ml with a standard deviation of \(s_{n-1} = 3\) ml.
Test the manager's suspicion at the \(5\pourcent\) significance level.
Let \(\mu\) be the population mean volume of coffee.
- \(H_0: \mu = 250\) and \(H_1: \mu < 250\).
- One-sample t-test at \(\alpha = 0.05\).
- Using GDC (T-Test with \(\mu_0=250, \bar{x}=248, s=3, n=10, <\mu_0\)):
\(t \approx -2.108\) and \(p\text{-value} \approx 0.032\). - Since \(0.032 < 0.05\), we reject \(H_0\).
- There is sufficient evidence to suggest the machine is dispensing less than 250 ml.
Skills to practice
- Identifying the Steps of a Hypothesis Test
II
The t-test
II.1
The One-Sample t-test
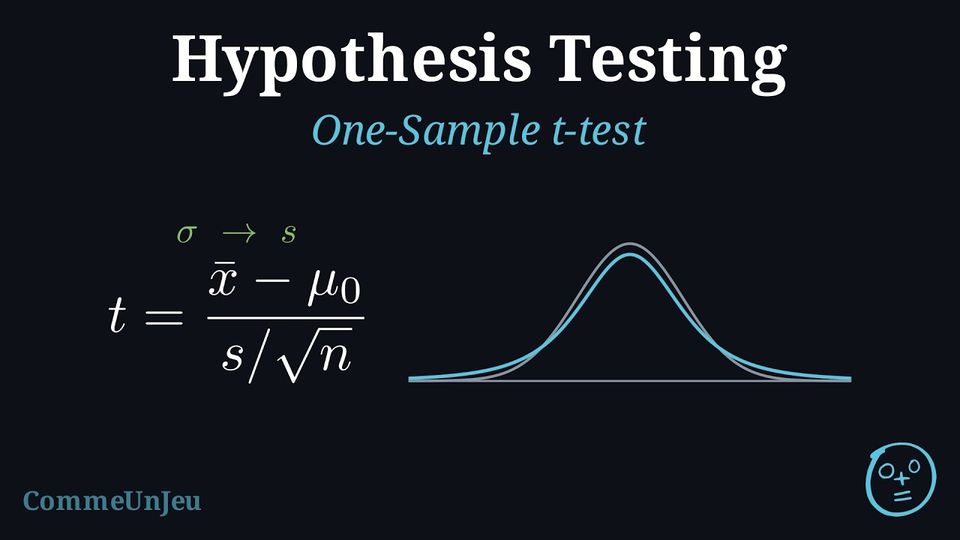
The t-test is one of the most commonly used statistical tests. It is used to determine if there is a significant difference between means, especially when the population variance is unknown and the sample size is small (\(n < 30\)).
Definition — One-Sample t-test Formula
The one-sample t-test compares the mean of a single sample (\(\bar{x}\)) to a known or hypothesized population mean (\(\mu_0\)).It is used when:
- The data come from a random sample of quantitative (continuous) values.
- The population follows a normal distribution (or the sample size is large, commonly \(n \geq 30\), so that the distribution of \(\bar{x}\) is approximately normal).
- The population standard deviation \(\sigma\) is unknown (we use the unbiased sample standard deviation \(s = s_{n-1}\), the \(s_x\) key of calculators).
Method — Steps for a One-Sample t-test using Calculator
- Step 1: Write the Hypotheses
- \(H_0: \mu = k\) (The population mean equals a specific value \(k\)).
- \(H_1: \mu \neq k\) (or \(\mu < k\), \(\mu > k\) depending on the question).
- Step 2: Enter data into GDC
- Enter the data into List 1 (or use summary statistics \(\bar{x}, s, n\)).
- Select T-Test (or 1-Sample t-test).
- Enter the value of \(\mu_0\) (from \(H_0\)).
- Step 3: Decision Rule
Compare the p-value with the significance level \(\alpha\).- If \(p\text{-value} < \alpha\): Reject \(H_0\).
- If \(p\text{-value} \geq \alpha\): Fail to reject \(H_0\).
- Step 4: Conclusion
State whether there is sufficient evidence to support the alternative hypothesis, in context.
Example
A factory produces screws with a target length of 50 mm. A quality control manager takes a random sample of 15 screws and finds a mean length of 49.8 mm with a standard deviation of 0.5 mm.Conduct a t-test at the 5\(\pourcent\) significance level to see if the mean length is different from 50 mm.
- Step 1: Hypotheses
- \(H_0: \mu = 50\) (The mean is 50 mm).
- \(H_1: \mu \neq 50\) (The mean is different from 50 mm).
- Step 2: Calculator
Using GDC with inputs: \(\mu_0=50, \bar{x}=49.8, s_x=0.5, n=15\). $$ t \approx -1.549 $$ $$ p\text{-value} \approx 0.144 $$ - Step 3: Decision
\(0.144 > 0.05\). Since \(p > \alpha\), we fail to reject \(H_0\). - Step 4: Conclusion
There is insufficient evidence at the 5\(\pourcent\) level to claim that the mean length of the screws is different from 50 mm.
Skills to practice
- Conducting One-Sample t-tests
II.2
The Two-Sample t-test
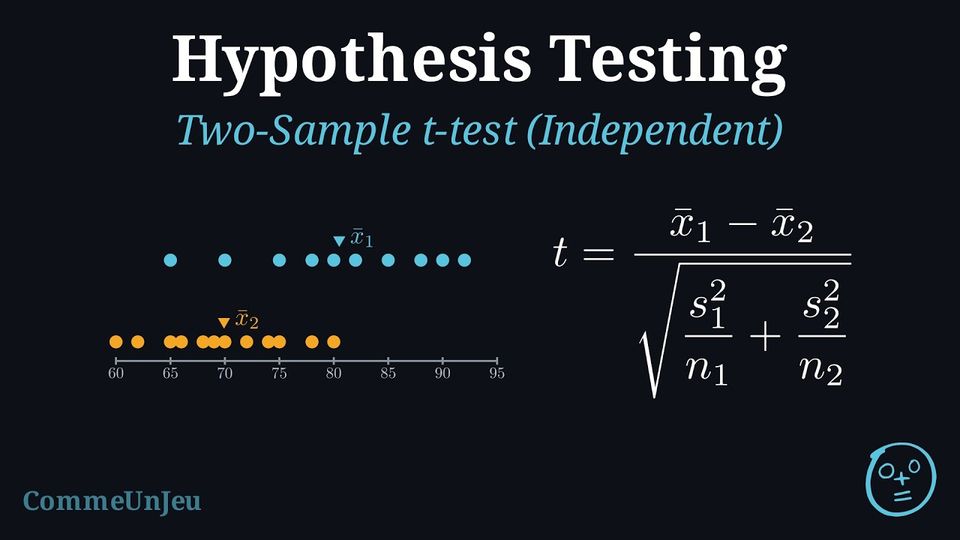
Definition — Two-Sample t-test Formula
The two-sample t-test compares the means of two independent groups to see if they are significantly different.The test statistic is given by:$$ t = \frac{\bar{x}_1 - \bar{x}_2}{\sqrt{\frac{s_1^2}{n_1} + \frac{s_2^2}{n_2}}} $$ Where: - \(\bar{x}_1, \bar{x}_2\) are the sample means.
- \(s_1^2, s_2^2\) are the sample variances.
- \(n_1, n_2\) are the sample sizes.
Definition — Pooled Two-Sample t-test
When the two independent samples come from normal populations with the same unknown variance \(\sigma^2\), both samples estimate this one variance, and the pooled estimate combines them, each weighted by its number of degrees of freedom: $$\textcolor{colordef}{s_p^2 = \dfrac{(n_1 - 1)\,s_1^2 + (n_2 - 1)\,s_2^2}{n_1 + n_2 - 2}},$$ where \(s_1^2\) and \(s_2^2\) are the unbiased sample variances (computed with \(n - 1\), the \(s_x\) key of calculators squared). The pooled two-sample \(t\)-test of \(H_0 : \mu_1 = \mu_2\) uses the statistic $$\textcolor{colordef}{t = \dfrac{\bar{x}_1 - \bar{x}_2}{s_p\sqrt{\dfrac{1}{n_1} + \dfrac{1}{n_2}}}},$$ which, when \(H_0\) is true, follows the \(t\)-distribution with \(n_1 + n_2 - 2\) degrees of freedom. On a calculator, it is the 2-sample \(t\)-test with the setting Pooled: Yes. The equal-variance assumption is made when the question states it, when a course or an examination sets it as the convention, or when the context makes it a reasonable modelling choice (two groups measured in the same way, with close sample standard deviations, which support it without proving it); otherwise, the unpooled statistic of the two-sample \(t\)-test is used. Example
Seedlings of the same variety are grown with two nutrient solutions, \(A\) and \(B\), in two independent random samples. Their heights after four weeks, in cm, are: - solution \(A\): \(24.1\), \(25.3\), \(23.8\), \(26.0\), \(24.7\), \(25.5\);
- solution \(B\): \(22.9\), \(23.5\), \(24.0\), \(22.4\), \(23.8\), \(23.1\), \(24.2\).
Let \(\mu_A\) and \(\mu_B\) be the mean heights, in cm, with each solution.
- \(H_0 : \mu_A = \mu_B\) and \(H_1 : \mu_A > \mu_B\) (one-tailed).
- Normal populations with a common variance: pooled two-sample \(t\)-test at \(\alpha = 0.05\).
- From the lists: \(\bar{x}_A = 24.9\), \(s_A^2 = 0.724\) (\(n_A = 6\)); \(\bar{x}_B \approx 23.414\), \(s_B^2 \approx 0.4181\) (\(n_B = 7\)). $$\begin{aligned}[t] s_p^2 &= \frac{(n_A - 1)\,s_A^2 + (n_B - 1)\,s_B^2}{n_A + n_B - 2} && \text{(pooled estimate)} \\ &\approx \frac{5 \times 0.724 + 6 \times 0.4181}{11} \approx 0.5571, \\ t &= \frac{\bar{x}_A - \bar{x}_B}{s_p\sqrt{\frac{1}{n_A} + \frac{1}{n_B}}} && \text{(pooled statistic)} \\ &\approx \frac{24.9 - 23.414}{0.7464 \times 0.5563} \approx 3.58, \end{aligned}$$ with \(6 + 7 - 2 = 11\) degrees of freedom. The calculator (2-sample \(t\)-test, Pooled: Yes, \(\mu_1 > \mu_2\)) gives \(t \approx 3.578\) and \(p\text{-value} \approx 0.00217\).
- \(0.00217 \leq 0.05\): reject \(H_0\).
- At the \(5\pourcent\) level, the data show that solution \(A\) gives taller seedlings on average.
Skills to practice
- Conducting Pooled Two-Sample t-tests
III
Chi-squared Tests
III.1
The Chi-squared Test for Independence
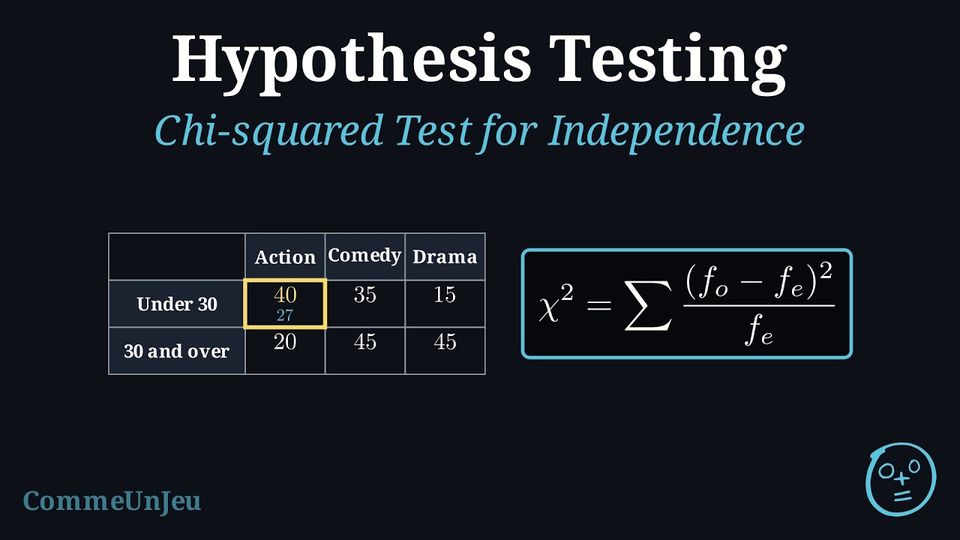
Every test so far has compared numerical measurements, such as means. The chi-squared test extends hypothesis testing to categorical data. In this sense it is the categorical analogue of correlation: a correlation coefficient measures the association between two numerical variables, while the chi-squared test of independence asks whether two categorical variables are associated.
Definition — Two-Way Table of Counts
Two qualitative variables are observed on the same population of \(N\) individuals. The two-way table of counts has one row for each category of the first variable and one column for each category of the second; the cell at row \(A\) and column \(B\) holds the count of the individuals that have both categories \(A\) and \(B\), written \(n(A \cap B)\). - The last column holds the row totals: \(n(A)\) is the number of individuals of category \(A\).
- The last row holds the column totals: \(n(B)\) is the number of individuals of category \(B\).
- The bottom-right cell holds the grand total \(N\), which is the sum of the row totals and the sum of the column totals.
The Chi-squared (\(\chi^2\)) test for independence determines if there is a significant association between two categorical variables. It compares the observed frequencies in a contingency table to the frequencies we would expect if the variables were completely independent.
Definition — Observed and Expected Frequencies
- Observed Frequencies (\(f_o\)): The actual data collected and recorded in a contingency table.
- Expected Frequencies (\(f_e\)): The theoretical counts calculated assuming the variables are independent.
Definition — Chi-squared Statistic
The test statistic \(\chi^2_{calc}\) measures the total deviation between observed and expected values:$$ \chi^2_{calc} = \sum \frac{(f_o - f_e)^2}{f_e} $$ The degrees of freedom (\(df\)) for a table with \(r\) rows and \(c\) columns is:$$ \mathrm{d}f = (r - 1)(c - 1) $$ Method — Steps for a Chi-squared Test
- Step 1: Write the Hypotheses
- \(H_0\): The variables are independent.
- \(H_1\): The variables are not independent (associated).
- Step 2: Enter data into GDC
- Enter the observed contingency table into a Matrix (e.g., Matrix A).
- Select \(\chi^2\)-Test (usually under Stat \(\to\) Tests).
- Step 3: Analyze Results
The calculator provides \(\chi^2_{calc}\), the p-value, and the degrees of freedom (\(df\)).
Note: As a rule of thumb, all expected frequencies should be at least 5 for the test to be reliable. - Step 4: Conclusion
Compare the p-value to the significance level \(\alpha\).- If \(p\text{-value} < \alpha\): Reject \(H_0\) (Variables are dependent/associated).
- If \(p\text{-value} \geq \alpha\): Fail to reject \(H_0\) (No evidence of association).
Example
A survey asked 200 people about their preferred type of movie and their age group. The results are shown below: | Action | Comedy | Drama | |
| Under 30 | 40 | 35 | 15 |
| 30 and over | 20 | 45 | 45 |
- Step 1: Hypotheses
\(H_0\): Age group and movie preference are independent.
\(H_1\): Age group and movie preference are not independent (they are associated). - Step 2: Calculator
Enter the \(2 \times 3\) matrix into the calculator and run the \(\chi^2\)-Test.- \(\chi^2_{calc} \approx 21.1\)
- \(\mathrm{d}f = (2-1)(3-1) = 2\)
- \(p\text{-value} \approx 0.000026\) (about \(2.6 \times 10^{-5}\))
- Step 3: Conclusion
\(0.000026 < 0.05\). Since \(p < \alpha\), we reject \(H_0\).
There is strong evidence to suggest that movie preference depends on age group.
Method — Deciding with a \(\chi^2\) Critical Value
The statistic \(\chi^2_{calc}\) is never negative, and it grows as the observed frequencies move away from the expected ones: only large values count against \(H_0\), so a \(\chi^2\) test is always upper-tailed. Its critical value \(\chi^2_{crit}\) is the number such that \(P(\chi^2 \geq \chi^2_{crit}) = \alpha\) for the \(\chi^2\) distribution with the degrees of freedom \(\nu\) of the test; it is read in a table or given in the question. - Expected frequencies: compute them, and check that each one is greater than \(5\).
- Statistic: \(\chi^2_{calc} = \sum \dfrac{(f_o - f_e)^2}{f_e}\), by hand for a small table or with the calculator, and the degrees of freedom \(\nu\).
- Decision: reject \(H_0\) if \(\chi^2_{calc} \geq \chi^2_{crit}\); otherwise do not reject it. It is the same decision as rejecting when \(p\text{-value} \leq \alpha\).
| \(\nu\) | \(1\) | \(2\) | \(3\) | \(4\) | \(5\) | \(6\) | \(9\) |
| \(\alpha = 0.10\) | \(2.706\) | \(4.605\) | \(6.251\) | \(7.779\) | \(9.236\) | \(10.645\) | \(14.684\) |
| \(\alpha = 0.05\) | \(3.841\) | \(5.991\) | \(7.815\) | \(9.488\) | \(11.070\) | \(12.592\) | \(16.919\) |
| \(\alpha = 0.01\) | \(6.635\) | \(9.210\) | \(11.345\) | \(13.277\) | \(15.086\) | \(16.812\) | \(21.666\) |
Example
A café asks \(150\) customers whether they prefer coffee or tea, and notes their age group. | Coffee | Tea | |
| Under \(40\) | \(45\) | \(30\) |
| \(40\) and over | \(25\) | \(50\) |
- \(H_0\): the preferred drink is independent of the age group; \(H_1\): it is not.
- The row totals are \(75\) and \(75\), the column totals \(70\) (coffee) and \(80\) (tea), the grand total \(150\). For the cell “under \(40\), coffee”: $$f_e = \frac{\text{row total} \times \text{column total}}{\text{grand total}} = \frac{75 \times 70}{150} = 35,$$ and likewise \(40\) for “under \(40\), tea”, \(35\) and \(40\) for the second row: all greater than \(5\).
- Every cell is \(10\) away from its expected frequency: $$\begin{aligned}[t] \chi^2_{calc} &= \sum \frac{(f_o - f_e)^2}{f_e} && \text{(statistic)} \\ &= \frac{10^2}{35} + \frac{10^2}{40} + \frac{10^2}{35} + \frac{10^2}{40} \\ &\approx 2.857 + 2.5 + 2.857 + 2.5 \approx 10.71, \end{aligned}$$ with \(\nu = (2 - 1)(2 - 1) = 1\).
- At \(\alpha = 0.05\) and \(\nu = 1\), \(\chi^2_{crit} = 3.841\). Since \(10.71 > 3.841\), reject \(H_0\) (the calculator gives \(p\text{-value} \approx 0.00106\), the same decision).
- At the \(5\pourcent\) level, the preferred drink depends on the age group: the younger customers lean towards coffee, the older towards tea.
Skills to practice
- Deciding with a Critical Value
- Computing Expected Frequencies and Degrees of Freedom
- Conducting Chi-squared Tests for Independence
III.2
The Chi-squared Goodness of Fit Test
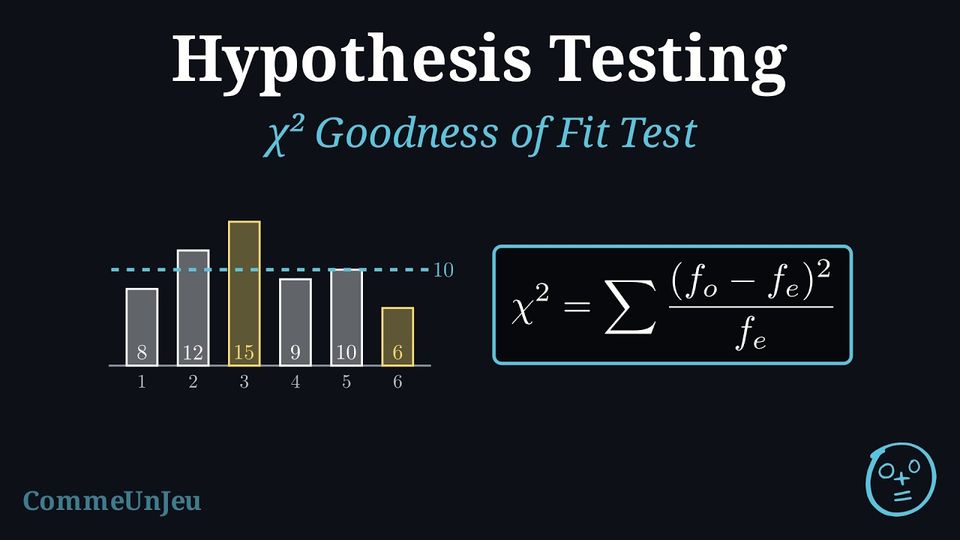
The Goodness of Fit (GOF) test is used to determine whether a variable is likely to come from a specified distribution (such as Uniform, Binomial, Normal, or a specific ratio). It compares the observed data with what we would expect theoretically.
Definition — Goodness of Fit Statistic
The test uses the same \(\chi^2\) statistic formula:$$ \chi^2_{calc} = \sum \frac{(f_o - f_e)^2}{f_e} $$ However, the degrees of freedom (\(df\)) calculation depends on the distribution:$$ \mathrm{d}f = k - 1 - m $$ Where: - \(k\) is the number of categories (bins).
- \(m\) is the number of population parameters estimated from the sample data (e.g., if you calculate mean and standard deviation from the sample to fit a Normal distribution, \(m=2\)).
Method — Steps for a GOF Test
- Step 1: Hypotheses
- \(H_0\): The data follow the specified distribution.
- \(H_1\): The data do not follow the specified distribution.
- Step 2: Expected Frequencies
Calculate the expected frequency for each category: $$ f_e = n \times P(\text{category}) $$ (As for the independence test, all expected frequencies should be at least 5 for the \(\chi^2\) approximation to be reliable.) Note: Usually done in List 2 of the GDC. - Step 3: Calculator
- Enter observed values in List 1 (\(f_o\)).
- Enter expected values in List 2 (\(f_e\)).
- Select \(\chi^2\) GOF Test.
- Enter the correct \(df\).
- Step 4: Conclusion
Compare p-value to \(\alpha\) and interpret in context.
Example
A die is rolled 60 times. The results are: | Outcome | 1 | 2 | 3 | 4 | 5 | 6 |
| Frequency | 8 | 12 | 15 | 9 | 10 | 6 |
- Hypotheses:
\(H_0\): The die is fair (Uniform distribution).
\(H_1\): The die is not fair. - Expected Frequencies:
Total \(n=60\). If fair, \(P(X=k) = 1/6\). $$ f_e = 60 \times \frac{1}{6} = 10 \quad \text{for all outcomes} $$ - Calculator / Working:
\(L_1: \{8, 12, 15, 9, 10, 6\}\)
\(L_2: \{10, 10, 10, 10, 10, 10\}\) $$ \chi^2_{calc} = \sum \frac{(f_o - f_e)^2}{f_e} = \frac{(8-10)^2}{10} + \frac{(12-10)^2}{10} + \cdots + \frac{(6-10)^2}{10} = 5.0 $$ Degrees of freedom: \(\mathrm{d}f = k - 1 = 6 - 1 = 5\) (no parameters estimated).
\(p\text{-value} \approx 0.416\). - Conclusion:
\(0.416 > 0.05\). We fail to reject \(H_0\): there is insufficient evidence at the 5\,\(\pourcent\) level to conclude the die is unfair.
Skills to practice
- Finding Expected Frequencies for a Goodness of Fit
- Conducting Chi-squared Goodness of Fit Tests
IV
Going further
Skills to practice
- Solving Problems with Hypothesis Tests
- Quiz
Jump to section