International Baccalaureate · DP 2: Applications and Interpretation HL
Voronoi Diagrams
I
Voronoi Diagrams
Voronoi diagrams are a way to divide the plane (or a region of space) into areas based on distance to a given set of points. They are used in biology to model cell growth, in epidemiology to identify sources of infection, and in city planning to determine the catchment areas of schools, hospitals, or post offices.
The idea is simple: given a set of points (called sites), we divide the map so that every point in a region is closer to its associated site than to any other site. 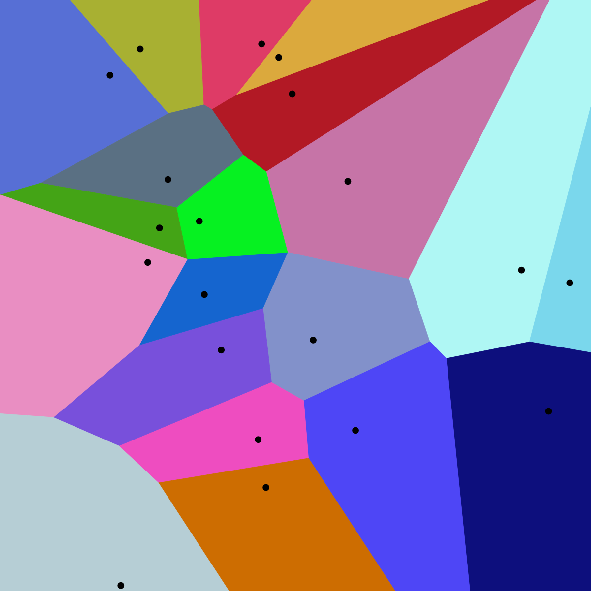
The idea is simple: given a set of points (called sites), we divide the map so that every point in a region is closer to its associated site than to any other site.
Definition — Site, Region, Edge, Vertex
Consider a finite set of points called sites. - For each site, its region (or cell) consists of all points that are strictly closer to this site than to any other site.
- An edge is a line segment, a ray or a whole line whose points are equidistant from two sites and, apart from its end points, farther from every other site: for each of these points, the two sites are the nearest sites. An edge separates the cells of its two sites, and its end points are vertices.
- A vertex is a point equidistant from three sites or more, all of them nearer to it than any other site. Edges meet at the vertices.
Example
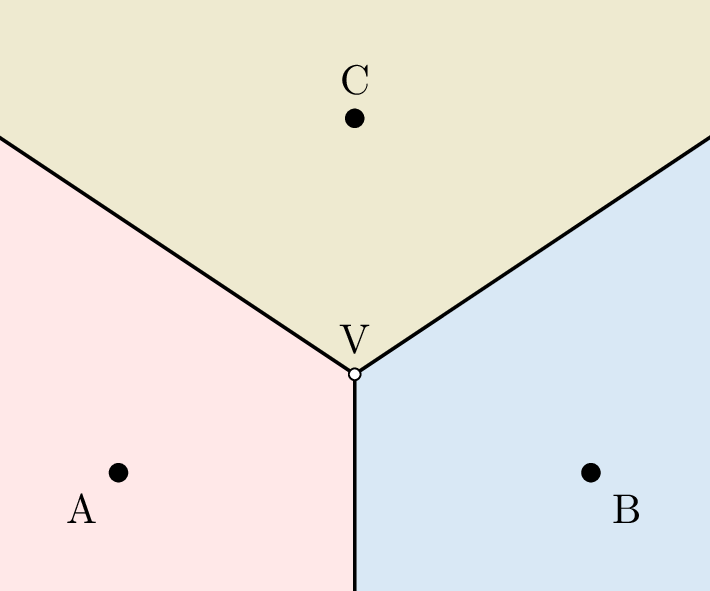
- The red region (left) consists of all points closest to A.
- The blue region (right) consists of all points closest to B.
- The green region (top) consists of all points closest to C.
Skills to practice
- Recognising Points of a Diagram
- Reading Voronoi Diagrams
- Explaining with Distances
II
The Perpendicular Bisector
Recappreviously studied — click to reread
Definition — Midpoint Formula
The midpoint \(M\) of the segment \(\Segment{AB}\), with \(A(x_A, y_A)\) and \(B(x_B, y_B)\), has coordinates $$M\left(\frac{x_A + x_B}{2},\ \frac{y_A + y_B}{2}\right):$$ each coordinate of \(M\) is the mean of the corresponding coordinates of \(A\) and \(B\). 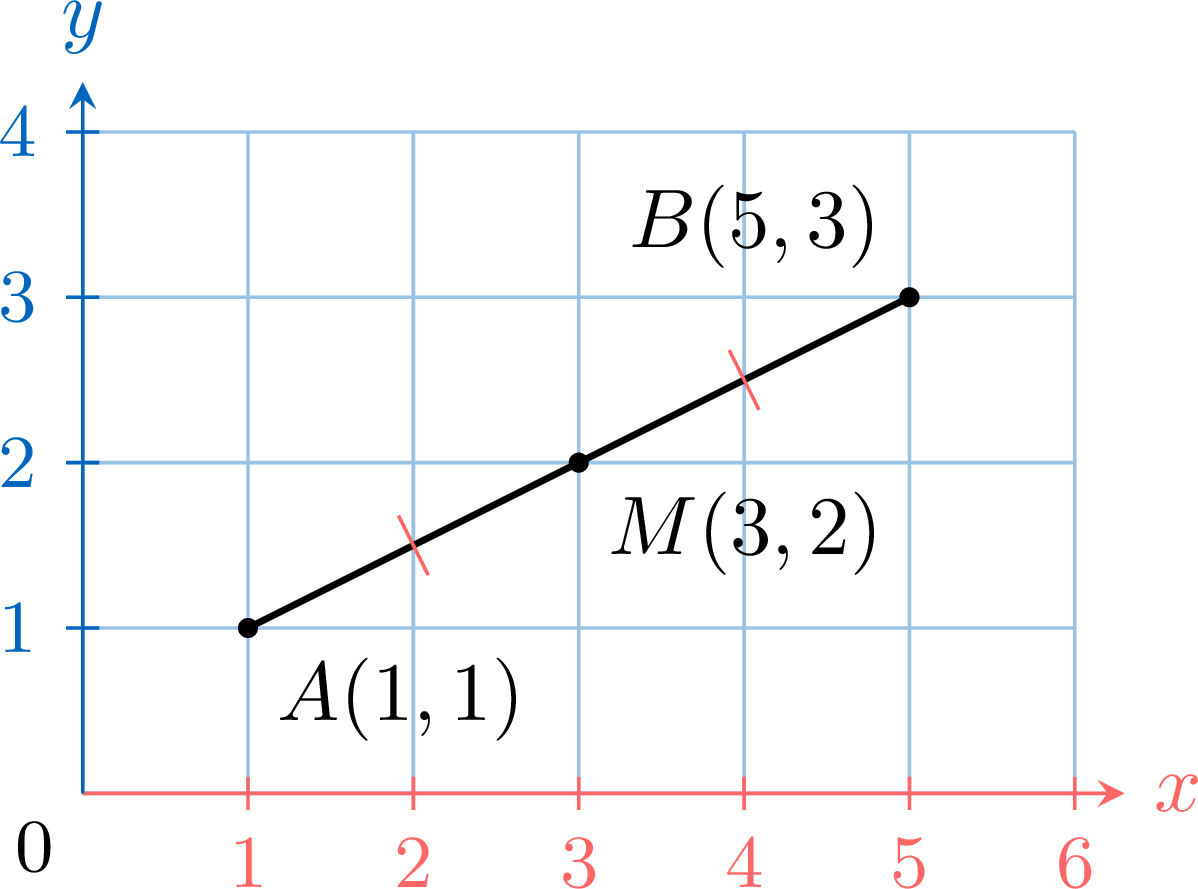
Definition — Perpendicular Bisector
The perpendicular bisector of a line segment is a line that is perpendicular to the segment and passes through its midpoint. 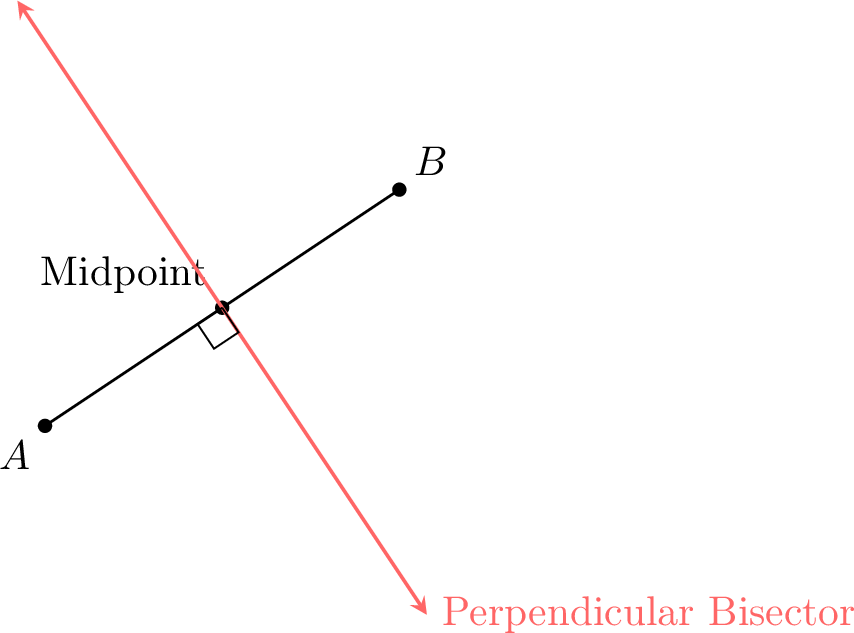
Proposition — Perpendicular bisector and equidistance
The perpendicular bisector of a segment \(\Segment{AB}\) is the set of all the points at the same distance from \(A\) and from \(B\). In other words, a point \(M\) lies on the perpendicular bisector of \(\Segment{AB}\) if and only if \(MA = MB\). 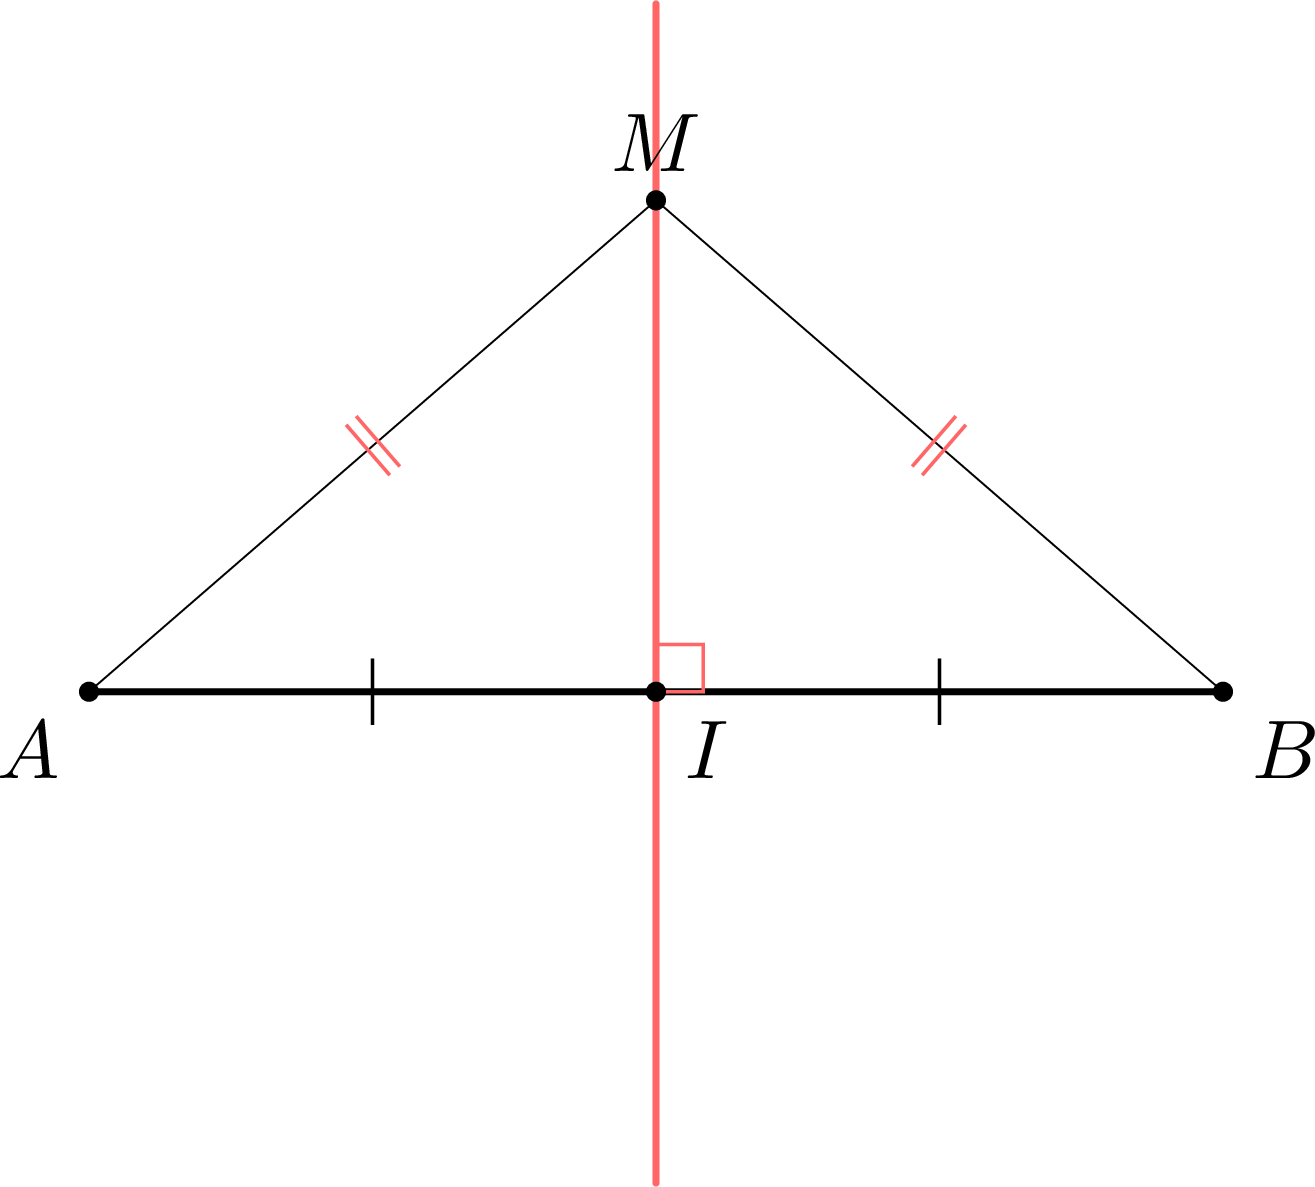
Method — Finding the Equation of a Perpendicular Bisector
To find the equation of the perpendicular bisector of the segment joining \(A(x_A, y_A)\) and \(B(x_B, y_B)\) (with \(A \neq B\)): - Find the gradient of the segment \(\Segment{AB}\) (when \(x_A \neq x_B\)): $$ m_{AB} = \frac{y_B - y_A}{x_B - x_A}. $$
- Find the gradient of the perpendicular line (\(m_\perp\)) when \(m_{AB} \neq 0\): $$ m_\perp = -\frac{1}{m_{AB}}. $$
- Find the midpoint of \(\Segment{AB}\): $$ M = \left(\frac{x_A+x_B}{2}, \frac{y_A+y_B}{2}\right). $$
- Use the point-gradient form with the midpoint \(M(x_M,y_M)\) and the perpendicular gradient \(m_\perp\): $$ y - y_M = m_\perp(x - x_M). $$
- If \(\Segment{AB}\) is horizontal (\(m_{AB}=0\)), then the perpendicular bisector is a vertical line \(x = x_M\).
- If \(\Segment{AB}\) is vertical (\(x_A = x_B\)), then the perpendicular bisector is a horizontal line \(y = y_M\).
Example
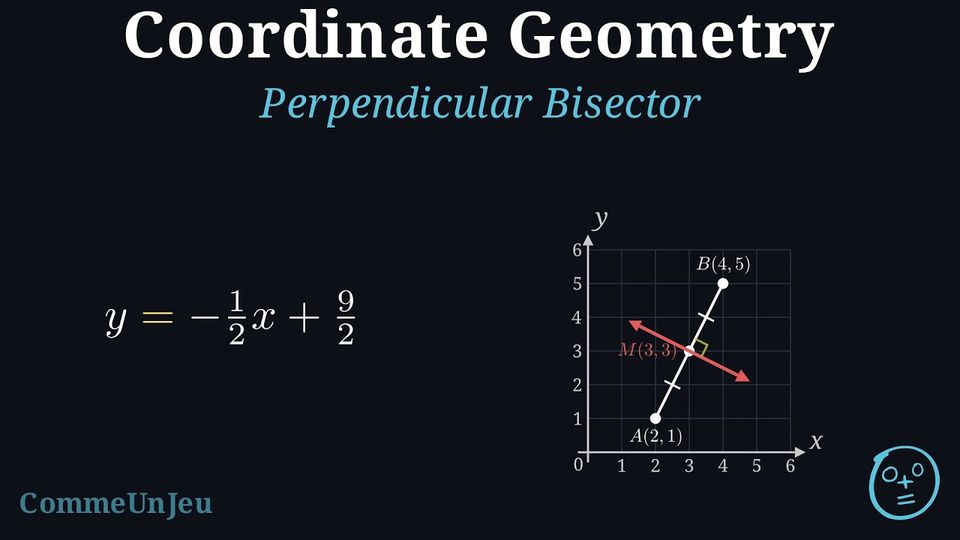
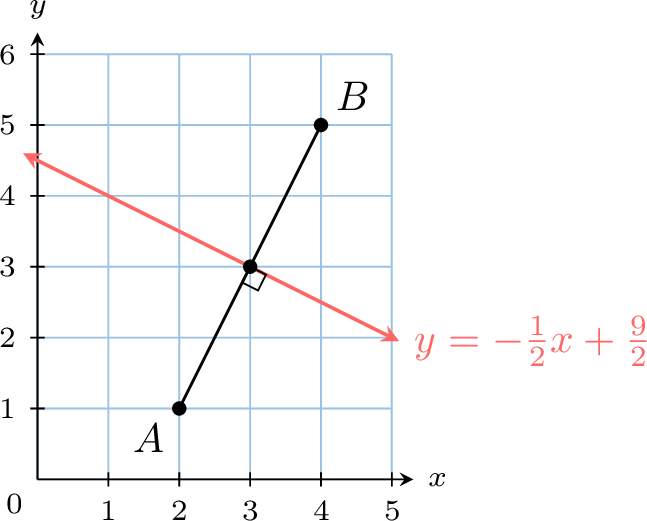
Find the equation of the perpendicular bisector of the line segment with endpoints \(A(2, 1)\) and \(B(4, 5)\). - The gradient of the segment \(\Segment{AB}\) is$$m_{AB} = \frac{5-1}{4-2} = \frac{4}{2} = 2.$$
- The gradient of the perpendicular bisector is \(m_\perp = -\dfrac{1}{2}\).
- The midpoint of \(\Segment{AB}\) is$$M = \left(\frac{2+4}{2}, \frac{1+5}{2}\right) = (3, 3).$$
- Using the point-gradient form \(y-y_1 = m(x-x_1)\) with the point \((3,3)\) and the gradient \(-\dfrac{1}{2}\): $$ \begin{aligned} y-3 &= -\frac{1}{2}(x-3) \\ y-3 &= -\frac{1}{2}x + \frac{3}{2} \\ y &= -\frac{1}{2}x + \frac{3}{2} + 3 \\ y &= -\frac{1}{2}x + \frac{9}{2}. \end{aligned} $$
Skills to practice
- Finding the Equation of an Edge
III
Constructing a Voronoi Diagram
Method — Constructing a Voronoi Diagram for 2 Sites
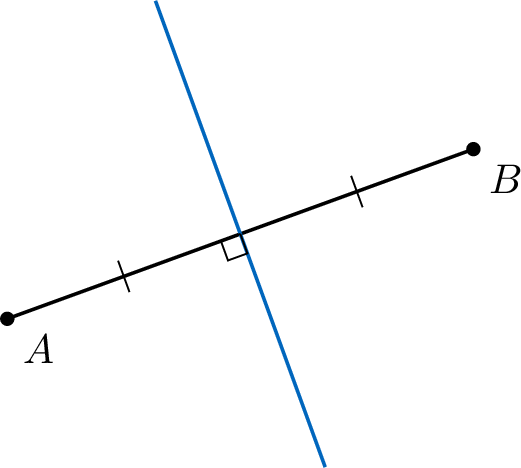
To construct a diagram for 2 sites, draw the perpendicular bisector of the segment joining the two sites. This line is the boundary between their two Voronoi regions. Example
Method — Constructing a Voronoi Diagram for 3 Sites
To construct the Voronoi diagram of three sites \(A\), \(B\) and \(C\) that are not on one line: - Draw the triangle \(ABC\) (in dashed lines, for clarity).
- Draw the perpendicular bisector of each side of the triangle.
- These three bisectors meet at a single point \(V\), equidistant from \(A\), \(B\) and \(C\): it is the only vertex of the diagram.
- The point \(V\) cuts each bisector into two rays. The edge between the cells of \(A\) and \(B\) is the ray of the bisector of \([AB]\) whose points are nearer to \(A\) and \(B\) than to \(C\): it is the ray starting at \(V\) that points towards the side of the line \((AB)\) where \(C\) is not. Check it with one point of the ray. The two other edges are found in the same way.
Example
Construct the Voronoi diagram for sites \(A\), \(B\), and \(C\). 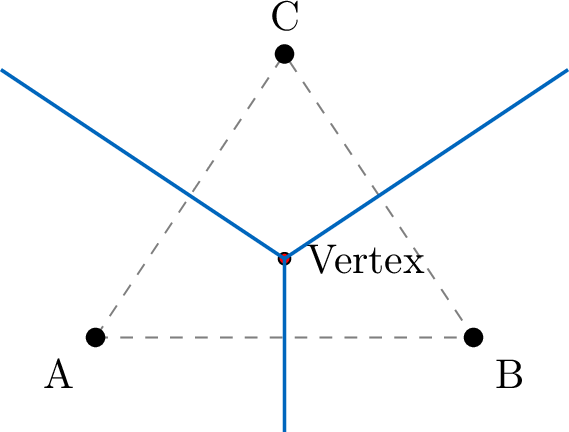
Method — Incremental Algorithm
To add a new site \(D\) to an existing diagram: - Locate the cell that contains \(D\): it is the cell of the existing site \(S\) nearest to \(D\) (if \(D\) lies on an edge or at a vertex, take any one of its nearest sites as \(S\)).
- Draw the perpendicular bisector of \([DS]\) inside the cell of \(S\). Where it meets an edge of that cell, mark a new vertex; an end that meets no edge runs off to infinity.
- From each new vertex, the edge just met leads into the cell of a neighbouring site \(T\): draw the bisector of \([DT]\) inside that cell, starting at the vertex, and again mark a new vertex where it meets an edge. Repeat until no new vertex is created. The boundary of the cell of \(D\) has then either come back to its first vertex (the cell is a closed polygon) or its two ends run off without meeting any edge (the cell is unbounded).
- Remove the parts of the old edges that now lie inside the cell of \(D\).
Example
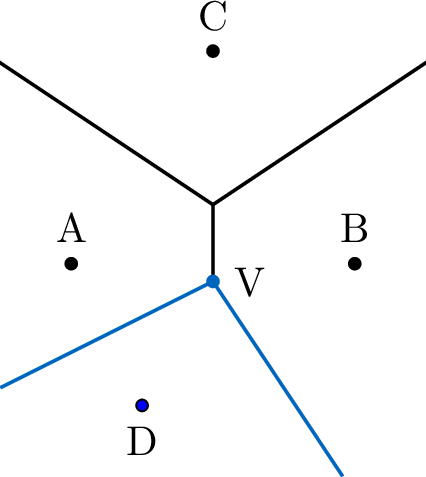
Start with the Voronoi diagram for \(A\), \(B\), and \(C\). Add a new site \(D\). 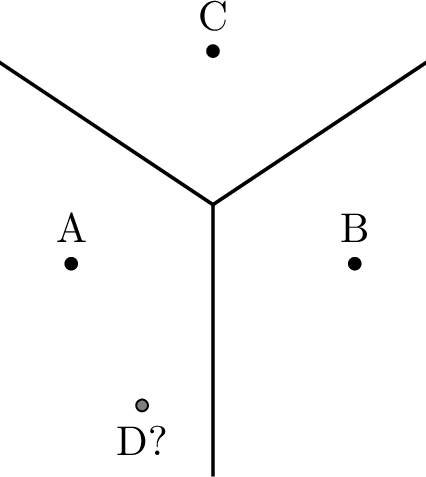
- Site \(D\) lies in the region of \(A\). We draw the perpendicular bisector between \(D\) and \(A\).
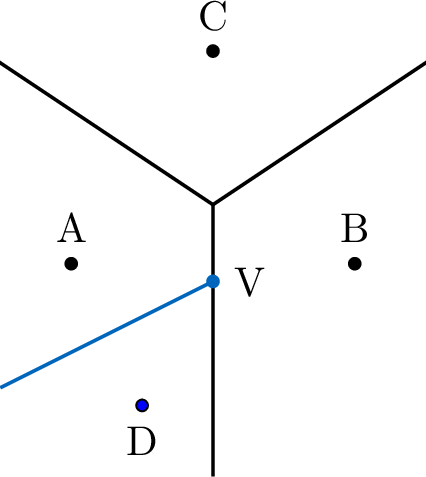
- A new vertex \(V\) (at \(V_2\)) is added. This vertex is equidistant from \(A\), \(B\) and \(D\). We must now draw the bisector between \(D\) and \(B\), starting at \(V\) as shown. This line does not meet any other existing edges, so no more new vertices are created. This tells us that the construction of the cell of \(D\) is complete.
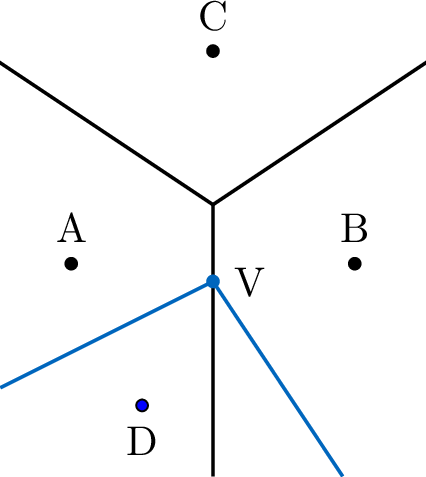
- Finally, we remove the part of the edge between \(A\) and \(B\) that now lies inside the cell of site \(D\).
Example
A park is the rectangle with corners \((0,0)\), \((8,0)\), \((8,6)\) and \((0,6)\) (coordinates in hundreds of metres). It has three playgrounds, at \(A(2,1)\), \(B(6,1)\) and \(C(4,5)\), and every point of the park is assigned to its nearest playground. Find the area of each cell within the park. 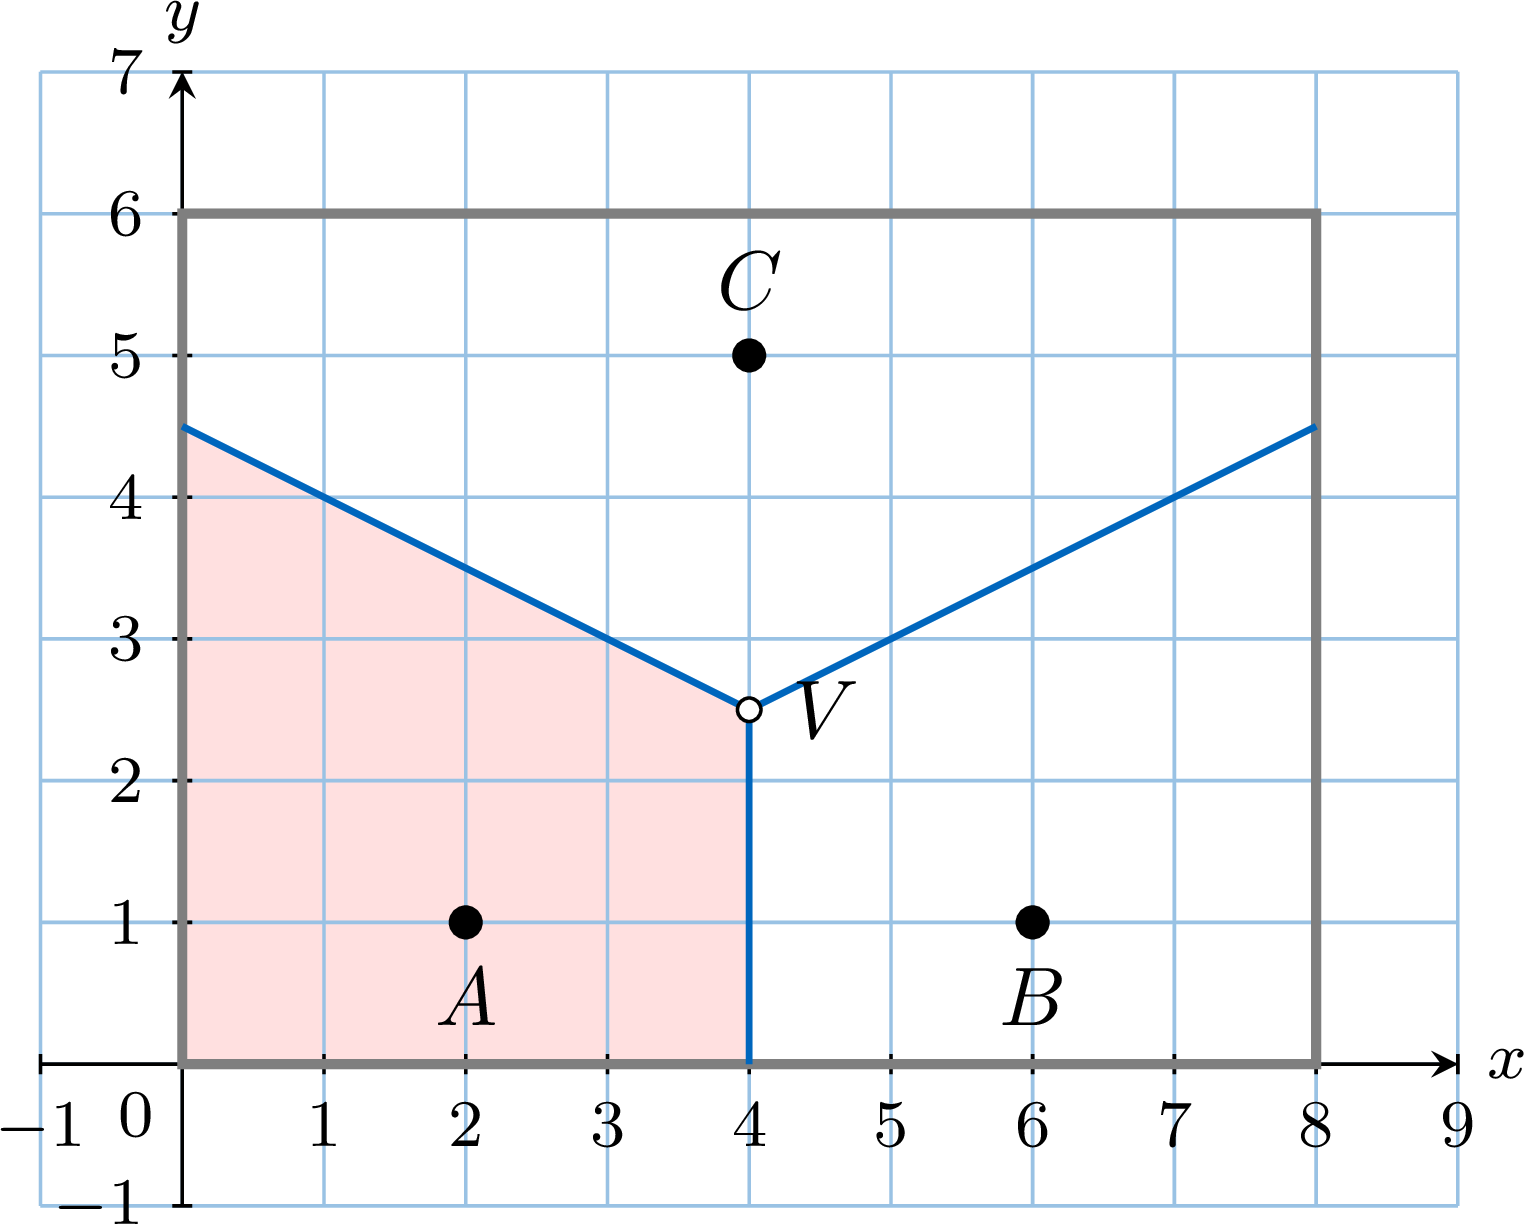
- The bisector of \([AB]\) is the vertical line \(x = 4\). The line \((AC)\) has gradient \(\frac{5-1}{4-2} = 2\) and \([AC]\) has midpoint \((3,3)\), so its bisector has gradient \(-\frac{1}{2}\): $$\begin{aligned}[t] y - 3 &= -\tfrac{1}{2}(x - 3) && \text{(point-gradient form)}\\ y &= -\tfrac{1}{2}x + \tfrac{9}{2}. \end{aligned}$$ In the same way the bisector of \([BC]\) is \(y = \frac{1}{2}x + \frac{1}{2}\). The three lines meet at the vertex \(V\left(4, \frac{5}{2}\right)\).
- The edge of \(A\) and \(B\) runs from \(V\) down to \((4,0)\); the edge of \(A\) and \(C\) runs from \(V\) to the left and meets the side \(x = 0\) at \(\left(0, \frac{9}{2}\right)\); the edge of \(B\) and \(C\) meets the side \(x = 8\) at \(\left(8, \frac{9}{2}\right)\).
- The cell of \(A\) within the park is the trapezium with corners \((0,0)\), \((4,0)\), \(\left(4, \frac{5}{2}\right)\) and \(\left(0, \frac{9}{2}\right)\). Its parallel sides are vertical, of lengths \(\frac{9}{2}\) and \(\frac{5}{2}\), at a distance \(4\) apart: $$\text{area of the cell of } A = \frac{\frac{9}{2} + \frac{5}{2}}{2} \times 4 = 14.$$
- The line \(x = 4\) is an axis of symmetry of \(A\), \(B\), \(C\) and of the park, so the cell of \(B\) also has area \(14\). The park has area \(8 \times 6 = 48\), hence the cell of \(C\) has area \(48 - 14 - 14 = 20\).
Skills to practice
- Recognising Edges and Vertices
- Calculating the Area of a Cell
- Drawing a Voronoi Diagram
- Finding a Vertex from Coordinates
- Adding a Site
- Reconstructing a Diagram
IV
Nearest Neighbour Interpolation
Definition — Nearest Neighbor
Given a set of data values associated with the sites, the value at any point in the plane can be estimated by taking the value of the site whose Voronoi region contains that point. This is called nearest neighbor interpolation.If the point lies on an edge or at a vertex of the diagram, it is equidistant from two or more nearest sites: its value is then estimated by the average of the values of these equidistant nearest sites.
Example
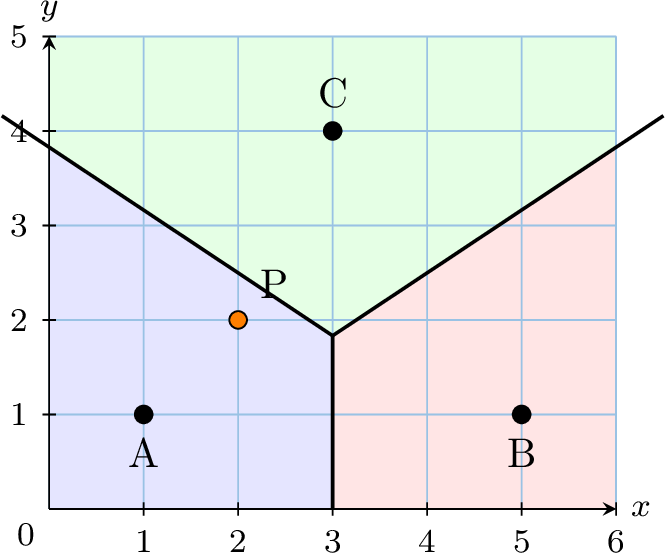
A city has 3 post offices at coordinates \(A(1,1)\), \(B(5,1)\), and \(C(3,4)\).You live at \(P(2,2)\). Which post office serves you?
- Distance \(PA = \sqrt{(2-1)^2 + (2-1)^2} = \sqrt{1+1} = \sqrt{2} \approx 1.41\).
- Distance \(PB = \sqrt{(2-5)^2 + (2-1)^2} = \sqrt{9+1} = \sqrt{10} \approx 3.16\).
- Distance \(PC = \sqrt{(2-3)^2 + (2-4)^2} = \sqrt{1+4} = \sqrt{5} \approx 2.24\).
Example
Rain gauges are installed at the three post offices of the previous example: \(A(1,1)\) records \(12\) mm, \(B(5,1)\) records \(8\) mm and \(C(3,4)\) records \(10\) mm. - Estimate the rainfall at \(M(3,1)\).
Distances: \(MA = \sqrt{(3-1)^2 + 0} = 2\), \(MB = \sqrt{(3-5)^2 + 0} = 2\), \(MC = \sqrt{0 + (1-4)^2} = 3\).
\(M\) is equidistant from its two nearest sites \(A\) and \(B\): it lies on the edge between their cells. Estimate: $$\frac{12 + 8}{2} = 10 \text{ mm}.$$ - Estimate the rainfall at the vertex \(V\left(3, \frac{11}{6}\right)\).
\(V\) is equidistant from all three sites: estimate $$\frac{12 + 8 + 10}{3} = 10 \text{ mm}.$$
Nearest neighbor interpolation is simple, but rough: the estimated value jumps when crossing an edge (two neighbouring points on either side of a boundary can receive very different values), and it shows no gradation inside a cell (every point of a cell receives exactly the value of its site). It answers “which site serves this point?” perfectly, but for quantities that vary smoothly — rainfall, temperature, altitude — it is only a first approximation.
Skills to practice
- Choosing the Estimate
- Estimating with the Nearest Neighbour
V
The Largest Empty Circle
A classic application is finding the location for a “toxic dump” (or a noisy factory). The goal is to find a location inside a specified boundary that is as far as possible from any existing habitation (the sites).
Proposition — Largest Empty Circle
Consider a finite set of sites (at least one) and a zone bounded by a polygon, its border included, in which a new facility may be placed (a district, a park, the convex hull of the sites…). For a point \(P\) of the zone, the distance from \(P\) to its nearest site is the radius of the largest circle centred at \(P\) with no site inside it: an empty circle.The point of the zone whose distance to its nearest site is the largest — the centre of the largest empty circle centred in the zone — is always one of the following candidates:
- a vertex of the Voronoi diagram lying in the zone (inside it or on its border);
- a point where an edge of the diagram crosses the border of the zone;
- a corner of the zone.
For a point \(P\) of the zone, write \(r(P)\) for the distance from \(P\) to its nearest site. We show that every point \(P\) of the zone satisfies \(r(P) \le r(K)\) for some candidate \(K\).
- Along a segment, the distance to a fixed site is largest at an end. Let \(S(x_S, y_S)\) be a site and \([MN]\) a segment, from \(M(x_M, y_M)\) to \(N(x_N, y_N)\). Write \(a = x_N - x_M\), \(b = y_N - y_M\), \(c = x_M - x_S\) and \(d = y_M - y_S\): the points of \([MN]\) are the points \(P_t(x_M + ta, y_M + tb)\) for \(t \in [0, 1]\), and $$\begin{aligned}[t] SP_t^2 &= (c + ta)^2 + (d + tb)^2 && \text{(distance formula)}\\ &= (a^2 + b^2)\,t^2 + 2(ac + bd)\,t + c^2 + d^2. && \text{(expansion)} \end{aligned}$$ This is a quadratic function of \(t\) with leading coefficient \(a^2 + b^2 = MN^2 > 0\): its graph is a parabola opening upwards, so on \([0, 1]\) its largest value is taken at \(t = 0\) or at \(t = 1\), that is at \(M\) or at \(N\).
- Inside a cell, the distance is largest at a corner of the piece. The edges of the diagram cut the zone into pieces, each lying in a single cell (a cell may hold several pieces when the zone is not convex); each piece is a polygon, and every point of a piece lying in the cell of the site \(S\) has \(S\) as a nearest site, so \(r = SP\) on the whole piece. Let \(P\) be a point of such a piece. Moving from \(P\) along a line in both directions, one leaves the piece at two points \(M\) and \(N\) of its border, with \(P \in [MN]\): by step 1, \(SP \le \max(SM, SN)\). The point \(M\) lies on a side \([UW]\) of the piece, and by step 1 again \(SM \le \max(SU, SW)\); the same holds for \(N\). So \(SP \le SK\) for some corner \(K\) of the piece, and \(SK = r(K)\) since \(K\) belongs to the piece.
- The corners of a piece are candidates. A corner of a piece is a point where two sides of the piece meet: two edges of the diagram (a vertex of the diagram, lying in the zone), an edge and the border of the zone (a point where an edge crosses the border), or two sides of the zone (a corner of the zone).
Example
Three towns are located at \(A(0,0)\), \(B(4,0)\) and \(C(0,4)\). A waste facility must be built inside the triangle \(ABC\) (sides included), as far as possible from the three towns. Find its location and the radius of its empty circle. 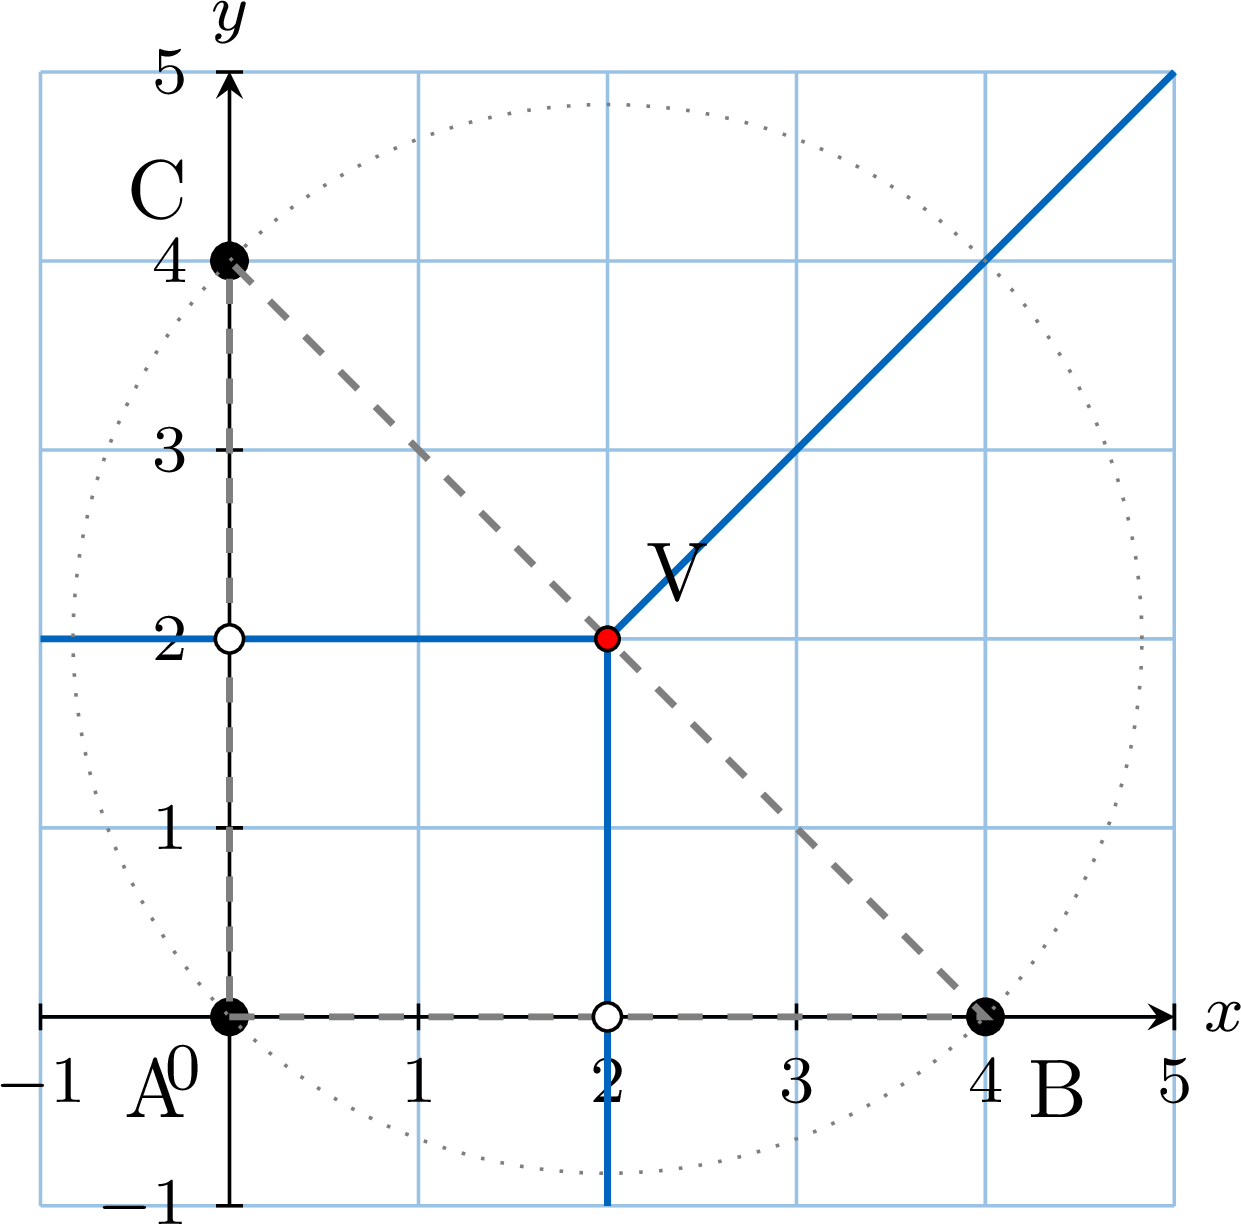
- The segment \([AB]\) lies on the line \(y = 0\) and has midpoint \((2,0)\), so its perpendicular bisector is the line \(x = 2\). The segment \([AC]\) lies on the line \(x = 0\) and has midpoint \((0,2)\), so its perpendicular bisector is the line \(y = 2\).
- These bisectors meet at the vertex \(V(2,2)\), with \(VA^2 = 2^2 + 2^2 = 8\), \(VB^2 = (2-4)^2 + 2^2 = 8\) and \(VC^2 = 2^2 + (2-4)^2 = 8\). As \(2 + 2 = 4\), the vertex lies on the side \([BC]\) (the line \(x + y = 4\)): it belongs to the zone, on its border.
- The edge between the cells of \(A\) and \(B\) is the part of the line \(x = 2\) on the side of \(V\) away from \(C\): it crosses \([AB]\) at \((2,0)\), at distance \(2\) from \(A\) and \(B\). In the same way, the edge between the cells of \(A\) and \(C\) crosses \([AC]\) at \((0,2)\), at distance \(2\). The edge between the cells of \(B\) and \(C\) leaves \(V\) away from \(A\), outside the triangle.
- The corners of the zone are the towns themselves: distance \(0\).
Example
A county is the square with corners \((0,0)\), \((8,0)\), \((8,8)\) and \((0,8)\) (coordinates in km). Three villages lie at \(A(1,4)\), \(B(4,1)\) and \(C(4,7)\). A waste incinerator must be built in the county, as far as possible from the three villages. Find its location and the radius of its empty circle. 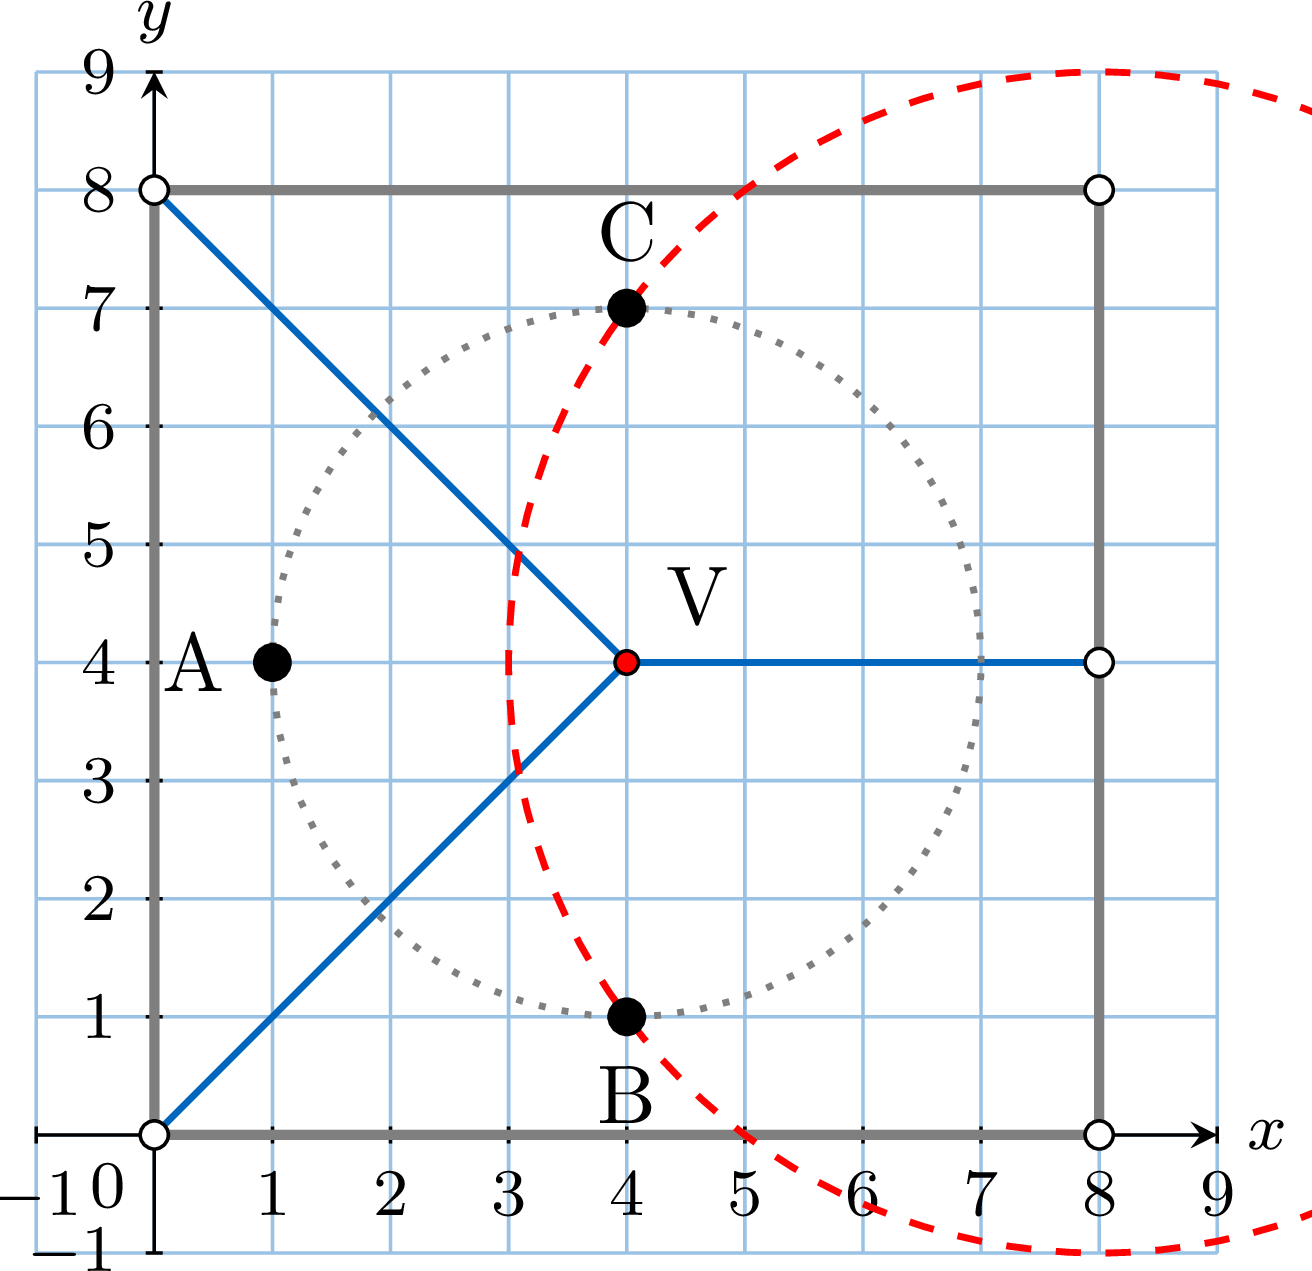
- The segment \([BC]\) is vertical with midpoint \((4,4)\): its perpendicular bisector is the line \(y = 4\). The line \((AB)\) has gradient \(\frac{1-4}{4-1} = -1\) and \([AB]\) has midpoint \(\left(\frac{5}{2}, \frac{5}{2}\right)\): its bisector has gradient \(1\) and is the line \(y = x\). The line \((AC)\) has gradient \(\frac{7-4}{4-1} = 1\) and \([AC]\) has midpoint \(\left(\frac{5}{2}, \frac{11}{2}\right)\): its bisector has gradient \(-1\) and is the line \(y = -x + 8\).
- The three bisectors meet at the vertex \(V(4,4)\), with \(VA^2 = 3^2 + 0^2 = 9\), \(VB^2 = 0^2 + 3^2 = 9\) and \(VC^2 = 0^2 + (-3)^2 = 9\): its empty circle has radius \(3\).
- The edge between the cells of \(B\) and \(C\) leaves \(V\) along \(y = 4\), away from \(A\), and crosses the border at \((8,4)\), at distance \(\sqrt{4^2 + 3^2} = 5\) from \(B\) and from \(C\). The edge between the cells of \(A\) and \(B\) leaves \(V\) along \(y = x\), away from \(C\), and reaches the corner \((0,0)\), at distance \(\sqrt{1^2 + 4^2} = \sqrt{17}\) from \(A\) and \(B\); the edge between the cells of \(A\) and \(C\) reaches the corner \((0,8)\), at distance \(\sqrt{17}\) from \(A\) and \(C\).
- The two other corners: the nearest village of \((8,0)\) is \(B\), at distance \(\sqrt{4^2 + 1^2} = \sqrt{17}\); the nearest village of \((8,8)\) is \(C\), at distance \(\sqrt{17}\).
Many problems simplify the search: the facility must be placed at a vertex of the diagram, or the zone is chosen so that the best point is a vertex where three edges meet. Only the vertices lying in the zone are then compared, and the one with the largest empty circle is kept. Without such an indication, the points where the edges cross the border and the corners of the zone are candidates as well.
Skills to practice
- Recognising the Best Location
- Locating a Toxic Waste Dump
VI
Going further
Skills to practice
- Diagnosing and Correcting Errors
- Solving Problems
- Quiz
Jump to section