International Baccalaureate · DP 2: Applications and Interpretation HL
Revision: Functions and Modelling
I
Toolbox: Variation Models
Recappreviously studied — click to reread
Definition — Proportion with a Power
Let \(n\) be a positive whole number and \(k\) a nonzero number. - \(y\) is directly proportional to \(x^n\) when \(y = kx^n\) for every pair of matching values. We write \(y \propto x^n\). For \(n = 2\), \(y\) is proportional to the square of \(x\); for \(n = 3\), to the cube of \(x\).
- \(y\) is inversely proportional to \(x^n\) when \(y = \dfrac{k}{x^n}\) for every pair of matching values, with \(x \neq 0\). We write \(y \propto \dfrac{1}{x^n}\). For \(n = 2\), this is the inverse-square law.
Proposition — Asymptotic Behaviour
For \(k \neq 0\) and \(n\) a positive integer, the graph of the inverse variation model \(y = \dfrac{k}{x^n} = kx^{-n}\) (the form \(ax^m\) with \(m < 0\)) has the \(y\)-axis, \(x = 0\), as a vertical asymptote and the \(x\)-axis, \(y = 0\), as a horizontal asymptote. Method — Recognising the Law from a Table
For each column of the table (with \(x \neq 0\)): - compute \(\dfrac{y}{x}\) and \(xy\), then, if neither is constant, \(\dfrac{y}{x^2}\) and \(x^2y\), then \(\dfrac{y}{x^3}\) and \(x^3y\);
- keep the calculation that gives the same number in every column: if \(\dfrac{y}{x^n}\) is constant, \(y \propto x^n\); if \(x^ny\) is constant, \(y \propto \dfrac{1}{x^n}\); that number is the constant \(k\);
- if no calculation is constant, the table shows none of the laws tested here (\(n = 1\), \(2\) or \(3\)) — one column that breaks the pattern is enough.
Example
Each table comes from an experiment. Determine the variation model that each table follows. - The air resistance \(R\), in newtons, on a cyclist riding at \(v\) metres per second.
\(v\) \(2\) \(4\) \(6\) \(8\) \(R\) \(1.2\) \(4.8\) \(10.8\) \(19.2\) - The time \(T\), in hours, that \(w\) workers need to paint a hall.
\(w\) \(2\) \(3\) \(4\) \(6\) \(T\) \(18\) \(12\) \(9\) \(6\)
- \(R\) increases with \(v\), so we test direct variation with a power of \(v\): we compute \(\frac{R}{v}\), then \(\frac{R}{v^2}\), for every data point.
\(v\) \(2\) \(4\) \(6\) \(8\) \(\frac{R}{v}\) \(0.6\) \(1.2\) \(1.8\) \(2.4\) \(\frac{R}{v^2}\) \(0.3\) \(0.3\) \(0.3\) \(0.3\) - \(T\) decreases when \(w\) increases, so we test inverse variation: we compute the product \(wT\) for every data point: \(2 \times 18 = 36\), \(3 \times 12 = 36\), \(4 \times 9 = 36\), \(6 \times 6 = 36\). The product is constant, so \(T\) varies inversely with \(w\): \(T \propto \frac{1}{w}\) and \(T = \frac{36}{w}\). The constant \(36\) is the number of hours one worker alone would need, if the law held for one worker: \(w = 1\) lies outside the data, so this reading is an extrapolation.
Skills to practice
- Finding a Variation Model with a Power
II
Toolbox: Sinusoidal Models in Degrees
Recappreviously studied — click to reread
Common real-world examples of sinusoidal models include phenomena that oscillate (fluctuate periodically):
- \(D(t)\) is the depth of water at a shore \(t\) hours after midnight
- \(T(n)\) is the temperature of a city \(n\) days after January 1st
- \(H(t)\) is the vertical height above ground of a person \(t\) seconds after entering a Ferris wheel
Method — Modelling Periodic Data in Degrees
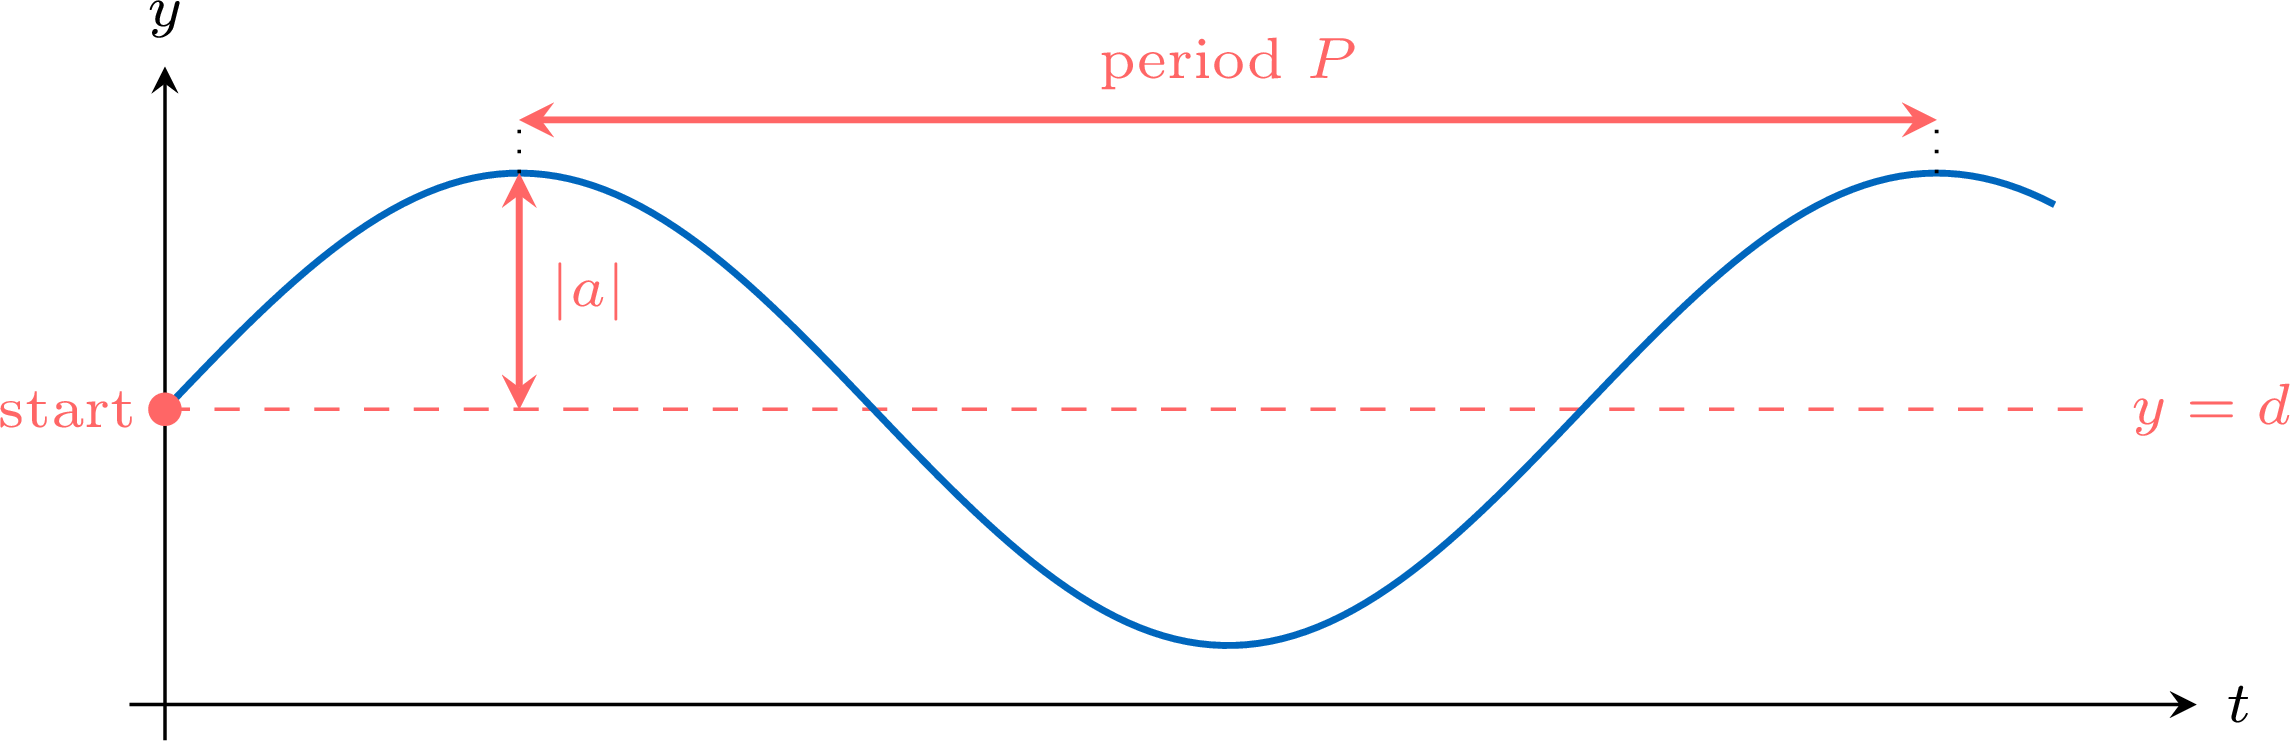
A quantity that repeats itself every \(P\) units of time in a smooth wave, rising and falling symmetrically about a middle value, can be modelled by \(y = a\sin(bt) + d\) or \(y = a\cos(bt) + d\), where the angle \(bt\) is measured in degrees. - Principal axis: \(d = \dfrac{\text{maximum} + \text{minimum}}{2}\).
- Amplitude: \(|a| = \dfrac{\text{maximum} - \text{minimum}}{2}\).
- Period: one period is one full turn of \(360^\circ\), so \(b = \dfrac{360}{P}\), in degrees per unit of time (\(b > 0\)).
- Form and sign, read on the start of the data, at \(t = 0\):
- on the principal axis and rising: \(y = a\sin(bt) + d\) with \(a > 0\);
- on the principal axis and falling: \(y = a\sin(bt) + d\) with \(a < 0\);
- at a maximum: \(y = a\cos(bt) + d\) with \(a > 0\);
- at a minimum: \(y = a\cos(bt) + d\) with \(a < 0\).
- Check the model on a data point, and set the calculator to degree mode before using it.
Example
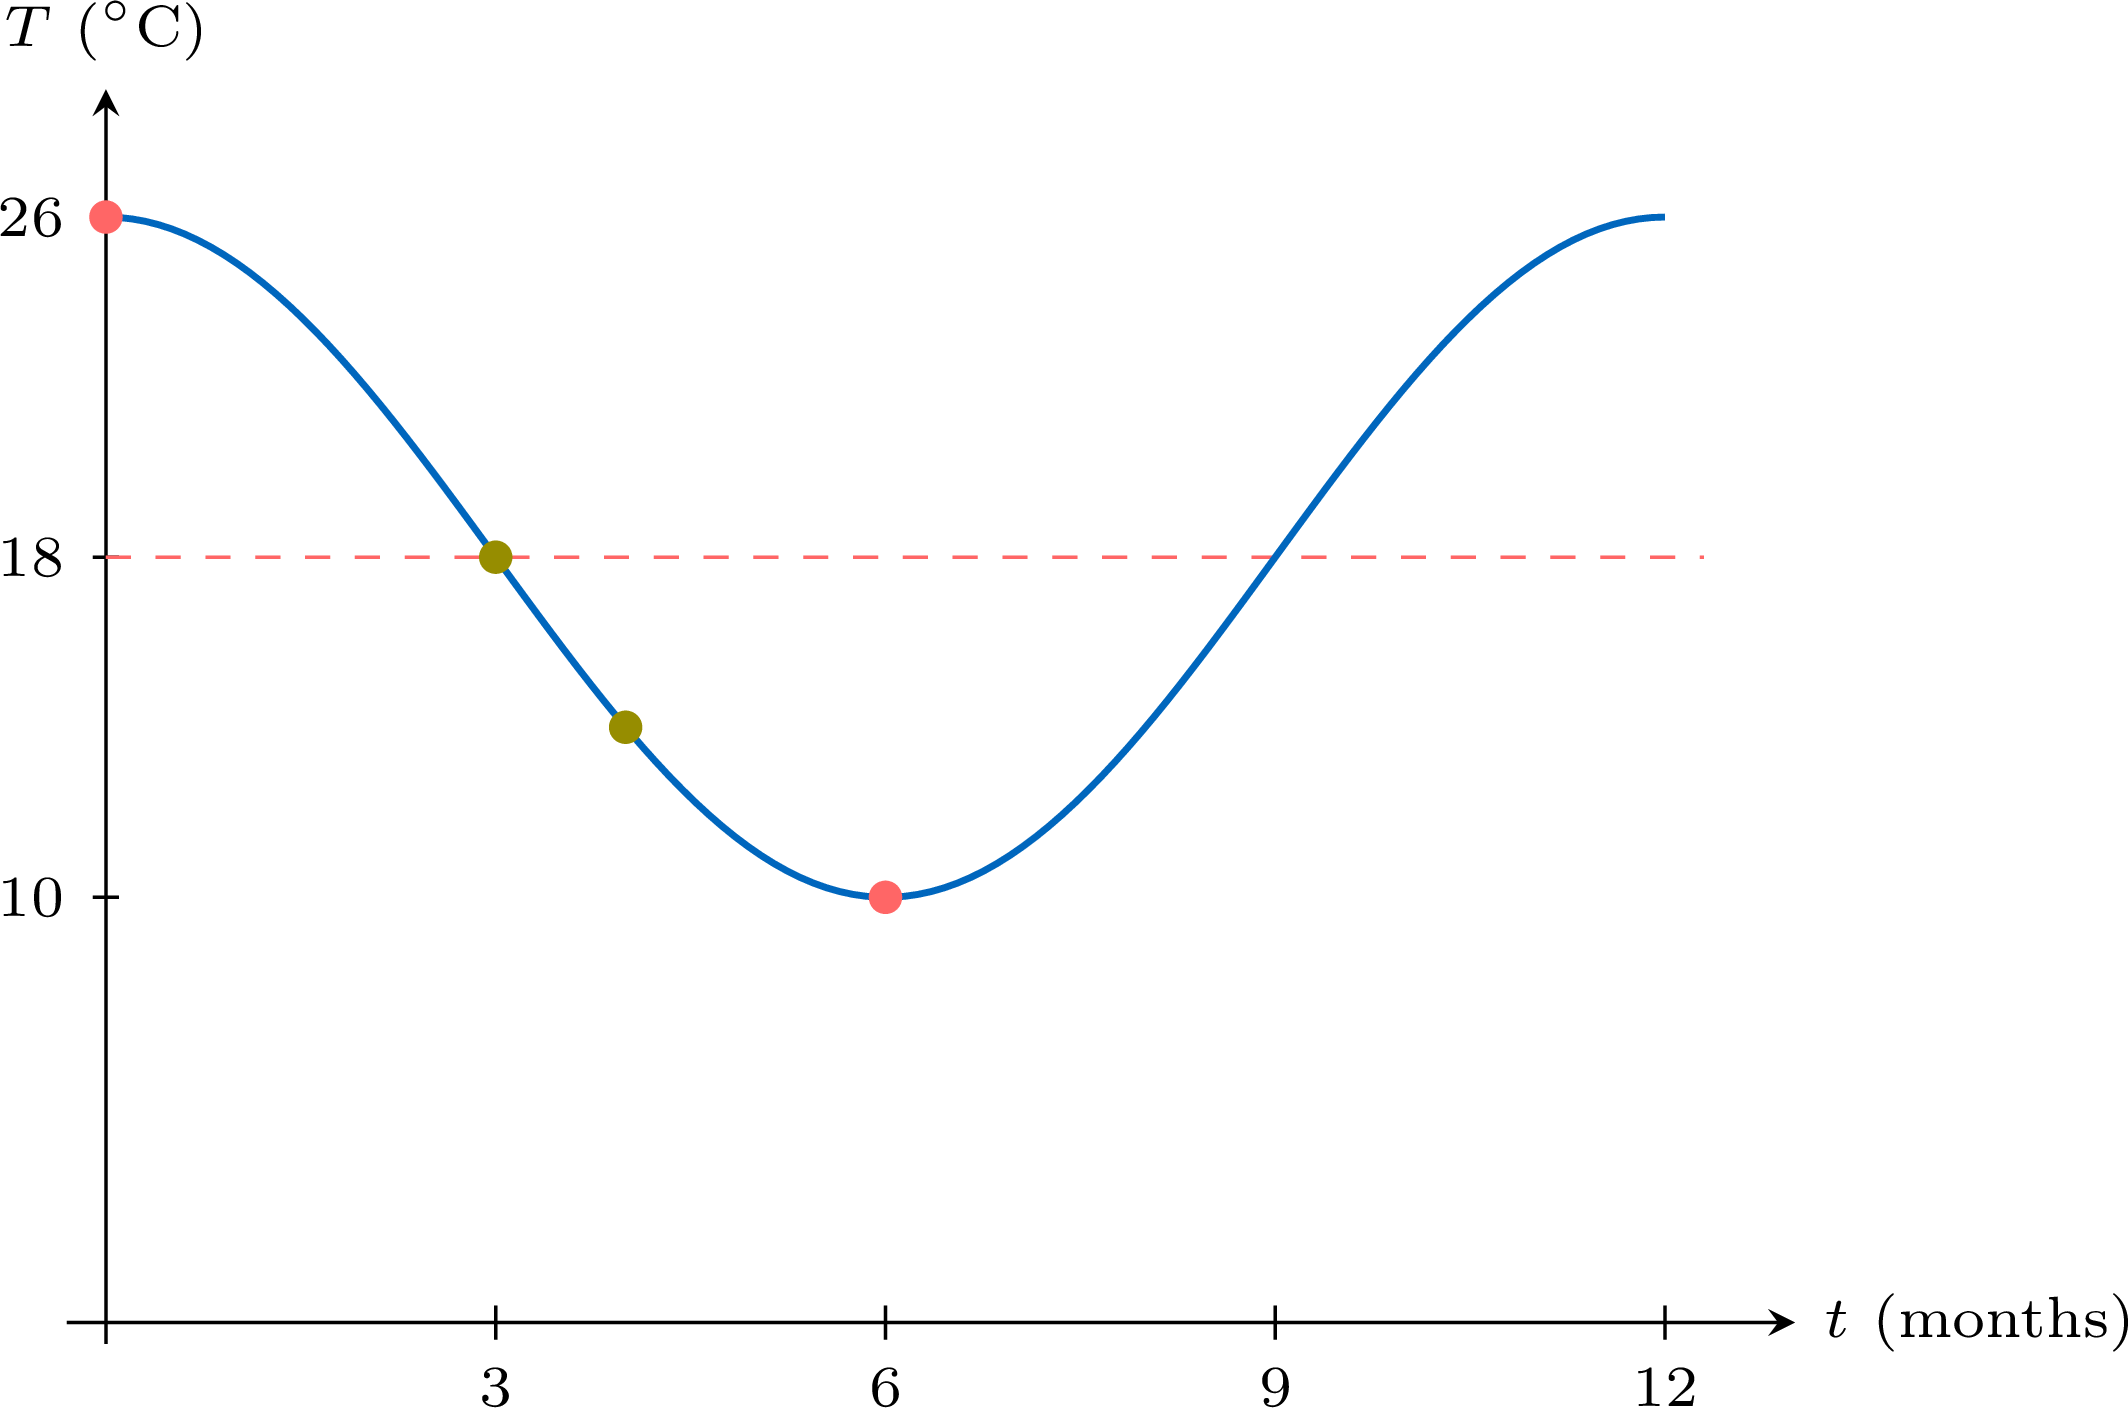
In a city of the southern hemisphere, the mean monthly temperature is highest in January, \(26^\circ\)C, and lowest in July, \(10^\circ\)C, and the pattern repeats every year. Let \(t\) be the time in months, with \(t = 0\) in January and \(t = 6\) in July. - Find a model \(T(t) = a\cos(bt) + d\) for the mean monthly temperature, the angle \(bt\) being in degrees.
- Use the model to estimate the mean temperature in April (\(t = 3\)) and in May (\(t = 4\)).
- Following the Method:
- principal axis: \(d = \dfrac{26 + 10}{2} = 18\);
- amplitude: \(|a| = \dfrac{26 - 10}{2} = 8\);
- the period is \(12\) months, so \(b = \dfrac{360}{12} = 30\) (degrees per month);
- at \(t = 0\) the temperature is at its maximum: the form \(a\cos(bt) + d\) with \(a > 0\), so \(a = 8\).
- $$\begin{aligned}[t] T(3) &= 8\cos 90^\circ + 18 = 8 \times 0 + 18 = 18,\\ T(4) &= 8\cos 120^\circ + 18 = 8 \times \left(-\frac{1}{2}\right) + 18 = 14. \end{aligned}$$ The model estimates about \(18^\circ\)C in April and \(14^\circ\)C in May.
Skills to practice
- Finding a Sinusoidal Model in Degrees
III
Exam-Style Questions
Skills to practice
- Working with Technology: Functions and Modelling
- Working with Technology: Further Functions and Modelling
Jump to section