International Baccalaureate · MYP 5 Extended
Bivariate Statistics
I
Association between Two Variables
I.1
Bivariate Data
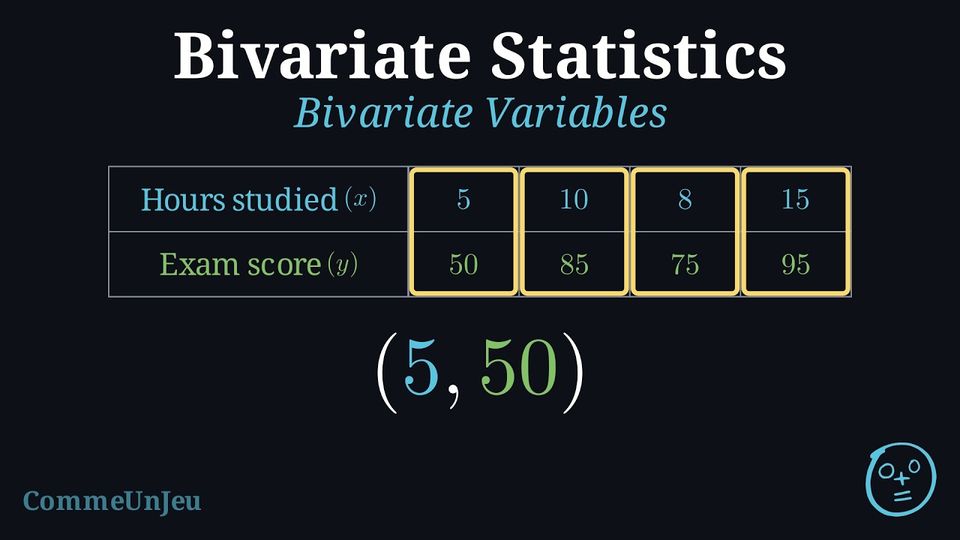
In univariate statistics, we analyse a single variable at a time. Bivariate statistics extends this analysis to explore the relationship between two variables. By examining pairs of data, we can investigate patterns, determine the nature and strength of their relationship, and use this relationship to make predictions. Bivariate statistics studies the relationship between two quantitative variables.
Definition — Bivariate Data
Bivariate data consists of pairs of values for two quantitative variables, recorded for each individual in a dataset. When one variable is studied as a possible explanation of the other, the pairs are written \((x, y)\), where: - \(x\) is the independent (or explanatory) variable.
- \(y\) is the dependent (or response) variable.
Example
A teacher records the hours each student studied (\(x\)) and their final exam score (\(y\)). | Hours Studied (\(x\)) | 5 | 10 | 8 | 15 |
| Exam Score (\(y\)) | 50 | 85 | 75 | 95 |
Skills to practice
- Identifying Explanatory and Response Variables
I.2
Scatter Plots
Definition — Scatter Plot
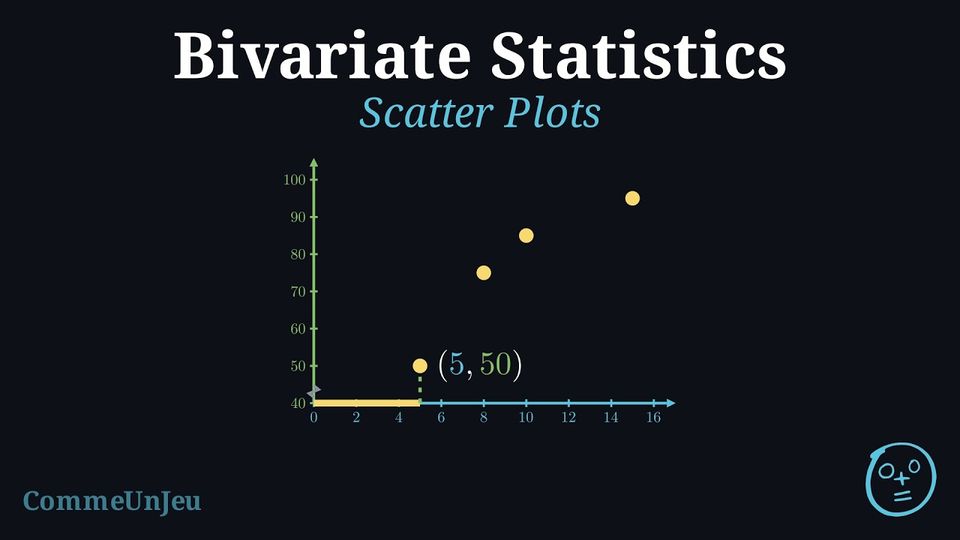
A scatter plot is a graph that displays bivariate data as a collection of points in the Cartesian plane. The independent (explanatory) variable is plotted on the horizontal axis (\(x\)-axis), and the dependent (response) variable is plotted on the vertical axis (\(y\)-axis).
A scatter plot is the primary tool for visually identifying a potential relationship, or correlation, between two quantitative variables.
Method — Constructing a Scatter Plot
- Identify Variables: Determine which variable is independent (\(x\)) and which is dependent (\(y\)).
- Set Up the Axes: Draw and label the horizontal axis for the \(x\)-variable and the vertical axis for the \(y\)-variable. Choose appropriate scales for both axes that cover the range of the data.
- Plot the Points: For each pair of (\(x, y\)) values in the dataset, plot a single point on the graph at the corresponding coordinates.
Example
A teacher recorded the number of hours students studied and their corresponding exam scores. The data is shown below: | Hours Studied (\(x\)) | 5 | 10 | 8 | 15 |
| Exam Score (\(y\)) | 50 | 85 | 75 | 95 |
- Variables: “Hours Studied” is the independent variable (\(x\)) and “Exam Score” is the dependent variable (\(y\)).
- Axes: The \(x\)-axis is labelled “Hours Studied” and the \(y\)-axis “Exam Score”. The scales cover the ranges of the data.
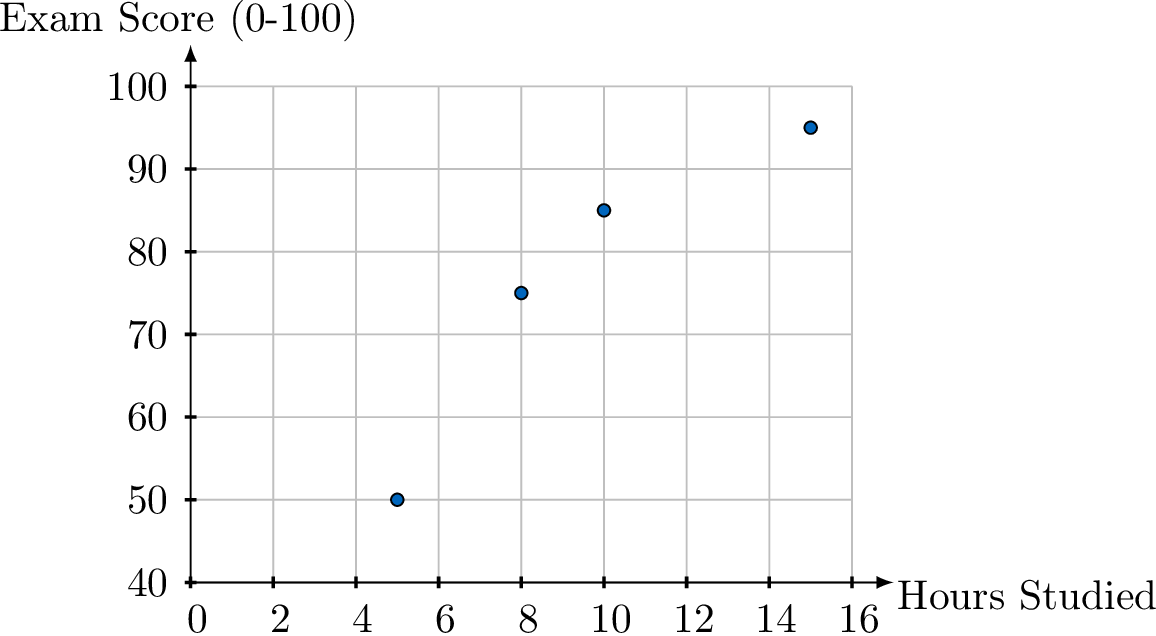
- Plot Points: We plot the four coordinate pairs: (5, 50), (10, 85), (8, 75), and (15, 95).
Skills to practice
- Reading Scatter Plots
- Plotting Scatter Plots
I.3
Describing a Correlation
Definition — Correlation
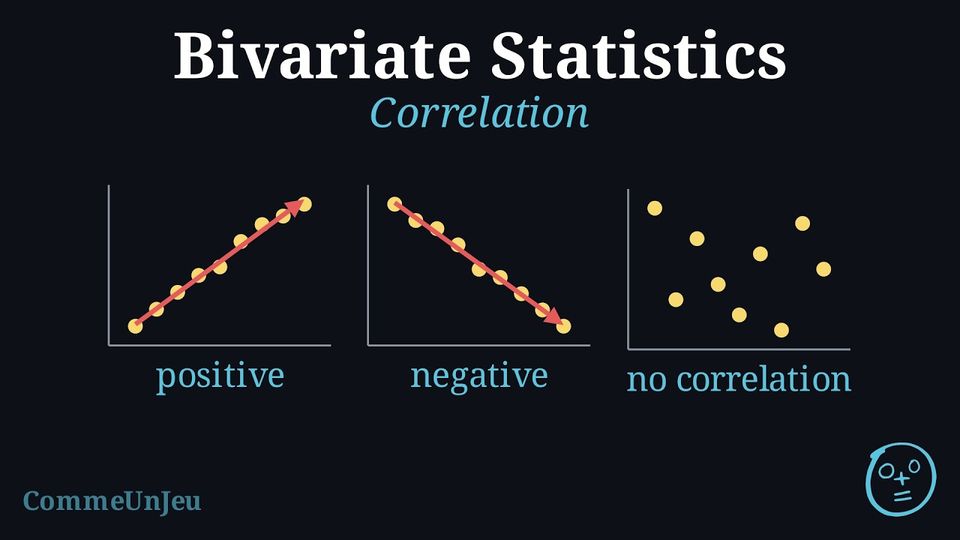
Correlation describes the nature of the relationship between two quantitative variables. Definition — Direction: Positive or Negative
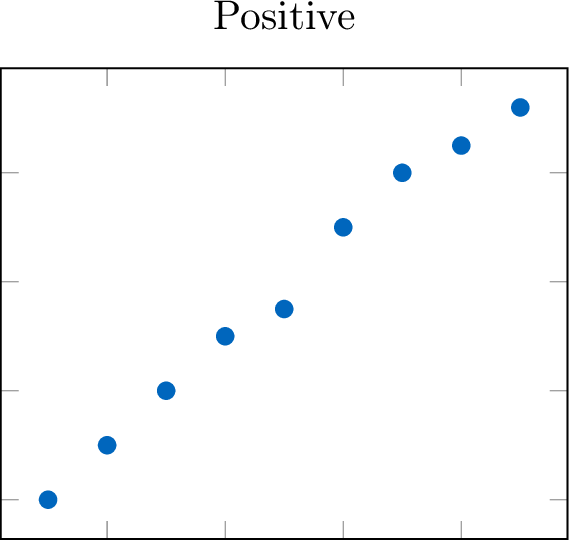
The direction describes the overall trend of the data. - Positive: As the independent variable (\(x\)) increases, the dependent variable (\(y\)) tends to increase. The points trend upward.
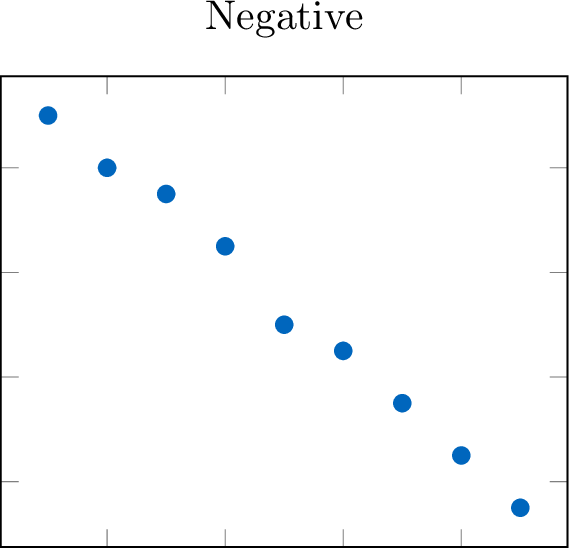
- Negative: As the independent variable (\(x\)) increases, the dependent variable (\(y\)) tends to decrease. The points trend downward.
Definition — Form: Linear or Non-linear
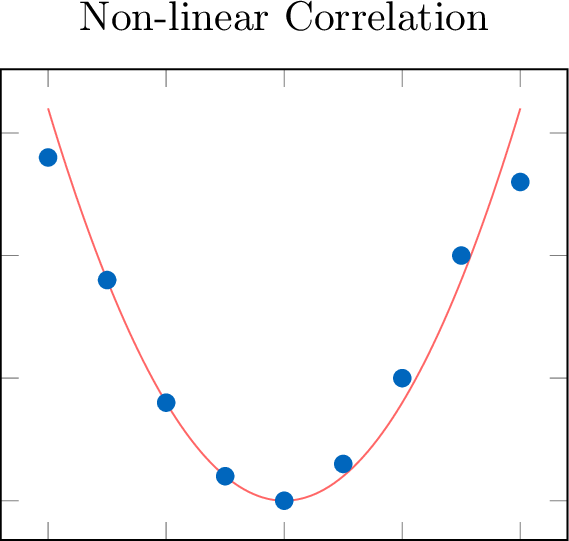
The form of the relationship is linear if the data points appear to follow a straight-line pattern. If they follow a curve other than a straight line, the form is non-linear. 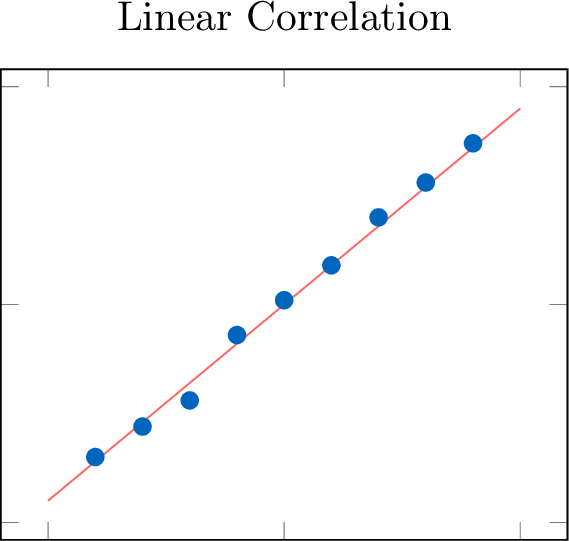
Definition — Strength
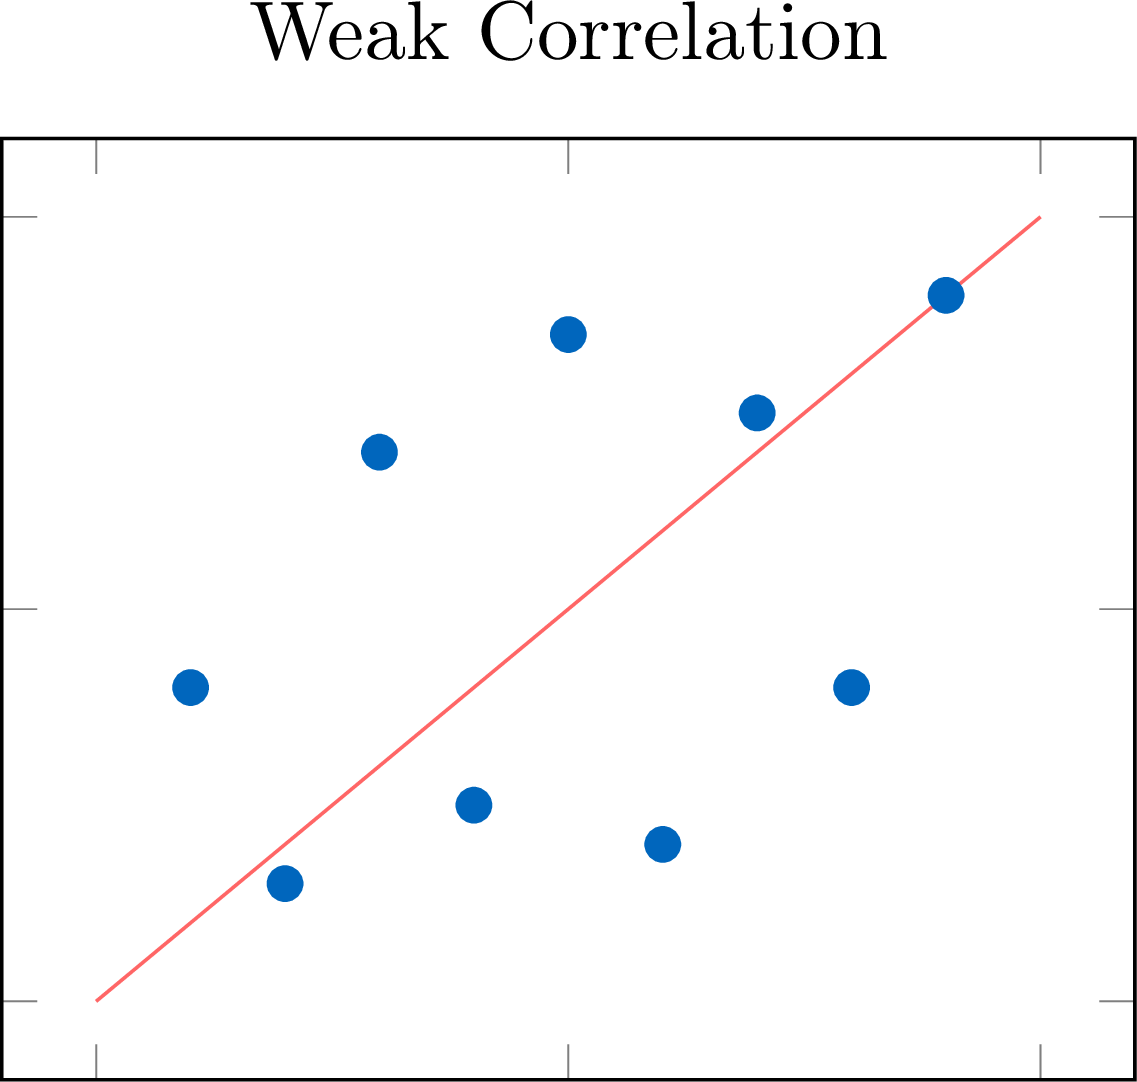
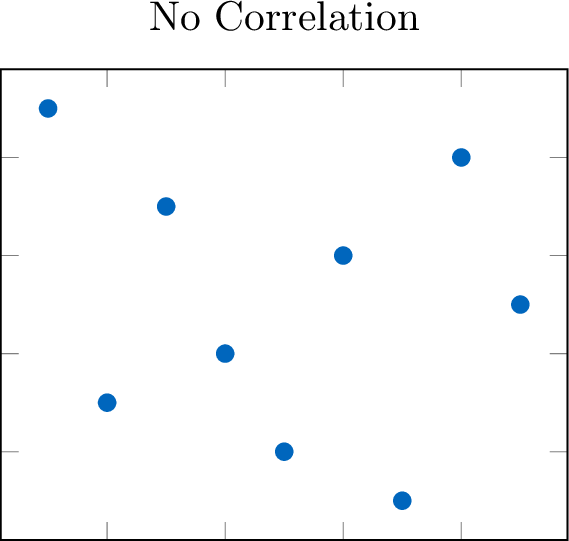
The strength of a correlation describes how closely the data points adhere to the identified form. 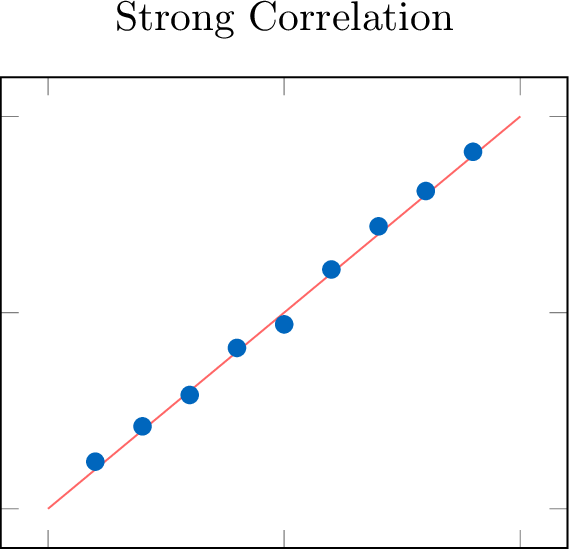
Definition — Outliers
An outlier is a data point that deviates significantly from the main pattern of the data. 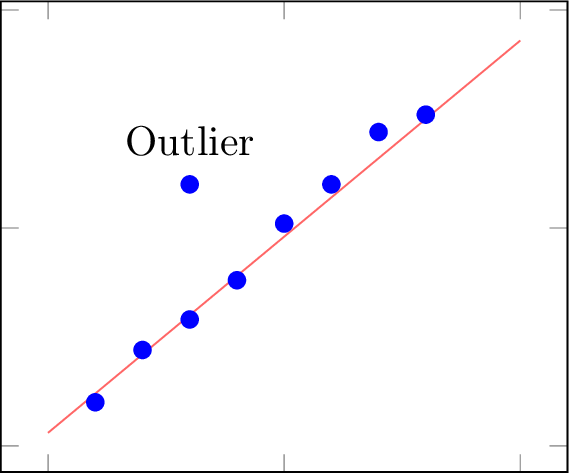
Method — Describing a Correlation
To describe the relationship shown in a scatter plot, we always comment on all four features in a concise statement. - Direction: Is the trend upward (positive), downward (negative), or neither?
- Form: Is it linear, non-linear, or without any clear form?
- Strength: Is it strong, moderate, or weak?
- Outliers: Are there any notable outliers?
Example
Describe the correlation between hours studied and exam scores shown in this scatter plot. 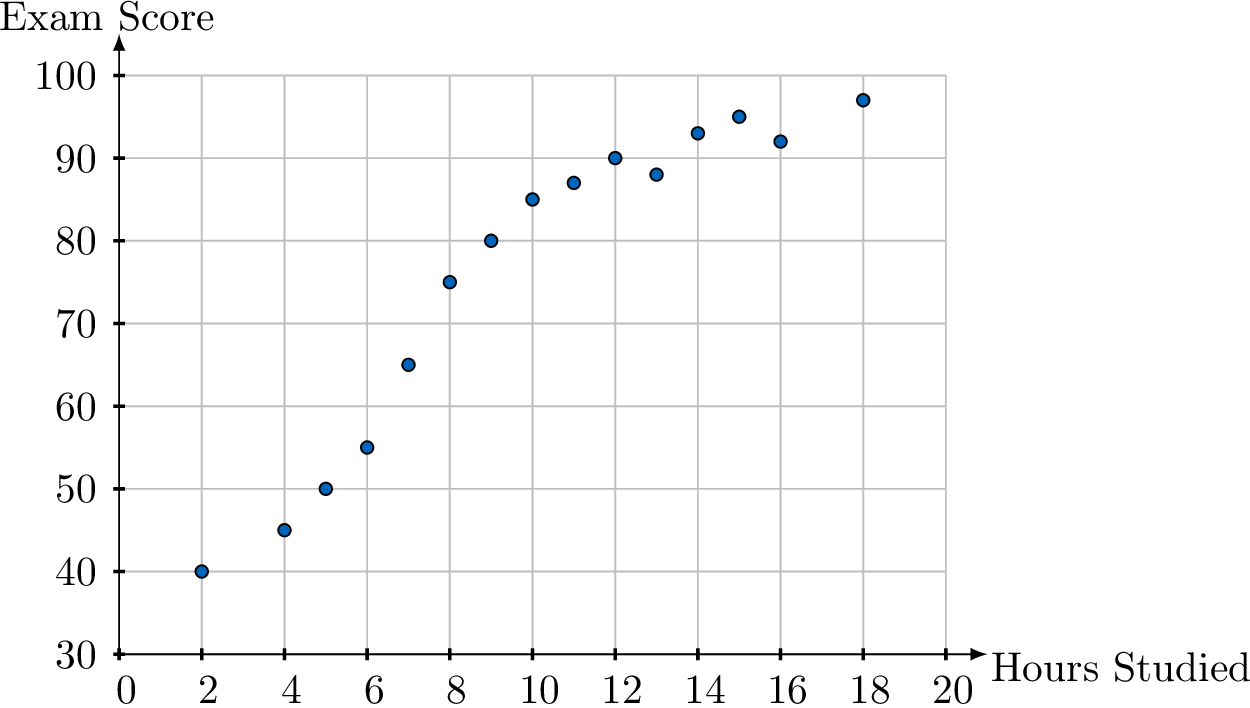
There is a strong, positive correlation between hours studied and exam scores: as the number of hours studied increases, the exam score tends to increase. Its form is not quite linear: the scores rise quickly up to about \(10\) hours, then level off, so the cloud bends. There are no obvious outliers.
Skills to practice
- Identifying the Direction of a Correlation
- Identifying the Strength of a Correlation
- Identifying the Form of a Correlation
- Interpreting Outliers in Context
I.4
Pearson's Correlation Coefficient
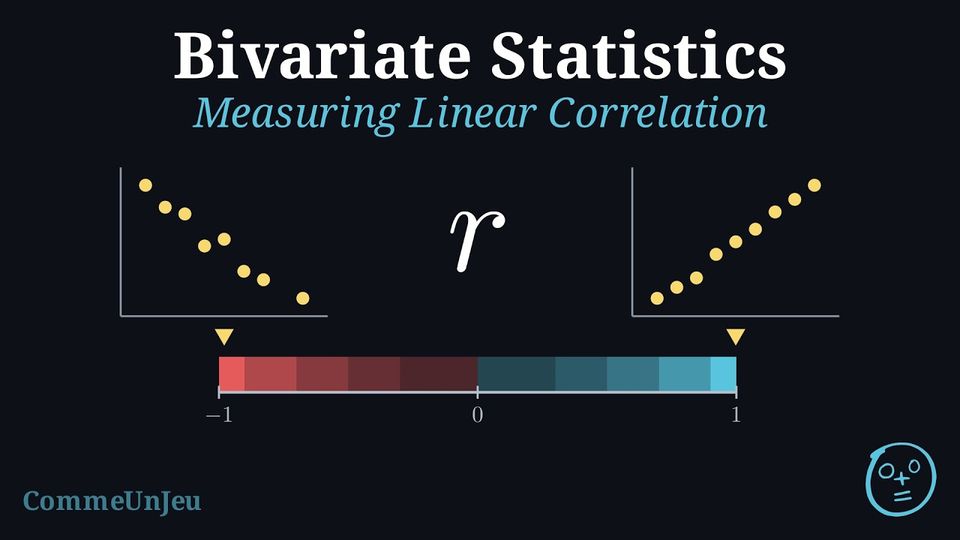
While scatter plots allow us to visually describe a correlation, this assessment is subjective. To provide a precise and objective measure of the strength and direction of a linear relationship, we use numerical coefficients.
Definition — Pearson's Correlation Coefficient (\(r\))
The Pearson's correlation coefficient (\(r\)) is a value in the range \([-1, 1]\) that quantifies the direction and strength of a linear relationship between two quantitative variables. - The sign of \(r\) indicates the direction (positive or negative).
- The magnitude (absolute value) of \(r\) indicates the strength. An \(|r|\) value close to 1 implies a strong linear correlation, while a value close to 0 implies a weak or no linear correlation.
| Value of \(|r|\) | Strength of Correlation |
| \(|r| = 1\) | Perfect |
| \(0.9 \le |r| < 1\) | Very Strong |
| \(0.7 \le |r| < 0.9\) | Strong |
| \(0.5 \le |r| < 0.7\) | Moderate |
| \(0.3 \le |r| < 0.5\) | Weak |
| \(0 \le |r| < 0.3\) | Very Weak or None |
Definition — Coefficient of Determination (\(r^2\))
The coefficient of determination (\(r^2\)) is the square of the correlation coefficient. It is a value in the range \([0, 1]\) and is typically expressed as a percentage.The value of \(r^2\) represents the proportion of the variance in the dependent variable (\(y\)) that is explained by the linear relationship with the independent variable (\(x\)). In simple terms, it tells us how well the linear model fits the data.
Example
A study of hours spent studying and exam scores finds a correlation coefficient of \(r = 0.9\).Interpret both \(r\) and \(r^2\).
- Interpretation of \(r\): Since \(r=0.9\), there is a very strong, positive, linear correlation between the hours spent studying and the exam scores.
- Interpretation of \(r^2\): We calculate \(r^2 = (0.9)^2 = 0.81\). This means that 81\(\pourcent\) of the variation in the exam scores can be explained by the linear relationship with the number of hours spent studying. The remaining 19\(\pourcent\) is unexplained by the linear model (other factors, measurement error, natural variability, etc.).
Method — Obtaining \(r\) and \(r^2\) with Technology
In this method, the correlation coefficient \(r\) is not computed by hand: a calculator or a spreadsheet gives it from the data, together with \(r^2\). - Enter the data: the values of \(x\) in one list (or one column), the values of \(y\) in another, in the same order, so that each pair stays on the same row.
- Ask for the two-variable statistics: on a calculator, the two-variable statistics menu gives \(r\) and \(r^2\); on many models they appear on the linear regression screen \(y = ax + b\), beside the coefficients \(a\) and \(b\) of the least squares line (on some models, the display of \(r\) and \(r^2\) must first be switched on in the settings, and some models show only \(r\)); in a spreadsheet, with \(x\) in
A2:A9and \(y\) inB2:B9, the formula=CORREL(A2:A9,B2:B9)gives \(r\) and=RSQ(B2:B9,A2:A9)gives \(r^2\). - Round only at the end: keep the full value on the screen and give \(r\) and \(r^2\) rounded, usually to three decimal places; \(r^2\) is the square of the unrounded \(r\), so when only \(r\) is displayed, square the full value of \(r\).
- Check with the scatter plot: the sign of \(r\) should agree with the general direction of the cloud, and \(|r|\) with how closely the points follow a line. When they disagree, check that each pair was entered on the same row, and look for an outlier, which can change \(r\) a lot.
Example
The coach of a running club records, for eight runners, the distance \(x\) run in training each week, in kilometres, and the time \(y\) of each runner in a \(5\) km race, in minutes. | \(x\) (km) | \(10\) | \(15\) | \(20\) | \(25\) | \(30\) | \(35\) | \(40\) | \(50\) |
| \(y\) (min) | \(31.5\) | \(30.2\) | \(29.8\) | \(27.9\) | \(28.3\) | \(26.4\) | \(25.9\) | \(24.8\) |
- Use technology to find \(r\) and \(r^2\), rounded to three decimal places.
- Describe the correlation between \(x\) and \(y\).
- Interpret \(r^2\) in the context.
- With the distances in L1 and the times in L2, the linear regression gives the screen below.
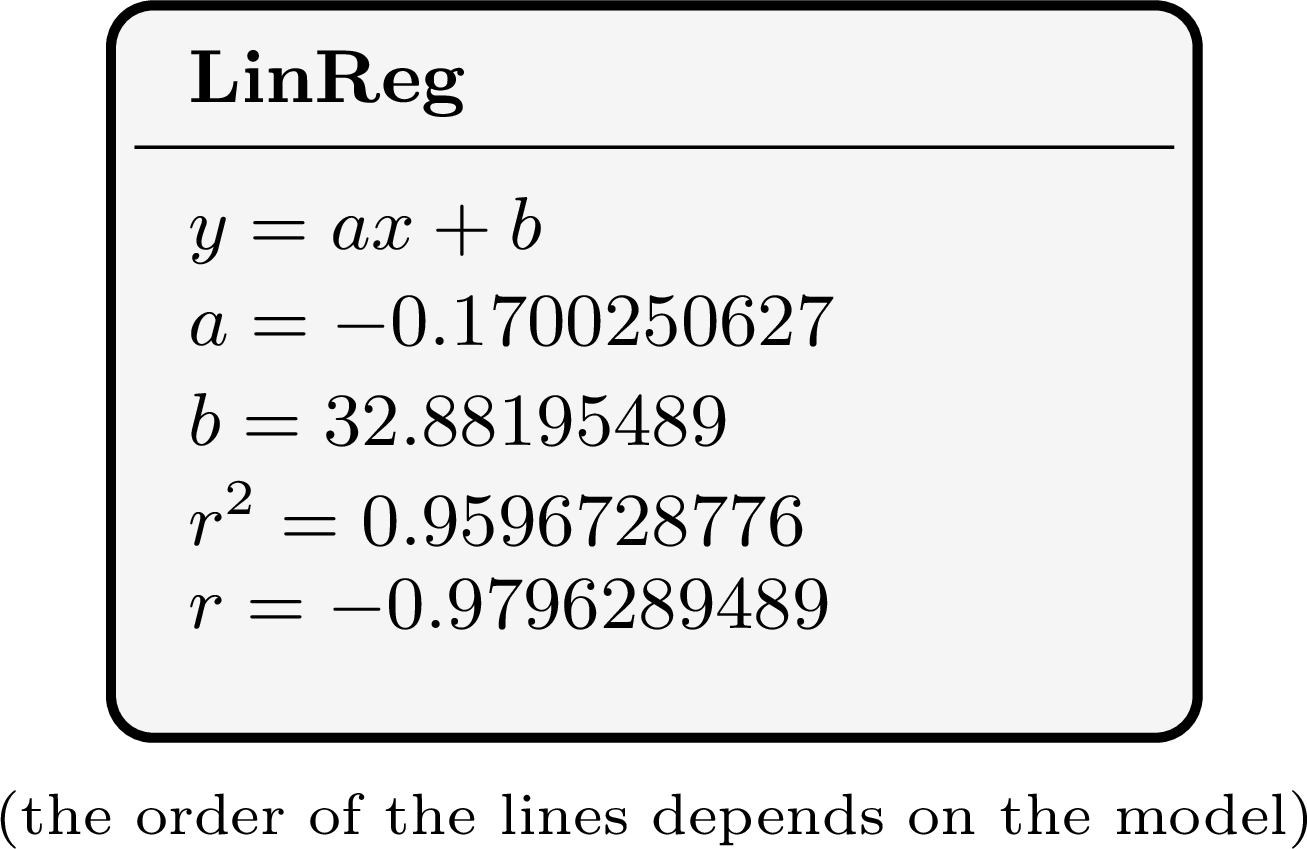
=CORREL(A2:A9,B2:B9)gives the same \(r\). - \(r\) is negative, so the correlation is negative: the runners who train more tend to have shorter race times. \(|r| \approx 0.980\) lies between \(0.9\) and \(1\), so the linear correlation is very strong. The sign agrees with the data: the times go down as the distances go up.
- \(r^2 \approx 0.960\): about \(96\pourcent\) of the variation in the race times is explained by the linear relationship with the training distance; the remaining \(4\pourcent\) is not explained by this linear relationship (other factors, measurement errors, natural variation). This is a correlation, not a proof that training alone makes the runners faster.
Skills to practice
- Estimating the Correlation Coefficient
- Computing the Correlation Coefficient with Technology
I.5
Correlation and Causation
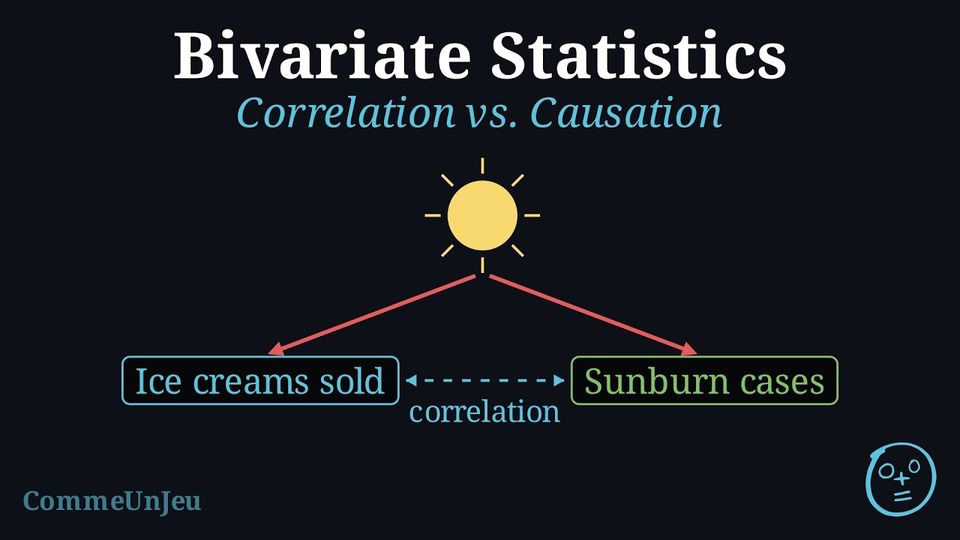
Correlation Does Not Imply Causation
Observing a statistical relationship (correlation) between two variables, \(x\) and \(y\), is not sufficient evidence to conclude that a change in \(x\) causes a change in \(y\).
Definition — Causation
Causation exists when a change in the independent variable produces — directly or through intermediate steps — a change in the dependent variable. The strongest evidence for causation comes from a carefully designed controlled experiment; observational data alone is rarely enough. Definition — Confounding Variable
Often, a correlation between two variables (\(x\) and \(y\)) is created or distorted by a third factor — observed or not — known as a confounding variable. This variable influences both \(x\) and \(y\), so that part or all of their correlation comes from it rather than from a direct link between \(x\) and \(y\). Example
Data shows a strong positive correlation between ice cream sales and the number of people who get sunburned.Does this mean eating ice cream causes sunburn? If not, identify the relationships and the likely confounding variable.
No, eating ice cream does not cause sunburn. 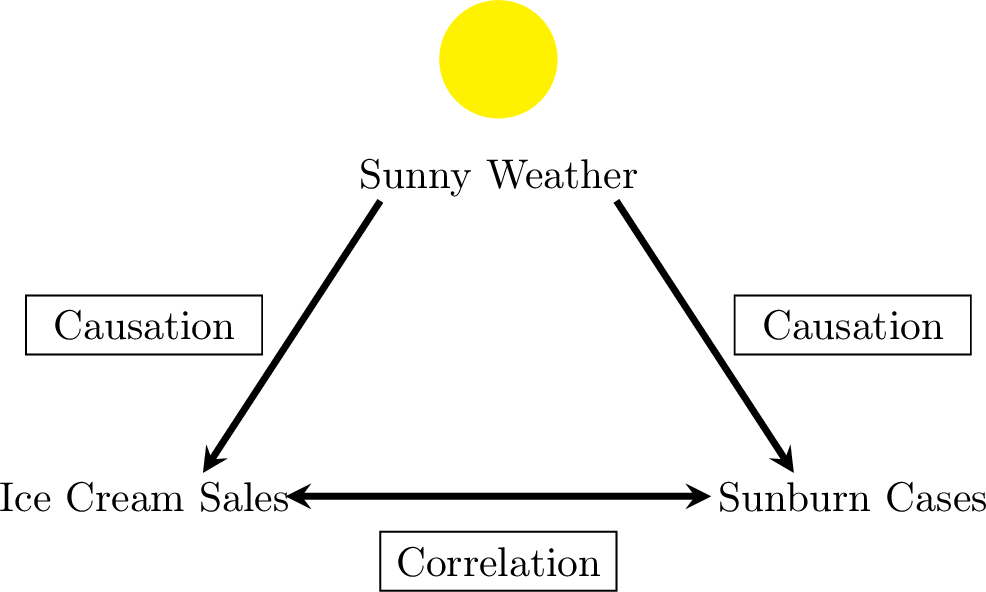
- The relationship between ice cream sales and sunburn cases is a correlation, not causation.
- The likely confounding variable is Sunny Weather. Hot and sunny days cause an increase in ice cream sales and also cause an increase in people getting sunburned.
Skills to practice
- Distinguishing Correlation from Causation
II
Lines of Best Fit
II.1
Line of Best Fit by Eye
Definition — Mean Point
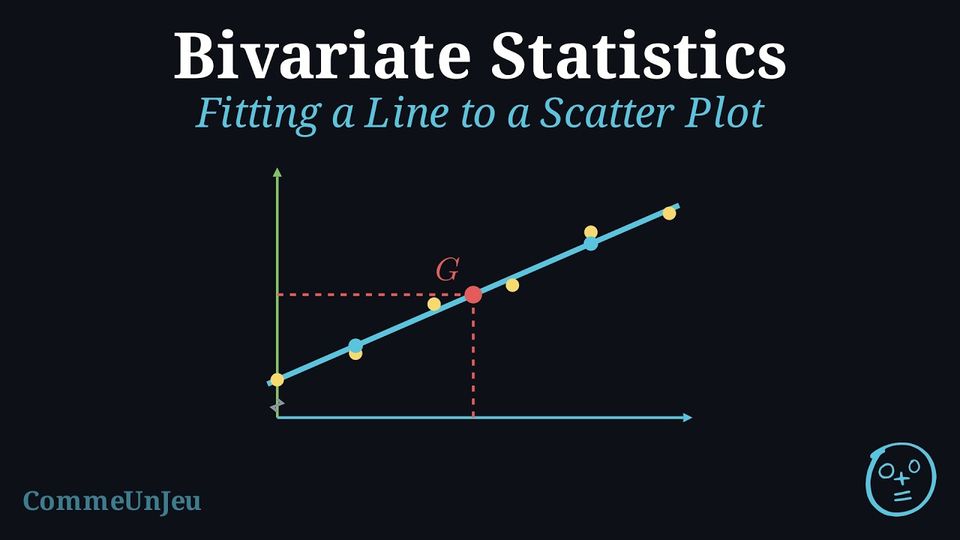
The mean point of a scatter plot with points \((x_1, y_1), (x_2, y_2), \ldots, (x_n, y_n)\) is the point \(G(\bar{x}, \bar{y})\) whose coordinates are the means of the two variables: $$\bar{x} = \frac{x_1 + x_2 + \cdots + x_n}{n} \qquad \text{and} \qquad \bar{y} = \frac{y_1 + y_2 + \cdots + y_n}{n}.$$ The mean point is the “centre of gravity” of the cloud: it is usually not one of the plotted points. Method — Fitting a Line by Eye
When the points of a scatter plot lie roughly along a straight line, one can fit a line to the cloud, that is, draw a line that follows the trend of the points: - Plot the mean point \(G\) and make the line pass through it.
- Follow the cloud: turn the line around \(G\) so that it follows the direction of the points, with all of them as close to it as possible — as a rough check, the points should be spread on both sides of the line.
- Read its equation \(y = ax + b\) on the graph (two points of the line give \(a\), then \(b\)).
Example
A delivery driver records, for six deliveries, the distance \(x\), in kilometres, and the time \(y\) taken, in minutes. | \(x\) (km) | \(1\) | \(3\) | \(5\) | \(7\) | \(9\) | \(11\) |
| \(y\) (min) | \(9\) | \(11\) | \(19\) | \(21\) | \(27\) | \(33\) |
- Draw the scatter plot and compute the coordinates of the mean point \(G\).
- Fit a line by eye through \(G\), then read its equation \(y = ax + b\) on the graph.
- Use the line to estimate the time taken by a delivery of \(8\) km.
- \(\bar{x} = \dfrac{1 + 3 + 5 + 7 + 9 + 11}{6} = \dfrac{36}{6} = 6\) and \(\bar{y} = \dfrac{9 + 11 + 19 + 21 + 27 + 33}{6} = \dfrac{120}{6} = 20\): \(G(6, 20)\).
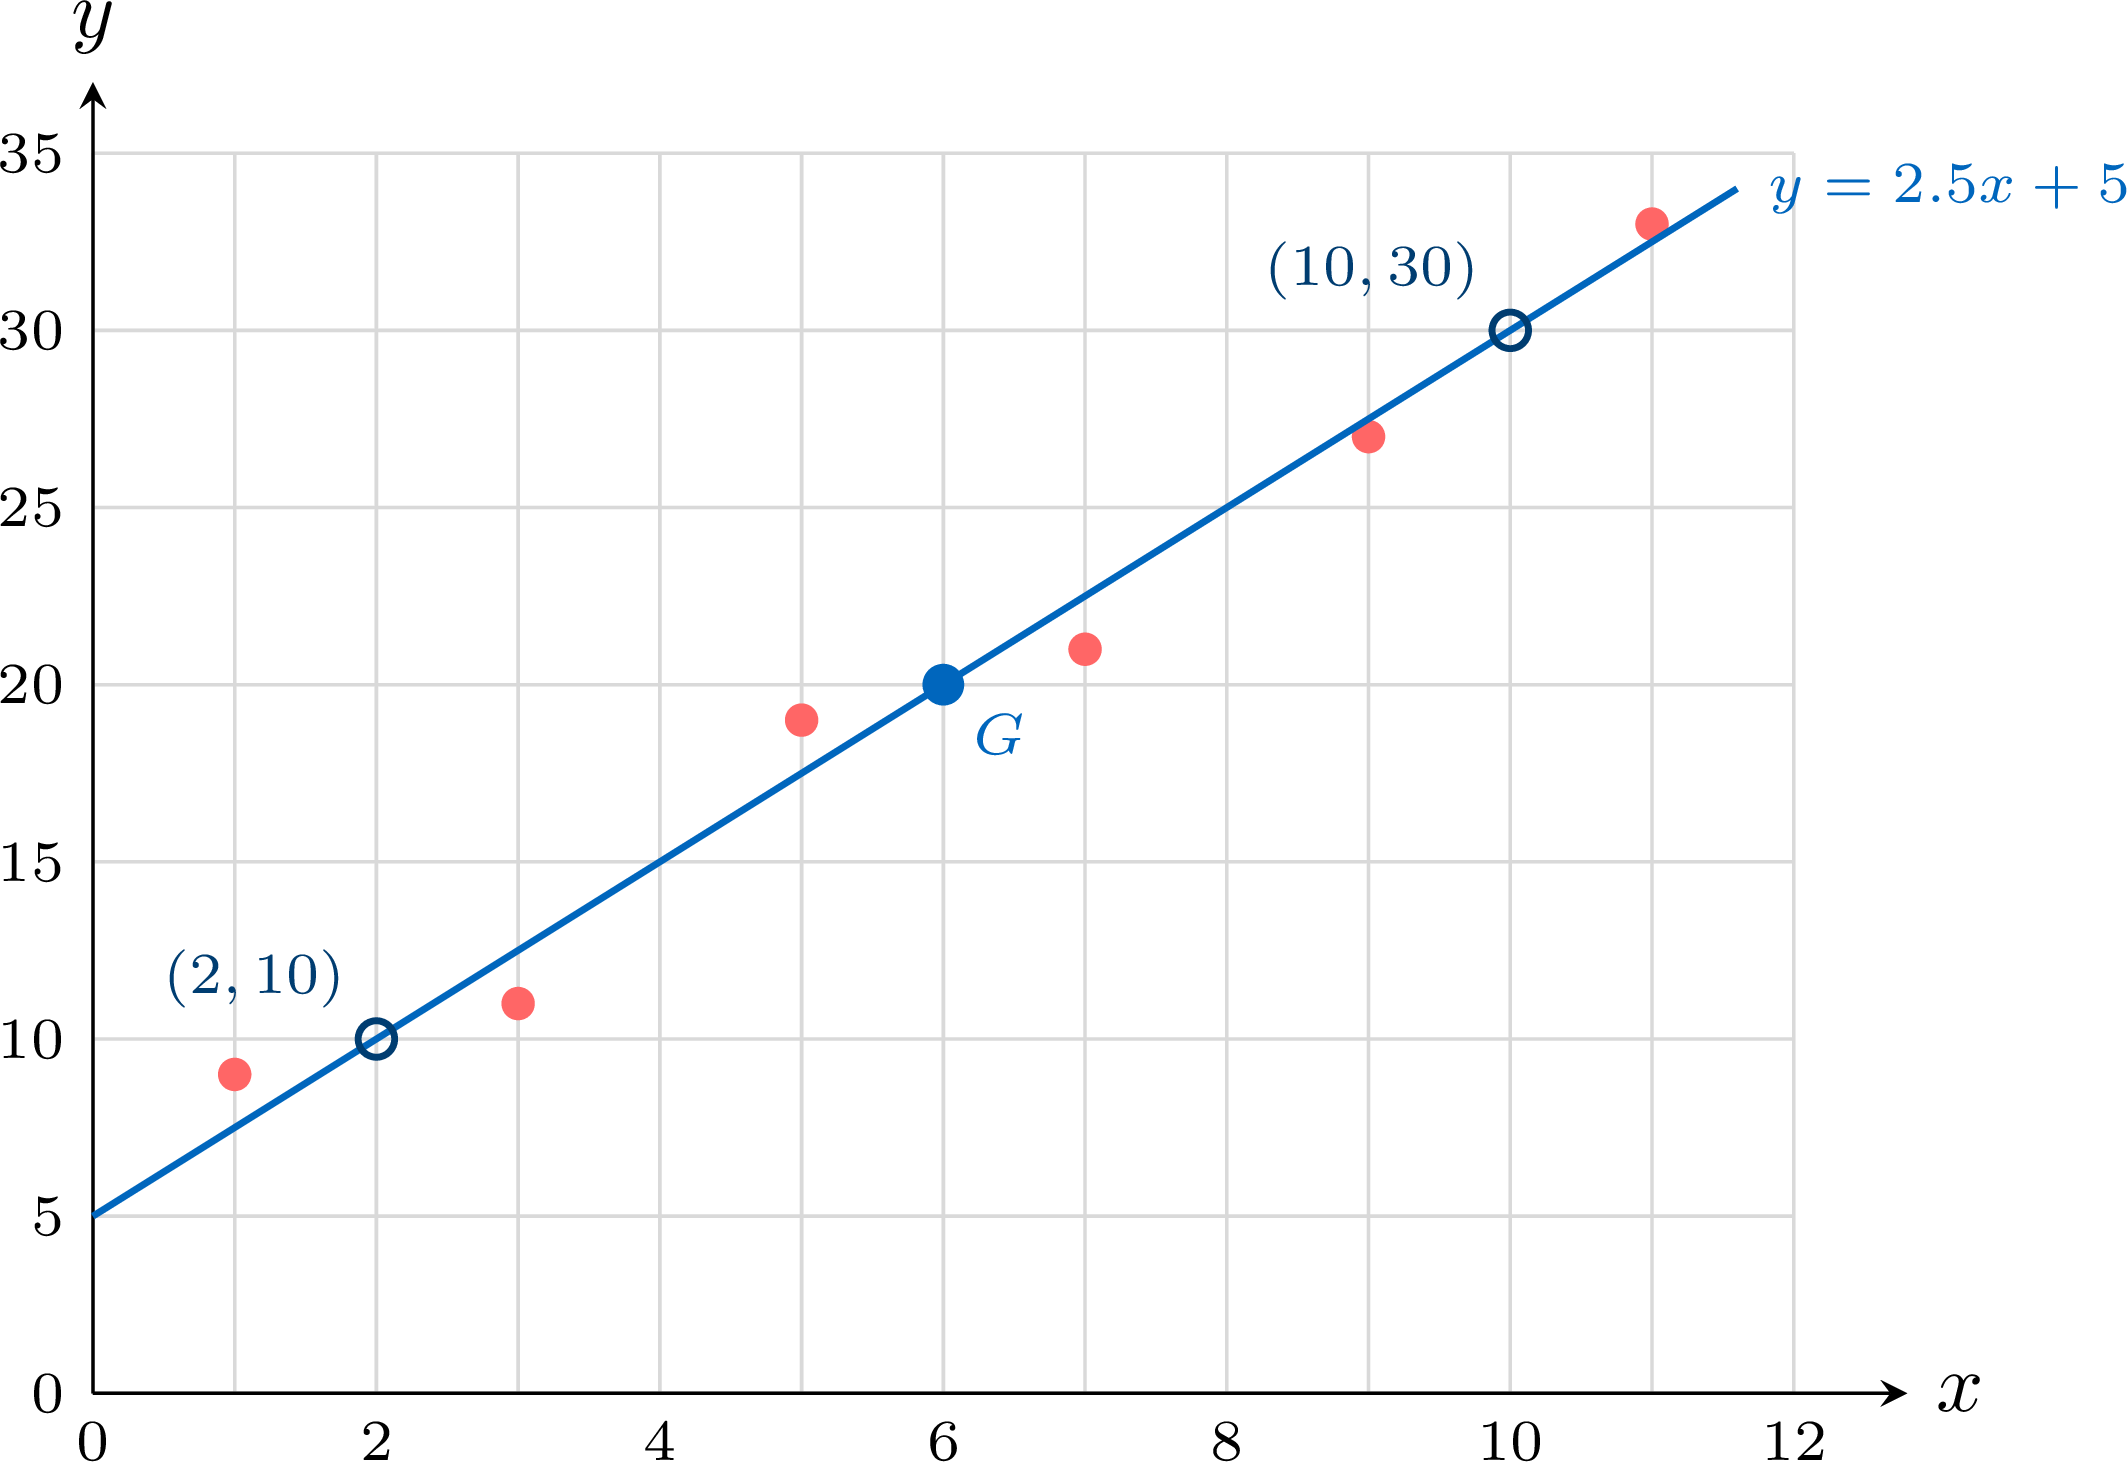
- The line is drawn through \(G\), then turned around \(G\) until it follows the direction of the cloud: three points lie above it and three below. It passes through the points \((2, 10)\) and \((10, 30)\) of the grid, so its gradient (also called slope) is \(a = \dfrac{30 - 10}{10 - 2} = \dfrac{20}{8} = 2.5\), and \(b = 10 - 2.5 \times 2 = 5\): the line has equation \(y = 2.5x + 5\). Check: \(2.5 \times 6 + 5 = 20 = \bar{y}\), so \(G\) is on the line.
- \(x = 8\) lies between \(1\) and \(11\), inside the range of the data: \(y = 2.5 \times 8 + 5 = 25\). A delivery of \(8\) km takes about \(25\) minutes.
Skills to practice
- Estimating the Line of Best Fit by Eye
- Computing the Mean Point
II.2
The Least Squares Regression Line
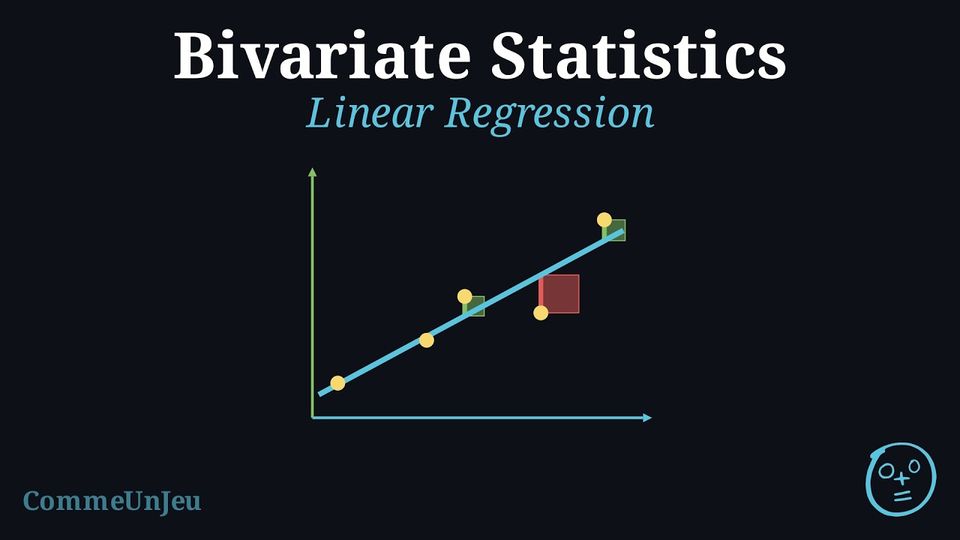
When a scatter plot indicates a linear correlation between two variables, we can model this relationship using a straight line. This line, known as the regression line, can be used to make predictions. The reliability of this model is often assessed using the coefficient of determination (\(r^2\)). A high \(r^2\) value indicates that a large proportion of the variance in the dependent variable is explained by the independent variable, suggesting the linear model is a good fit for the data.
Definition — Least Squares Regression Line
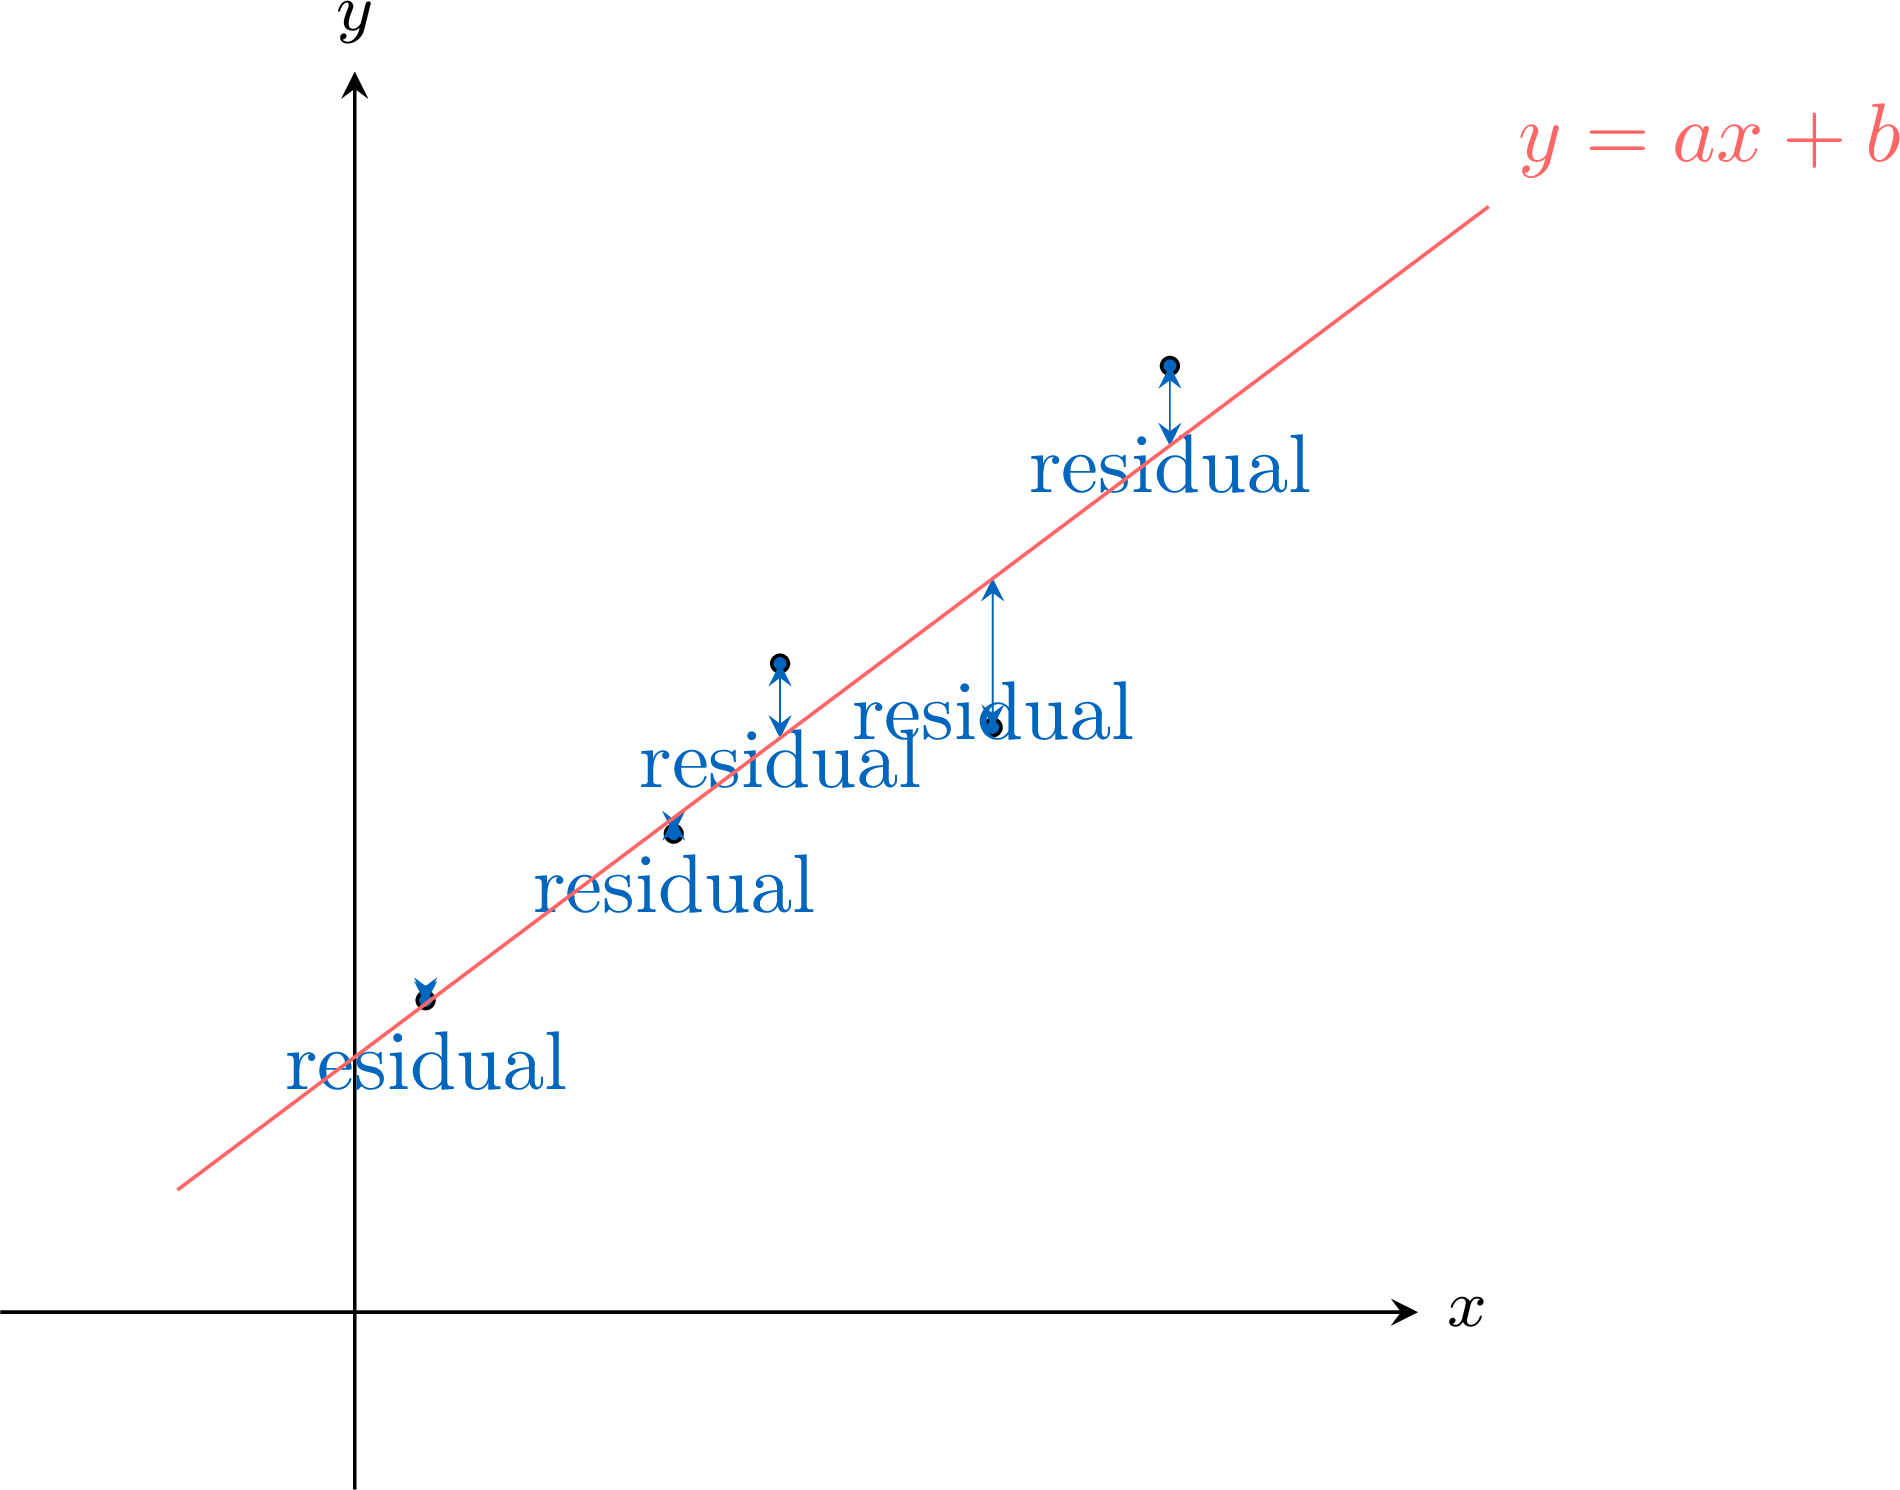
The least squares regression line, written as \(y = ax + b\), is the unique line of best fit (provided the \(x\)-values are not all equal) that models the linear relationship between \(x\) and \(y\). It is calculated by minimising the sum of the squares of the residuals.A residual is the signed vertical difference (positive above the line, negative below) between an observed data point \((x_i, y_i)\) and the predicted point on the regression line \((x_i, \hat{y}_i)\).$$ \text{Residual} = \text{observed } y - \text{predicted } y = y_i - \hat{y}_i $$ A key property is that the least squares regression line always passes through the mean point, \((\bar{x}, \bar{y})\).
Method — Obtaining the Least Squares Line with a Calculator or a Spreadsheet
The coefficients \(a\) and \(b\) of the least squares line \(y = ax + b\) are not computed by hand: a calculator or a spreadsheet gives them. - Enter the data: the values of \(x\) in one list (or one column), the values of \(y\) in another, in the same order.
- Ask for the line: on a calculator, the two-variable statistics menu, linear regression \(y = ax + b\); in a spreadsheet, with \(x\) in
A2:A6and \(y\) inB2:B6, the formulas=SLOPE(B2:B6,A2:A6)and=INTERCEPT(B2:B6,A2:A6), or a linear trend line added to the scatter plot, with its equation displayed. - Round sensibly: keep about as many significant figures as the measurements have, and write the equation with the letters of the situation.
- Check with the mean point: the least squares line passes through \(G(\bar{x}, \bar{y})\); replacing \(x\) by \(\bar{x}\) in the equation must give \(\bar{y}\), up to rounding.
Example
A laboratory prepares five solutions of known concentration \(x\), in milligrams per litre, and measures the absorbance \(y\) of each one. | \(x\) | \(2\) | \(4\) | \(6\) | \(8\) | \(10\) |
| \(y\) | \(0.11\) | \(0.19\) | \(0.31\) | \(0.40\) | \(0.49\) |
- Give, with a calculator, the equation of the least squares line, with \(a\) rounded to four decimal places and \(b\) to three.
- Check that this line passes through the mean point.
- Predict the absorbance of a solution of concentration \(7\) mg/L.
- A sample of unknown concentration has an absorbance of \(0.35\). Here the measured value is \(y\): use the same equation the other way round to estimate its concentration.
- The calculator gives \(a = 0.0485\) and \(b = 0.009\): the calibration line is \(y = 0.0485x + 0.009\) (the gradient is kept with three significant figures).
- \(\bar{x} = 6\) and \(\bar{y} = 0.30\). For \(x = 6\) the equation gives \(0.0485 \times 6 + 0.009 = 0.300\): the line passes through \(G(6, 0.30)\).
- \(0.0485 \times 7 + 0.009 = 0.3485\): the expected absorbance is about \(0.35\).
- Solve \(0.0485x + 0.009 = 0.35\): \(x = \dfrac{0.35 - 0.009}{0.0485} \approx 7.0\). The concentration is about \(7.0\) mg/L. This value lies between \(2\) and \(10\) mg/L, the smallest and the largest concentrations measured: the line is used inside the range where it was fitted.
Definition — Interpolation and Extrapolation
The line of best fit can be used to make predictions: - Interpolation is the process of predicting a \(y\)-value for an \(x\)-value that is within the range of the original data. If the correlation is strong, interpolation is generally considered reliable (provided the linear model fits the data well).
- Extrapolation is the process of predicting a \(y\)-value for an \(x\)-value that is outside the range of the original data. Extrapolation is generally considered unreliable, as we cannot assume the linear trend continues indefinitely.
Example
For a survey of hours studied and exam scores (out of \(100\)), a calculator gives the line of best fit \(y = 3.5x + 40\). In this dataset, the hours studied ranged from 2 to 15. - Predict the exam score for a student who studied for 11 hours.
- Predict the exam score for a student who studied for 25 hours.
- Comment on the reliability of the prediction in question 2.
- Since \(x=11\) is within the data range, this is interpolation. $$ y = 3.5(11) + 40 = 38.5 + 40 = 78.5 $$ The predicted score is 78.5.
- Since \(x=25\) is outside the data range, this is extrapolation. $$ y = 3.5(25) + 40 = 87.5 + 40 = 127.5 $$ The predicted score is 127.5.
- The prediction in question 2 is unreliable. It is an extrapolation, and we cannot assume the linear relationship holds for 25 hours of study. Furthermore, the model predicts a score over 100, which is impossible in this context, highlighting the danger of extrapolation.
Skills to practice
- Comparing Lines with the Sum of the Squares
- Judging and Using a Linear Model
- Using a Line of Best Fit
- Fitting a Line in Context with a Calculator
III
Going further
Skills to practice
- Reasoning About Bivariate Data
- Investigating Patterns in the Correlation Coefficient
- Quiz
Jump to section