Statistics
Statistical Investigation Process
A Step-by-Step Investigation
Statistics are all around us, from sports averages to news reports about the weather.
- A basketball player averages 14.6 points per game.
- Last year was the hottest year on record since 1897.
Definition Statistics
Statistics is the science of designing investigations and then collecting, organizing, analyzing, and interpreting data to answer a specific question.
Method The Statistical Investigation Process
A rigorous statistical investigation follows five key steps:
- Pose the Question: Define a clear research problem, identifying the target population and the variables to be investigated.
- Collect Data: Design a data collection plan and gather information using an appropriate sampling method.
- Analyze Data: Calculate relevant descriptive statistics to summarize the data numerically. This includes calculating relative frequencies (percentages), measures of central tendency (mean, median, mode), and measures of spread (standard deviation, IQR).
- Represent Data: Structure the raw data into tables (e.g., a frequency table showing counts/tallies) and create initial visual representations (e.g., histograms, bar charts) to see the distribution.
- Interpret and Conclude: Make inferences from the analysis, provide a conclusion that answers the initial question, and critically evaluate the limitations of the investigation.
Step 1: Posing the Question
Key Concepts of the Inquiry
Definition Statistical Problem
A statistical problem is a clear, focused question that can be answered by collecting and analyzing data.
Example
Let's investigate the problem: "What is the favorite school subject of students at our school?"
Definition Population
In statistics, a population is the complete set of all individuals, items, or events that share a common, well-defined characteristic of interest for an investigation.
Example
For our problem, the population is all students at our school.
Definition Data
Data is the information we collect, like numbers, words, measurements, or observations.
Example
The data we collect will be the list of answers from each student, such as "Math", "Art", "Science", "Art", "Sport", etc.
Definition Types of Variables
A variable is a characteristic of an individual in the population that can take different values. Variables are classified into two main types:
- Qualitative Variable (Categorical): Represents characteristics that belong to a category or group (e.g., eye color, type of car, favorite subject).
- Quantitative Variable (Numerical): Represents characteristics that can be counted or measured numerically. These can be further divided into:
- Discrete: The variable can only take specific, separate numerical values (often integers). It is typically data that is counted.
- Continuous: The variable can take any numerical value within a given range. It is typically data that is measured.
Example
Let's classify some variables from a student survey:
- The variable "Favorite Subject" is qualitative.
- The variable "Number of siblings" is a discrete quantitative variable, as the answers can only be integers (0, 1, 2, ...).
- The variable "Height in centimeters" is a continuous quantitative variable, as a student's height could be any value within a range (e.g., 165.2 cm, 165.25 cm, etc.).
Survey Design and Question Formulation
The primary goal of survey design is to collect data that is both valid (measures what it intends to measure) and reliable (consistent). The formulation of questions is critical to achieving this, as it directly impacts the quality of the collected data and introduces or minimizes potential for bias.
Definition Structured (Closed-Ended) Questions
Structured questions provide respondents with a predefined set of answers to choose from.
- Advantages: Easy to code and analyze statistically; yields quantitative or easily categorized qualitative data.
- Disadvantages: May limit the respondent's true opinion; can introduce bias if options are not well-designed.
Definition Unstructured (Open-Ended) Questions
Unstructured questions allow respondents to answer in their own words, providing rich, detailed information.
- Advantages: Yields deep qualitative insights; can reveal unexpected perspectives.
- Disadvantages: Difficult and time-consuming to analyze; responses can be hard to compare and quantify.
Method Principles of Effective Question Design
To minimize bias and ensure data quality, survey questions should adhere to the following principles:
- Avoid Ambiguity and "Double-Barreled" Questions. A question should only ask one thing. (e.g., Avoid “How satisfied are you with the cafeteria food and the library hours?”).
- Avoid Leading or Biased Phrasing. Questions should be neutral and not suggest a "correct" answer (e.g., Avoid “Don’t you agree that the new environmental policy is an excellent idea?”).
- Ensure Clarity and Simplicity. Use language that is easily understood by the entire sample population.
- Provide Mutually Exclusive and Exhaustive Options (for closed questions). Options should not overlap, and all possible responses should be covered (often by including an "Other" category).
Example
After finding out a student's favorite subject, an investigator wants to gather more detailed information. Compare a structured vs. an unstructured follow-up question they could ask.
- Unstructured Follow-up Question: "Why is that subject your favorite?"
- Data Type: This yields rich, open-ended qualitative data (e.g., "I like solving problems," "The teacher is inspiring," "It feels creative").
- Analysis: This data provides deep insights into the reasons behind preferences but is difficult to quantify or graph directly. It requires thematic analysis rather than numerical calculation.
- Structured Follow-up Question: "How many hours per week do you dedicate to your favorite subject?"
- Data Type: This yields quantitative data. The answers are numerical.
- Analysis: This data is easy to tally and visualize in a histogram or frequency table. It allows for the estimation of central tendency (e.g., the modal interval).
Step 2: Collecting Data
Census vs. Sampling
When we conduct an investigation, we must decide who to collect data from. Do we ask everyone in the population, or just a smaller group?
Definition Census vs. Survey
- A census collects data from every single member of the population. It is accurate but can be very slow and expensive for large populations.
- A survey (or sampling) collects data from a smaller, manageable group taken from the population, called a sample. It is much faster, but the sample must be chosen carefully to be representative of the whole population.
Example
An investigation asks: "What is the favorite subject of students at this school?"
If you ask every student in the school, is it a census or a survey?
If you ask every student in the school, is it a census or a survey?
It is a census because you are collecting data from the entire population (all students in the school).
Example
An investigation asks: "What is the favorite subject of students at this school?"
If you only ask the students in your math class, is it a census or a survey?
If you only ask the students in your math class, is it a census or a survey?
It is a survey because you are only collecting data from a small sample (your math class) of the total population (the whole school).
Sampling Methods and Potential for Error
When conducting a survey, our goal is to select a sample that is representative of the entire population. The method used to select this sample is critical. A poorly chosen method can lead to a biased sample, where certain parts of the population are over- or under-represented, making the conclusions invalid.
Definition Probability Sampling
In probability sampling, every member of the population has a known, non-zero chance of being selected. These methods are designed to be unbiased.
- Simple Random Sampling: Every member has an equal chance of selection.
Example: Drawing 3 names from a hat containing all 30 students' names. - Systematic Sampling: Members are selected at a regular interval (\(k\)) from an ordered list, starting from a random point between 1 and \(k\).
Example: Surveying every 20th customer entering a store. - Stratified Sampling: The population is divided into subgroups (strata), and a simple random sample is taken from each stratum, often proportional to its size.
Example: A school with 40\(\pourcent\) boys and 60\(\pourcent\) girls takes a random sample of 40 boys and 60 girls.
Definition Non-Probability Sampling
In non-probability sampling, the selection of the sample is not random and is often based on the researcher's judgment or convenience. These methods are highly prone to bias.
- Convenience Sampling: Selecting the most easily accessible members of the population.
Example: Surveying only your own friends about a school-wide issue. - Quota Sampling: Similar to stratified sampling, but individuals within each subgroup are selected non-randomly (e.g., by convenience) until a quota is met.
Example: A researcher needs 30 male and 30 female participants and simply surveys the first 30 of each gender they meet.
Definition Total Survey Error
The total survey error is the difference between a sample statistic and the true population parameter. It is composed of two types of error:
- Sampling Error: Natural, random variation due to observing a sample instead of the whole population.
- Non-Sampling Error: Systematic errors arising from the survey design, such as selection bias or measurement error.
Definition Selection Bias
Selection bias occurs when the sampling method systematically excludes certain parts of the population, leading to an unrepresentative sample.
Example
A famous example is the Literary Digest poll of 1936, which sampled from phone books and car registrations, thus excluding poorer voters and incorrectly predicting the election outcome.
Definition Measurement Error
Measurement error refers to inaccuracies in the data that arise during the collection process itself. Common causes include:
- Poorly worded questions: Ambiguous, "double-barreled," or leading questions that confuse or influence the respondent.
- Response bias: Respondents provide inaccurate answers due to social desirability (wanting to appear favorable) or misunderstanding the question.
Example
A survey asks students: "Don't you agree that amazing Mathematics is the most important subject for your future?"
Identify the source of error.
Identify the source of error.
This is a source of measurement error. The question is leading for two reasons:
- It uses the biased adjective "amazing" to describe mathematics.
- It uses the phrase "Don't you agree," which pressures the respondent to answer "Yes."
Step 3: Analyzing Data
Frequencies
Definition Frequency and Relative Frequency
Frequency (or count) is how many times each category appears in our data.
Relative frequency is the proportion of the data that falls into a category. We can write it as a fraction, a decimal, or a percentage.$$ \text{Relative frequency (in }\pourcent\text{)} = \frac{\text{Frequency}}{\text{Total number of data values}} \times 100\pourcent $$
Relative frequency is the proportion of the data that falls into a category. We can write it as a fraction, a decimal, or a percentage.$$ \text{Relative frequency (in }\pourcent\text{)} = \frac{\text{Frequency}}{\text{Total number of data values}} \times 100\pourcent $$
Example
Let's calculate the relative frequency for our "Favorite Subject" survey of 25 students:
| Subject | Frequency | Relative Frequency |
| Math | 8 | \(8/25\times 100\pourcent = 32\pourcent\) |
| Science | 5 | \(5/25\times 100\pourcent = 20\pourcent\) |
| Sport | 7 | \(7/25\times 100\pourcent = 28\pourcent\) |
| Art | 5 | \(5/25\times 100\pourcent = 20\pourcent\) |
| Total | 25 | 100\(\pourcent\) |
Central Tendency
Definition Measures of Central Tendency
A measure of central tendency is a single value that attempts to describe a set of data by identifying the central position within that set. The main measures are the mean, median, and mode.
Definition Mode
The mode is the value or category that appears most frequently. A dataset can have more than one mode.
Example
The results of the "Favorite Subject" survey are shown in the frequency table below.
| Subject | Frequency |
| Math | 8 |
| Science | 5 |
| Sport | 7 |
| Art | 5 |
The mode is the category with the highest frequency. By looking at the table, the highest frequency is 8.
The subject corresponding to this frequency is Math. Therefore, the mode is Math. This means it is the favorite subject.
The subject corresponding to this frequency is Math. Therefore, the mode is Math. This means it is the favorite subject.
Definition Mean
The mean is the sum of all numerical values divided by the count of values. It is often called the "average."$$\begin{aligned} \bar{x} &= \frac{\text{sum of all values}}{\text{number of values}} \\
&= \frac{x_1 + x_2 + x_3 + \dots + x_n}{n}\end{aligned}$$
Example
For the dataset \(1, 4, 2, 3, 5, 4, 5, 4, 4\), what is the mean?
$$ \text{Mean} = \frac{1 + 4 + 2 + 3 + 5 + 4 + 5 + 4 + 4}{9} = \frac{32}{9} \approx 3.56 $$
Definition Median
The median is the middle value of a dataset that has been ordered from least to greatest.
- If there is an odd number of values, the median is the single middle value.
- If there is an even number of values, there are two middle values and the median is the mean of these two values.
Example
For the dataset \(1, 4, 2, 3, 5, 4, 5, 4, 4\), what is the median?
- Order the data: \(1, 2, 3, 4, 4, 4, 4, 5, 5\).
- Find the middle value: There are 9 values (an odd number), so the middle value is the 5th one. $$1, 2, 3, 4, \underline{4}, 4, 4, 5, 5$$
Spread
Definition Measures of Spread (Dispersion)
A measure of spread (or dispersion) describes how varied or "spread out" the values in a dataset are. While central tendency tells us about the center, spread tells us about the consistency of the data. The main measures are the range, interquartile range (IQR), and standard deviation.
Example
Consider the test scores of two students:
- Student A's scores: 10, 50, 90
- Student B's scores: 45, 50, 55
Definition Range
The range is the difference between the maximum and minimum values in a dataset. It gives a quick measure of the total spread.$$ \text{Range} = \text{Maximum Value} - \text{Minimum Value} $$
Example
Find the range for the data: \(1, 19, 10, 2, 18, 10, 5, 15, 10\).
The minimum value is 1 and the maximum is 19.
The range is \(19 - 1 = 18\).
The range is \(19 - 1 = 18\).
Definition Quartiles and IQR
Quartiles are values that divide an ordered dataset into four equal parts.
The interquartile range (IQR) is the range of the middle 50\(\pourcent\) of the data. It is less affected by extreme outliers than the range.$$ \text{IQR} = Q_3 - Q_1 $$
- The lower quartile (Q1) is the median of the lower half of the data.
- The median (Q2) is the overall median of the data.
- The upper quartile (Q3) is the median of the upper half of the data.
The interquartile range (IQR) is the range of the middle 50\(\pourcent\) of the data. It is less affected by extreme outliers than the range.$$ \text{IQR} = Q_3 - Q_1 $$
Example
Find the quartiles and the interquartile range for the data: \(1, 19, 10, 2, 18, 10, 5, 15, 10\).
- Order the data: \(1, 2, 5, 10, 10, 10, 15, 18, 19\).
- Find the median (Q2): The middle value is the 5th one, so \(Q_2 = 10\). $$ 1, 2, 5, 10, \underline{10}, 10, 15, 18, 19 $$
- Split the data into two halves (excluding Q2): Lower half: \(1, 2, 5, 10\) \quad Upper half: \(10, 15, 18, 19\).
- Find the lower quartile (Q1): Find the median of the lower half. $$ 1, \underline{2, 5}, 10 \rightarrow Q_1 = \frac{2+5}{2} = 3.5 $$
- Find the upper quartile (Q3): Find the median of the upper half. $$ 10, \underline{15, 18}, 19 \rightarrow Q_3 = \frac{15+18}{2} = 16.5 $$
- Calculate the IQR: $$ \text{IQR} = Q_3 - Q_1 = 16.5 - 3.5 = 13 $$
Step 4: Representing Data
Visualizing Frequencies
Once data is organized in a table, we can create graphs to see the patterns visually. Bar charts are excellent for comparing frequencies, while pie charts are best for showing proportions.
Definition Bar Chart
A bar chart uses rectangular bars where the height of each bar represents its frequency. It can be used for both qualitative and quantitative data.
- For qualitative (categorical) data, each bar represents a distinct category (e.g., "Math", "Science"). The bars are typically drawn with gaps between them to show the categories are separate.
- For quantitative (numerical) data, each bar represents a specific number (e.g., a score of "3", or "4 siblings"). The numbers are placed in order along the horizontal axis.
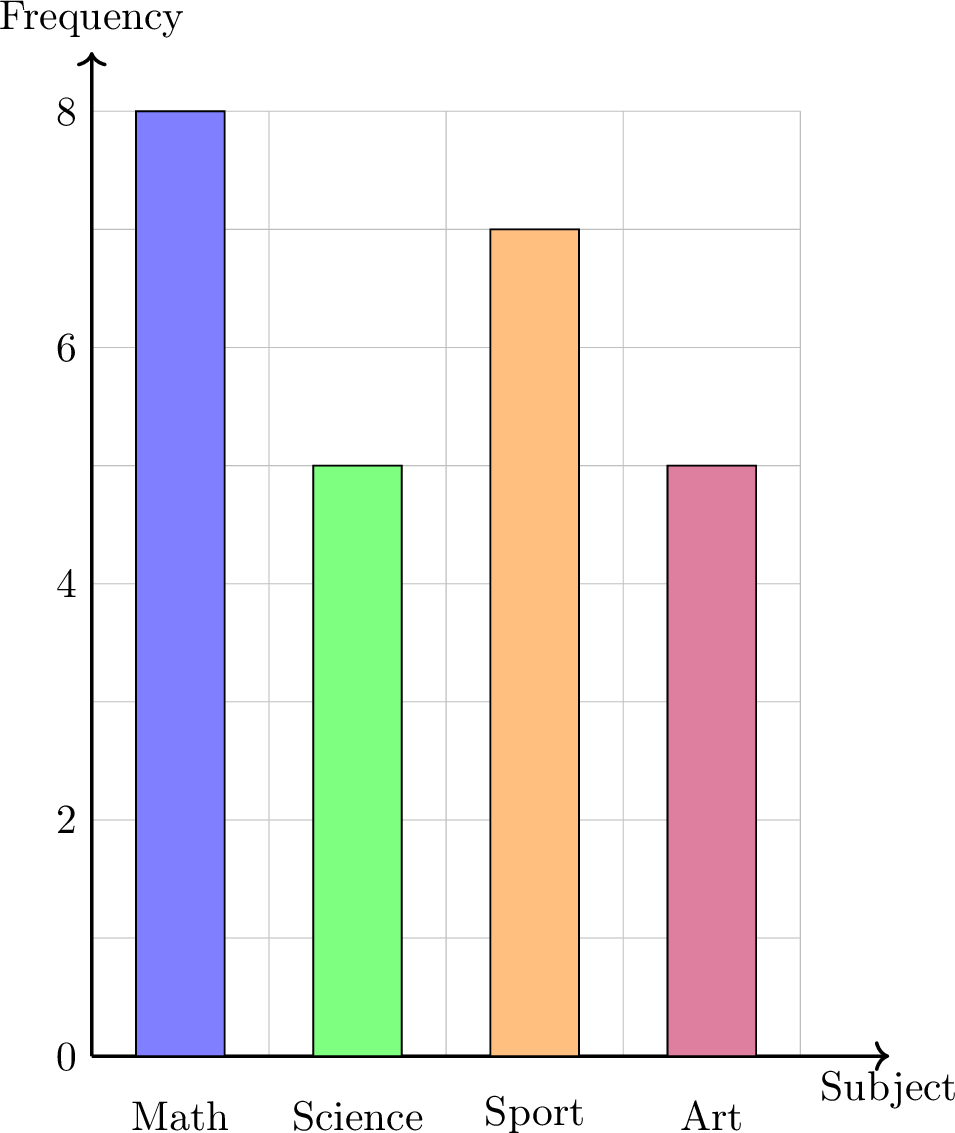
Example
Draw a bar chart for our "Favorite Subject" survey data.
| Subject | Frequency |
| Math | 8 |
| Science | 5 |
| Sport | 7 |
| Art | 5 |
Definition Pie Chart
A pie chart shows the proportion of each category as a slice of a circle. If the relative frequency of a category is written as a decimal (for example \(0.32\)), the angle for its slice is calculated as:$$ \text{Angle} = \text{Relative Frequency} \times 360^\circ. $$
Example
Draw a pie chart for our "Favorite Subject" survey data (Total = 25 students).
| Subject | Frequency | Relative Frequency |
| Math | 8 | \(32\pourcent\) |
| Science | 5 | \(20\pourcent\) |
| Sport | 7 | \(28\pourcent\) |
| Art | 5 | \(20\pourcent\) |
First, calculate the angle for each slice: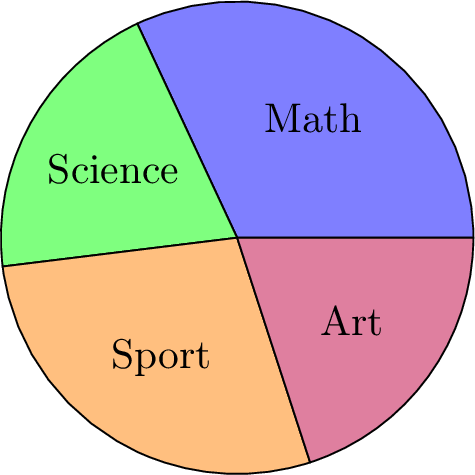
- Math: \(0.32 \times 360^\circ \approx 115^\circ\)
- Science: \(0.20 \times 360^\circ = 72^\circ\)
- Sport: \(0.28 \times 360^\circ \approx 101^\circ\)
- Art: \(0.20 \times 360^\circ = 72^\circ\)
Visualizing Central Tendency and Dispersion
While measures like the mean and standard deviation are powerful, they don't give a full picture of the data's distribution. A box plot (or box-and-whisker plot) is a visual tool that summarizes a dataset by showing both its center and its spread simultaneously.
Definition Box Plot
A box plot visually displays the five-number summary above a number line.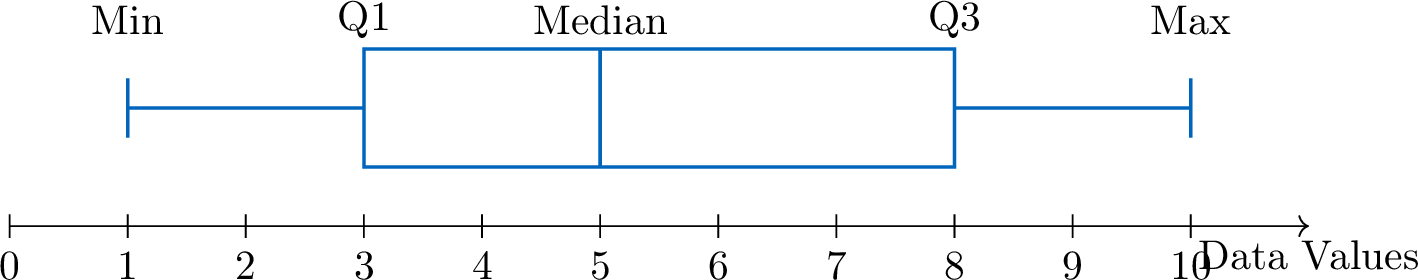
- A central box is drawn from the lower quartile (Q1) to the upper quartile (Q3).
- A line inside the box marks the median (Q2).
- Whiskers (lines) extend from the box out to the minimum and maximum values.
Method Constructing a Box Plot
- Order the data from least to greatest.
- Find the five-number summary: Calculate the minimum, Q1, median, Q3, and maximum.
- Draw a number line that covers the full range of your data.
- Draw the box and median: Draw a box from Q1 to Q3 and a vertical line inside the box at the median.
- Draw the whiskers: Draw lines from the box to the minimum and maximum values.
Exercise
This box plot shows the number of minutes passengers spent waiting in an airport departure lounge.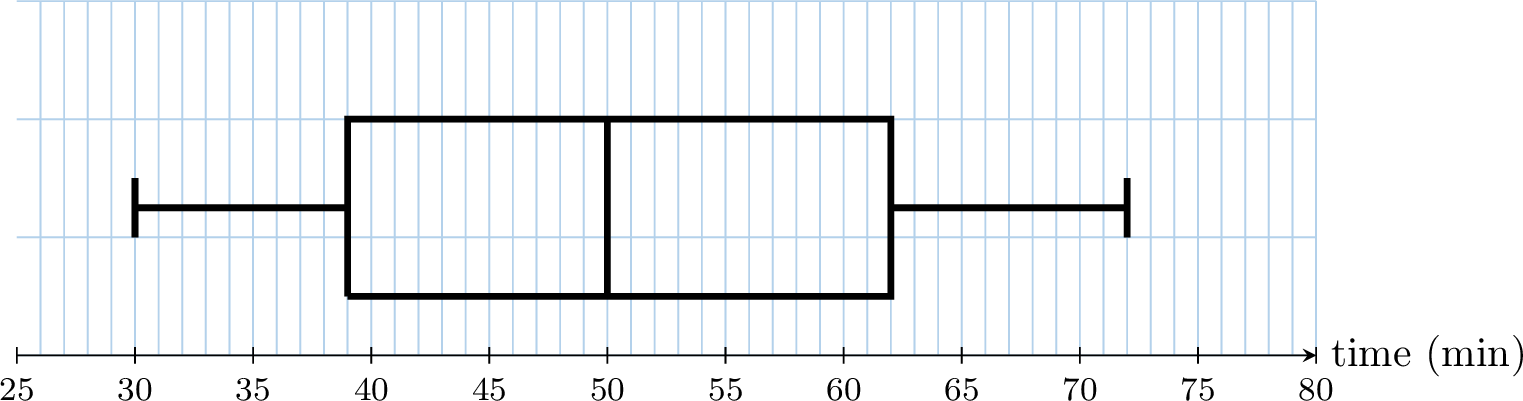
By reading the five-number summary from the plot:
- Median (Q2): The line inside the box is at 50 minutes.
- Range: Maximum - Minimum = \(72 - 30 = 42\) minutes.
- Interquartile Range (IQR): Q3 - Q1 = \(62 - 39 = 23\) minutes.
Step 5: Interpreting Data
Drawing Conclusions and Evaluating Claims
Method Interpreting Statistical Results
A rigorous interpretation of statistical results involves several steps:
- Summarize Key Findings: State the principal results of the analysis, referencing descriptive statistics (e.g., mean, median, standard deviation) and key features of any graphical representations.
- Contextualize the Results: Relate the findings back to the original research question. What do these numbers mean in the context of the problem being studied?
- Make Inferences (If Applicable): If the data comes from a representative sample, make a careful inference about the wider population. It is crucial to acknowledge the uncertainty inherent in generalizing from a sample to a population.
- Evaluate Limitations: Critically assess the limitations of the study. This includes considering potential sources of error (sampling error, selection bias, measurement error) and how they might affect the validity and generalizability of the conclusions.
Method Critically Evaluating a Statistical Claim
When presented with a statistical claim, a critical evaluation should focus on two key areas:
- Validity of the Data Collection: Was the sample representative of the target population, or could selection bias have influenced the results? Was the sample size adequate to support the conclusion? Were the questions neutral and unambiguous to avoid measurement error?
- Scope of the Conclusion: Does the conclusion overgeneralize the findings? A common error is to mistake a trend within a specific sample for a universal truth. A descriptive statistic (like a mean) summarizes a group but does not apply to every individual within that group.
Example Evaluating a Claim
Claim: "Girls are better at math than boys."
Evidence Provided: A study of one class found that the girls' mean test score was 87\(\pourcent\), while the boys' mean was 75\(\pourcent\).
Critical Evaluation: The general claim is not justified by the evidence provided.
Evidence Provided: A study of one class found that the girls' mean test score was 87\(\pourcent\), while the boys' mean was 75\(\pourcent\).
Critical Evaluation: The general claim is not justified by the evidence provided.
- Limitation of the Sample (Generalizability): The sample consists of only one class. It is not random and is too small to be considered representative of the entire population of "all girls" and "all boys." The conclusion cannot be generalized beyond this specific group.
- Misinterpretation of Averages: The mean describes the central tendency of a group, not the performance of individuals. Even with a higher mean, it is highly probable that some boys in the class scored higher than some girls. The claim "Girls are better" is an overgeneralization that incorrectly implies this is true for every individual.