Voronoi Diagrams
Voronoi diagrams are a way to divide the plane (or a region of space) into areas based on distance to a given set of points. They are used in biology to model cell growth, in epidemiology to identify sources of infection, and in city planning to determine the catchment areas of schools, hospitals, or post offices.
The idea is simple: given a set of points (called sites), we divide the map so that every point in a region is closer to its associated site than to any other site.
The idea is simple: given a set of points (called sites), we divide the map so that every point in a region is closer to its associated site than to any other site.
Definitions
Definition Site, Region, Edge, Vertex
Consider a set of points called sites.
- For each site, its region (or cell) consists of all points that are closer to this site than to any other site.
- An edge (or boundary) is a line segment (or ray) made of points equidistant from two sites.
- A vertex (or node) is a point equidistant from at least three sites. It is the intersection point of edges.
Example
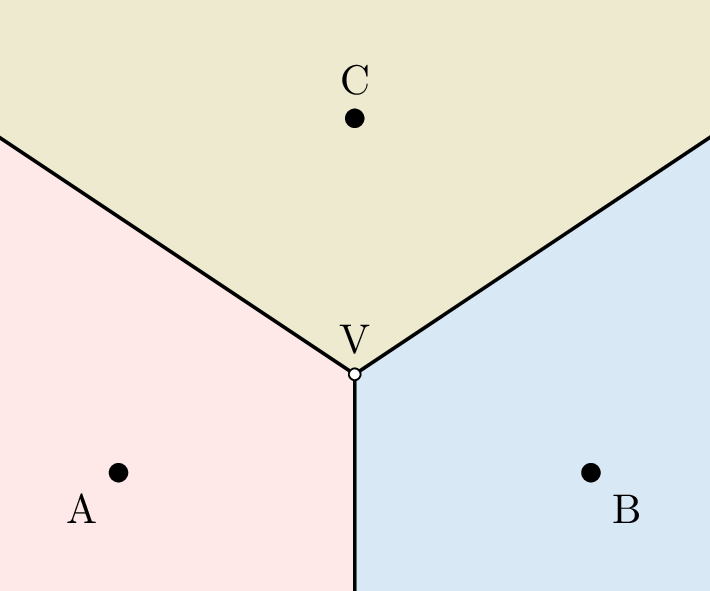
- The red region (left) consists of all points closest to A.
- The blue region (right) consists of all points closest to B.
- The green region (top) consists of all points closest to C.
Constructing a Voronoi Diagram
Method Constructing a Voronoi Diagram for 2 Sites
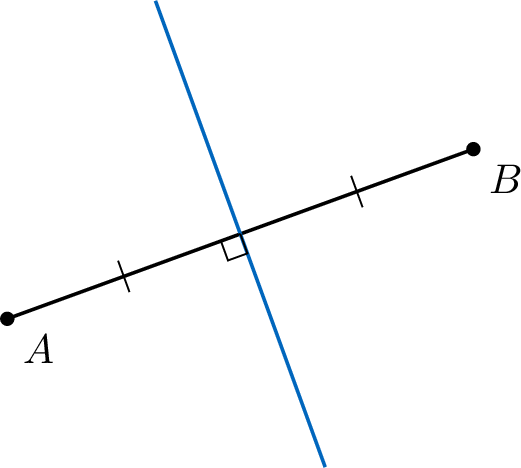
To construct a diagram for 2 sites, draw the perpendicular bisector of the segment joining the two sites. This line is the boundary between their two Voronoi regions.
Example
Method Constructing a Voronoi Diagram for 3 Sites
To construct a Voronoi diagram for 3 sites, proceed as follows:
- Draw the triangle connecting the three sites (using dashed lines for clarity).
- Draw the perpendicular bisector of each side of the triangle.
- These three bisectors intersect at a single point. This point is the only vertex of the Voronoi diagram and is equidistant from all three sites.
- The edges of the Voronoi diagram are the three rays that start at this vertex and extend infinitely outward along each perpendicular bisector, in the direction away from the triangle.
Example
Construct the Voronoi diagram for sites \(A\), \(B\), and \(C\).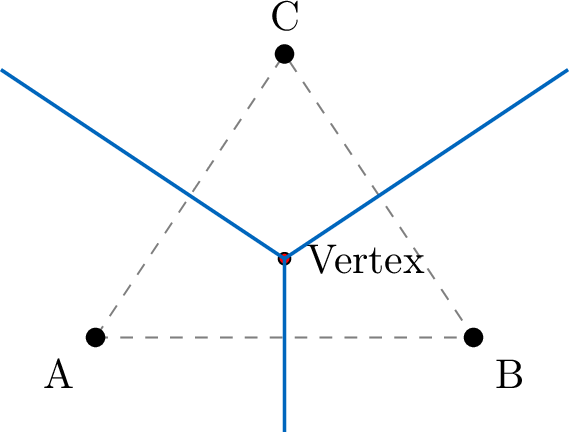
Method Incremental Algorithm
To add a new site \(D\) to an existing diagram:
- Locate the existing Voronoi region that contains \(D\) (the region of the site currently closest to \(D\)).
- Draw the perpendicular bisector between \(D\) and the site that owns that region.
- Continue drawing bisectors between \(D\) and neighboring sites until the polygonal cell of \(D\) is closed.
- Remove the old edges that now lie inside the new region.
Example
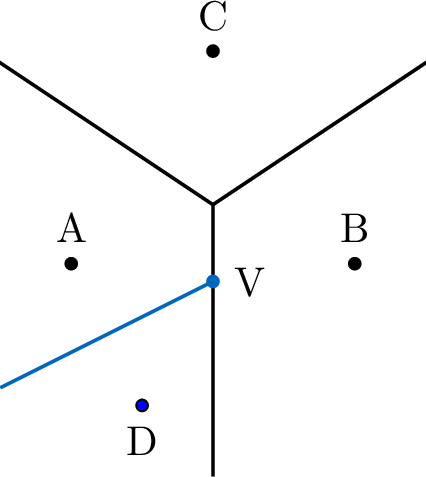
Start with the Voronoi diagram for \(A\), \(B\), and \(C\). Add a new site \(D\).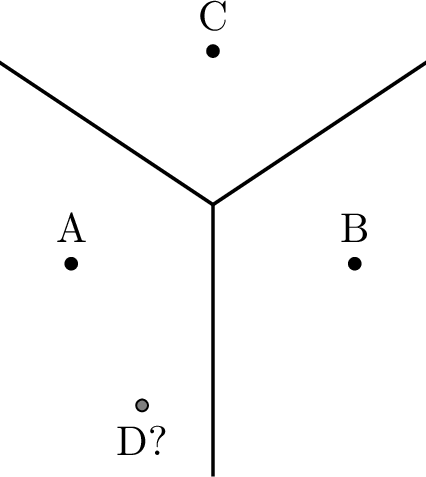
- Site \(D\) lies in the region of \(A\). We draw the perpendicular bisector between \(D\) and \(A\).
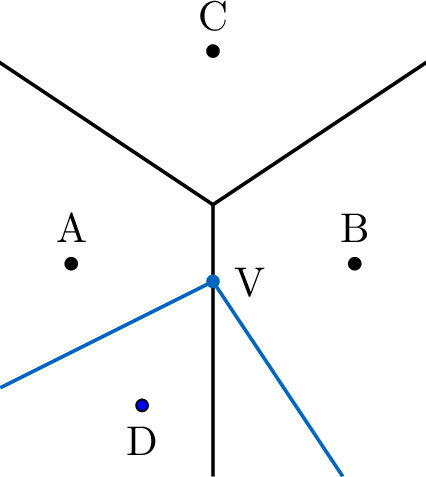
- A new vertex \(V\) (at \(V_2\)) is added. This vertex is equidistant from \(A\), \(B\) and \(D\). We must now draw the bisector between \(D\) and \(B\), starting at \(V\) as shown. This line does not meet any other existing edges, so no more new vertices are created. This tells us that the construction of the cell of \(D\) is complete.
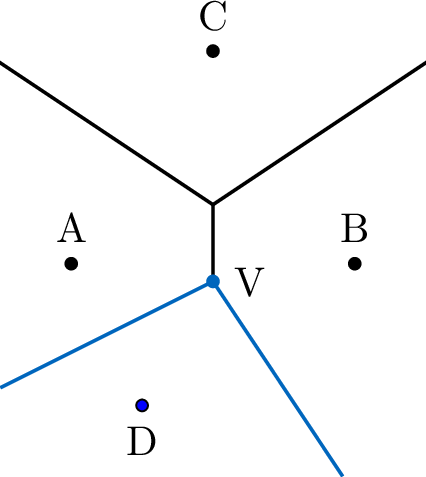
- Finally, we remove the part of the edge between \(A\) and \(B\) that now lies inside the cell of site \(D\).
Nearest Neighbor Interpolation
Definition Nearest Neighbor
Given a set of data values associated with the sites, the value at any point in the plane can be estimated by taking the value of the site whose Voronoi region contains that point. This is called nearest neighbor interpolation.
Example
A city has 3 post offices at coordinates \(A(1,1)\), \(B(5,1)\), and \(C(3,4)\).
You live at \(P(2,2)\). Which post office serves you?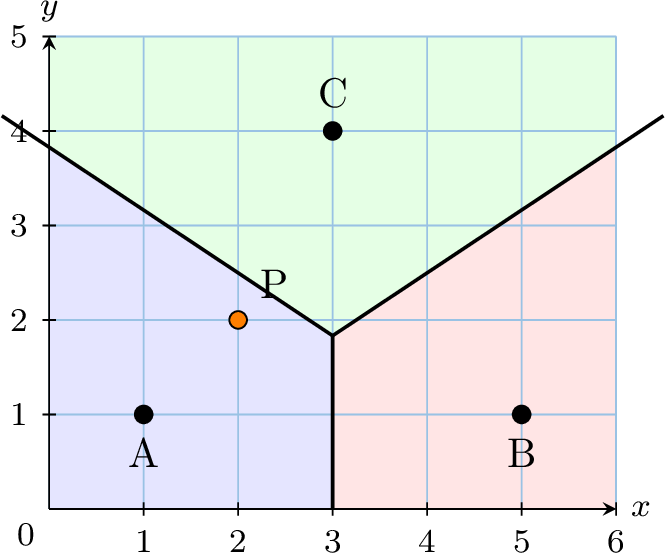
You live at \(P(2,2)\). Which post office serves you?
- Distance \(PA = \sqrt{(2-1)^2 + (2-1)^2} = \sqrt{1+1} = \sqrt{2} \approx 1.41\).
- Distance \(PB = \sqrt{(2-5)^2 + (2-1)^2} = \sqrt{9+1} = \sqrt{10} \approx 3.16\).
- Distance \(PC = \sqrt{(2-3)^2 + (2-4)^2} = \sqrt{1+4} = \sqrt{5} \approx 2.24\).
The Toxic Dump Problem
A classic application is finding the location for a ``toxic dump'' (or a noisy factory). The goal is to find a location inside a specified boundary that is as far as possible from any existing habitation (the sites).
Proposition Largest Empty Circle
The point within the convex hull of the sites that is furthest from any site is always located at a vertex of the Voronoi diagram.
This point is the center of the largest empty circle that can be drawn without containing any site.
This point is the center of the largest empty circle that can be drawn without containing any site.
Example
Three towns are located at \(A(0,0)\), \(B(4,0)\), and \(C(0,4)\). We want to build a waste facility as far as possible from all three towns.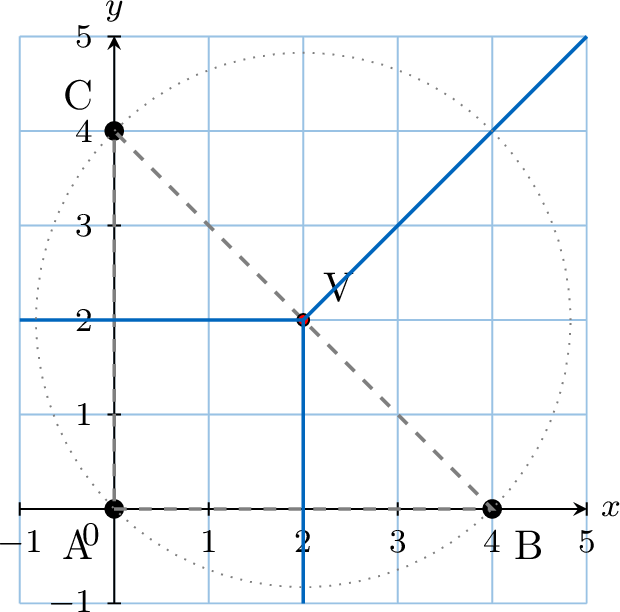
- The segment \(AB\) lies on the line \(y=0\) and has midpoint \((2,0)\), so its perpendicular bisector is the line \(x=2\).
- The segment \(AC\) lies on the line \(x=0\) and has midpoint \((0,2)\), so its perpendicular bisector is the line \(y=2\).
- The intersection (vertex) is \(V(2,2)\).
- Distance from \(V\) to \(A\): \(\sqrt{(2-0)^2 + (2-0)^2} = \sqrt{8} \approx 2.83\).