Quadratic Functions
In previous studies, you explored linear functions, whose graphs are straight lines. We now move to the next level of complexity: quadratic functions. These are functions containing an \(x^2\) term, and their graphs are elegant, symmetrical curves called parabolas. Quadratic functions are essential in mathematics and science for modeling everything from the path of a thrown ball to the shape of a satellite dish. In this chapter, you will learn to identify, graph, and solve these important functions.
Definition
A quadratic function is a polynomial of degree two. Its defining feature is the \(x^2\) term, which distinguishes it from a linear function.
Definition Quadratic Function
A quadratic function is a function that can be written in the form $$f(x) = ax^2 + bx + c$$ where \(a, b,\) and \(c\) are real numbers and \(\boldsymbol{a \neq 0}\).
Example
For \(f(x) = x^2 - 3x + 1\), evaluate \(f(2)\).
\(\begin{aligned}[t]f(2) &= (2)^2 - 3(2) + 1 \\&= 4 - 6 + 1 \\&= -1\end{aligned}\)
Graph of a Quadratic Function
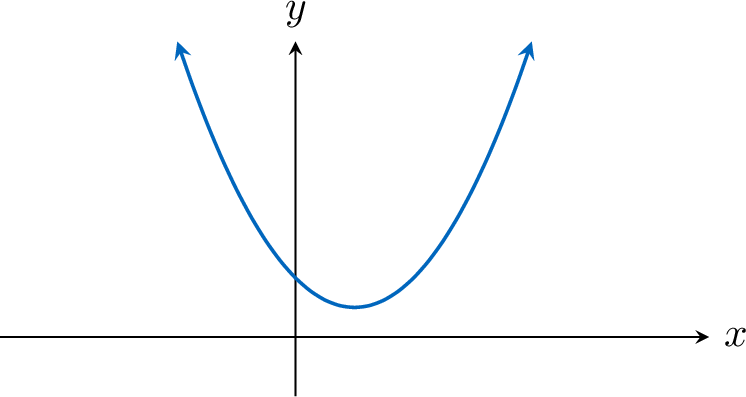
The graph of every quadratic function has a characteristic U-shape (either upright or inverted) called a parabola. This shape is found in many areas of science and nature.
The parabola is one of the conic sections, which are the group of curves obtained by intersecting a cone with a plane. A parabola is produced by intersecting the cone with a plane parallel to its side.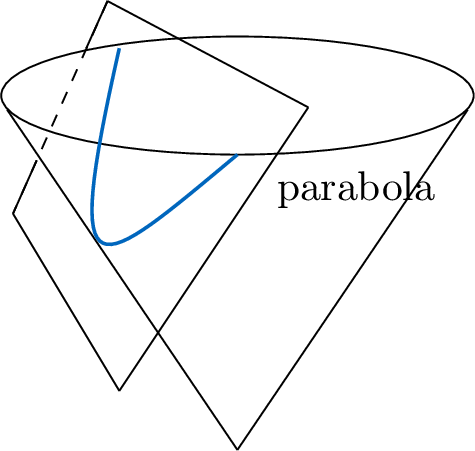
The parabola is one of the conic sections, which are the group of curves obtained by intersecting a cone with a plane. A parabola is produced by intersecting the cone with a plane parallel to its side.
Proposition Parabola and its Key Features
The graph of a quadratic function \(f(x) = ax^2 + bx + c\) is a parabola. Its key features are: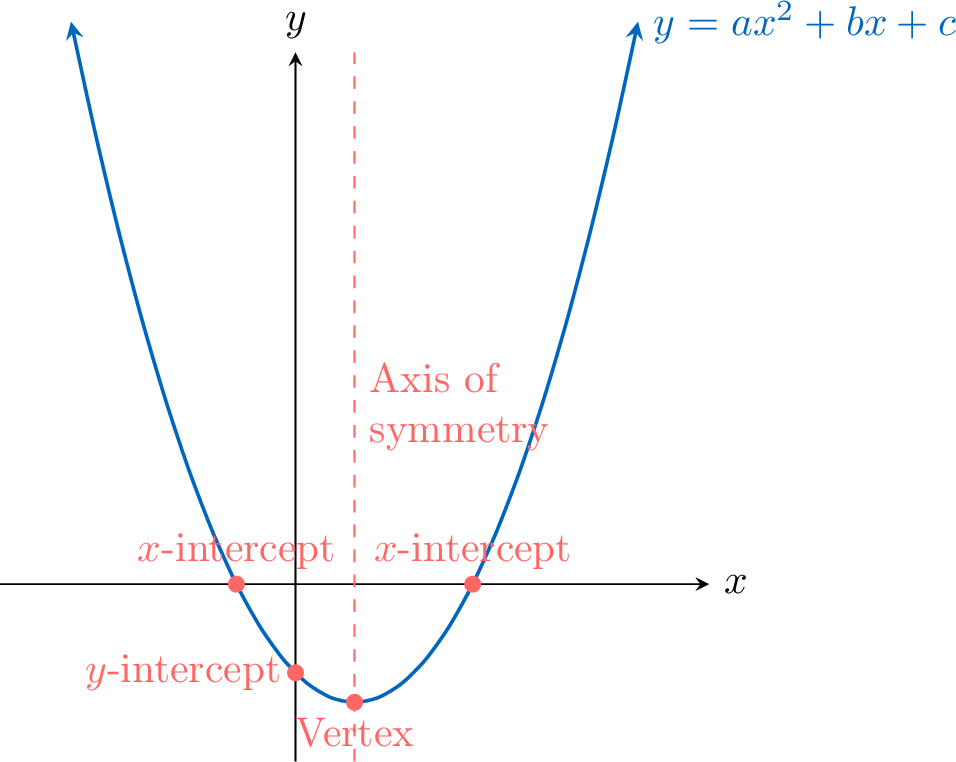
- Axis of Symmetry: A vertical line that divides the parabola into two mirror images. Its equation is \(x = -\frac{b}{2a}\).
- Vertex: The point where the parabola turns. It is the minimum point if the parabola opens up, and the maximum point if it opens down. The vertex lies on the axis of symmetry. Its coordinates are \(\left(-\frac{b}{2a}, f\left(-\frac{b}{2a}\right)\right)\).
- y-intercept: The point where the graph crosses the y-axis. Its coordinates are \((0, f(0))\).
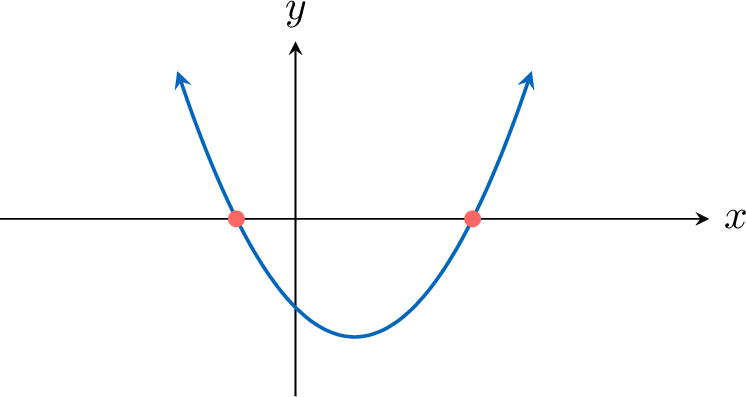
- x-intercepts: The points where the graph crosses the x-axis. They are also called the roots or zeros of the function.
Example
Sketch the graph of \(f(x) = x^2 - x - 1\).
A table of values is
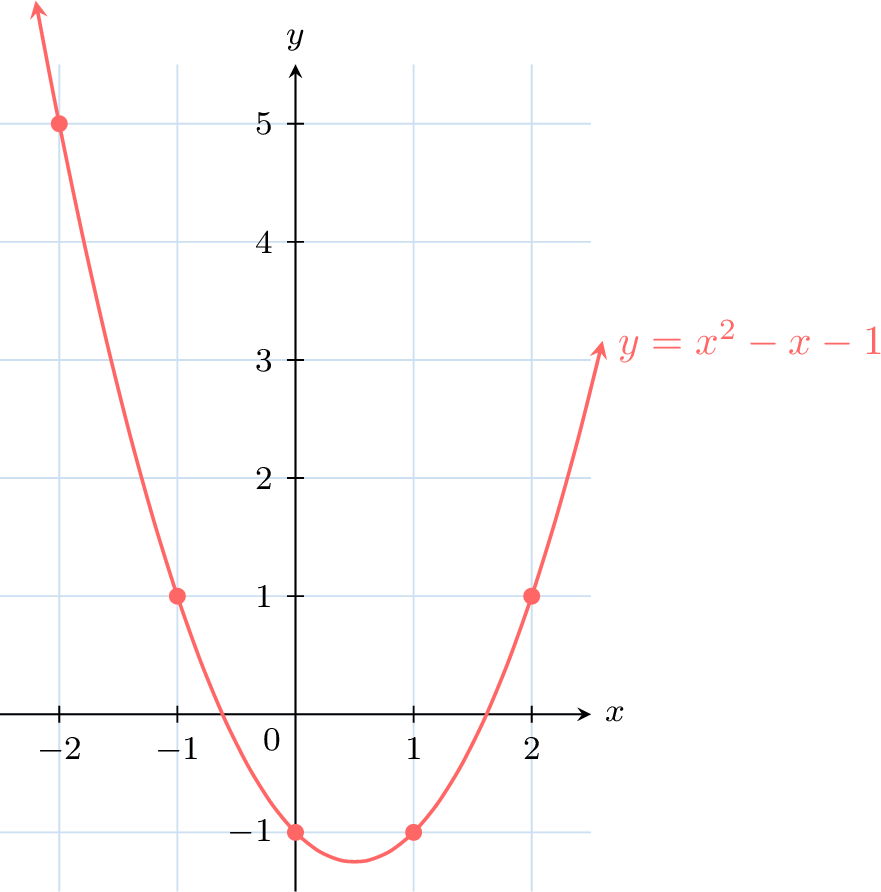
| \(x\) | \(-2\) | \(-1\) | 0 | 1 | 2 |
| \(y\) | 5 | 1 | \(-1\) | \(-1\) | 1 |
The coefficient \(a\) in \(ax^2+bx+c\) controls whether the parabola opens upwards or downwards. To see this interactively, use the GeoGebra animation at https://www.geogebra.org/m/gn3c2sqe.
Proposition Concavity
For any quadratic function \(f(x) = ax^2 + bx + c\):
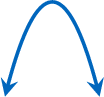
- If \(a > 0\), the parabola is concave up (opens upwards) and has a minimum value at its vertex.
 .
. - If \(a < 0\), the parabola is concave down (opens downwards) and has a maximum value at its vertex.
 .
.
Solving Quadratic Equations
Solving the equation \(f(x) = y\) for a quadratic function means finding the input value(s) \(x\) that produce a specific output \(y\). This process results in a quadratic equation. A particularly important case is solving \(f(x)=0\), which gives the x-intercepts of the parabola.
Method Solving \(ax^2+bx+c=0\)
When solving for a value of \(f(x) = y\), we obtain a quadratic equation in \(x\). Since it is quadratic, there may be 0, 1, or 2 real solutions for \(x\), which can be found using the quadratic formula.
Example
For \(f(x) = 2x^2 - 5x + 2\), find the \(x\)-intercepts of the function.
To find the x-intercepts, we set \(f(x) = 0\): \(2x^2 - 5x + 2 = 0\). We identify \(a=2\), \(b=-5\), \(c=2\).
- First, find the discriminant: \(\begin{aligned}[t]\Delta &= b^2 - 4ac \\&= (-5)^2 - 4(2)(2) \\&= 25 - 16 \\&= 9\end{aligned}\)
- As \(\Delta > 0\), there are 2 distinct real roots.
- Use the quadratic formula: \(\begin{aligned}[t]x &= \frac{-b \pm \sqrt{\Delta}}{2a} \\x &= \frac{-(-5) \pm \sqrt{9}}{2(2)} \\x &= \frac{5 \pm 3}{4}\end{aligned}\)
- The two roots are: \(x_1 = \frac{5 - 3}{4} = \frac{2}{4} = \frac{1}{2}\) and \(x_2 = \frac{5 + 3}{4} = \frac{8}{4} = 2\).
Proposition The Discriminant and Number of x-intercepts
For any quadratic function \(f(x) = ax^2 + bx + c\), the number of x-intercepts is determined by the discriminant \(\Delta = b^2 - 4ac\):
- If \(\Delta > 0\), the graph intersects the \(x\)-axis at two distinct points.
- If \(\Delta = 0\), the graph touches the \(x\)-axis at one point (the vertex).

- If \(\Delta < 0\), the graph does not intersect the \(x\)-axis. It is either entirely above or entirely below it.