Linear Functions
Many situations in the real world involve a constant rate of change. For example, the total cost of items at a store increases by the same amount for each item you add, or the distance you travel increases steadily when you move at a constant speed. These relationships can be modeled using a very common type of function: the linear function.
A linear function is a function whose graph is a straight line and whose rate of change is constant.
A linear function is a function whose graph is a straight line and whose rate of change is constant.
Definition
Definition Linear Function
A linear function is a function that can be written in the form:$$f(x) = ax + b$$where \(a\) and \(b\) are constants (real numbers) and \(x\) is the input variable.
- The constant \(a\) is called the slope or gradient. It represents the constant rate of change of the function: how much \(f(x)\) changes when \(x\) increases by 1.
- The constant \(b\) is called the \(y\)-intercept. It represents the initial value of the function, i.e., the value of \(f(0)\) when \(x = 0\).
Example
Access to a swimming pool costs a fixed entrance fee of \(\dollar 12\), plus \(\dollar 5\) for each hour you stay. Let \(P(x)\) be the total price for \(x\) hours at the pool. Write a formula for \(P(x)\) as a linear function of \(x\).
The total price, \(P(x)\), is the sum of the fixed entrance fee and the variable cost, which depends on the number of hours, \(x\).
We can write this as an equation:$$ P(x) = (\text{Fixed fee}) + (\text{Cost per hour}) \times (\text{Number of hours}) $$Substituting the values from the problem:$$\begin{aligned}[t]P(x) &= \underbrace{12}_{\text{Fixed fee}} + \underbrace{5 \times x}_{\text{Cost for } x \text{ hours}} \\ &= 12 + 5x\end{aligned}$$Therefore, the formula is \(\boldsymbol{P(x) = 5x + 12}\). This is a linear function with slope \(5\) and y-intercept \(12\).
We can write this as an equation:$$ P(x) = (\text{Fixed fee}) + (\text{Cost per hour}) \times (\text{Number of hours}) $$Substituting the values from the problem:$$\begin{aligned}[t]P(x) &= \underbrace{12}_{\text{Fixed fee}} + \underbrace{5 \times x}_{\text{Cost for } x \text{ hours}} \\ &= 12 + 5x\end{aligned}$$Therefore, the formula is \(\boldsymbol{P(x) = 5x + 12}\). This is a linear function with slope \(5\) and y-intercept \(12\).
Graph of a Linear Function
Proposition Graph
The graph of a linear function \(f(x) = ax + b\) is a straight line with equation \(y = ax + b\).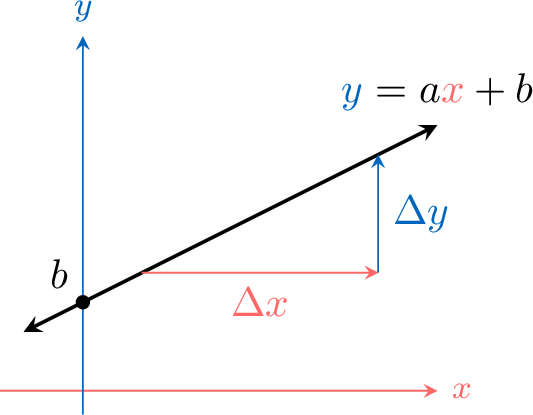
- The line crosses the y-axis at the point \((0, b)\). This point is the y-intercept.
- The slope \(a\) is the ratio of the vertical change (rise, \(\boldsymbol{\Delta y}\)) to the horizontal change (run, \(\boldsymbol{\Delta x}\)) between any two points on the line:$$ a = \frac{\Delta y}{\Delta x}. $$For two points \((x_1,y_1)\) and \((x_2,y_2)\) on the line (with \(x_1 \neq x_2\)), we can write$$ a = \frac{y_2 - y_1}{x_2 - x_1}. $$
Example
Draw the graph of the function \(f(x)=0.5x+1\).
The function is \(f(x) = \dfrac{1}{2} x + 1\).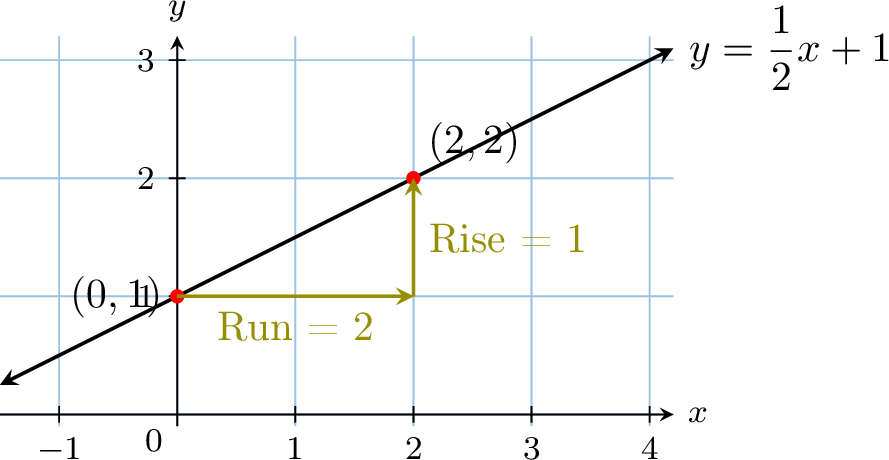
- Identify the y-intercept: The y-intercept is \(b = 1\). So, we plot our first point at \((0,1)\).
- Use the slope: The slope is \(a = \dfrac{1}{2}\). This means that$$ a = \frac{\Delta y}{\Delta x} = \frac{1}{2}, $$so for every ``run'' of \(2\) units to the right, we ``rise'' \(1\) unit up. From \((0,1)\), we move \(2\) units right and \(1\) unit up to find our next point at \((2,2)\).
- Draw the line: Draw a straight line through these two points and extend it in both directions.