Functions
Definitions
A function is like a machine that follows a specific rule. For every number you put in, you get exactly one number out.
Let's imagine a machine whose rule is "multiply by 2".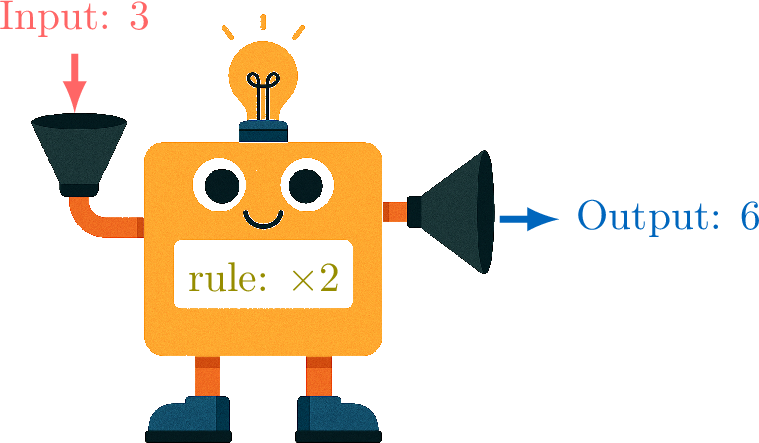
To represent this machine, we write \(\textcolor{olive}{f}(\textcolor{colordef}{\text{input}}) = \textcolor{colorprop}{\text{output}}\). The parentheses \((\) \()\) indicate the action of the function \(\textcolor{olive}{f}\) on the input.
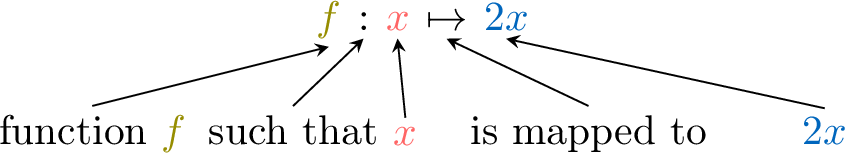
We use function notation to name functions and their variables, replacing "\(\textcolor{colordef}{\text{input}}\)" by "\(\textcolor{colordef}{x}\)" and "\(\textcolor{colorprop}{\text{output}}\)" by "\(\textcolor{colorprop}{f(x)}\)".
We can represent a function in the following way: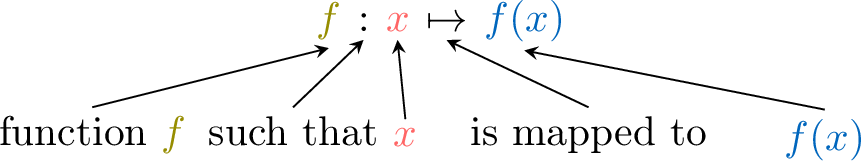
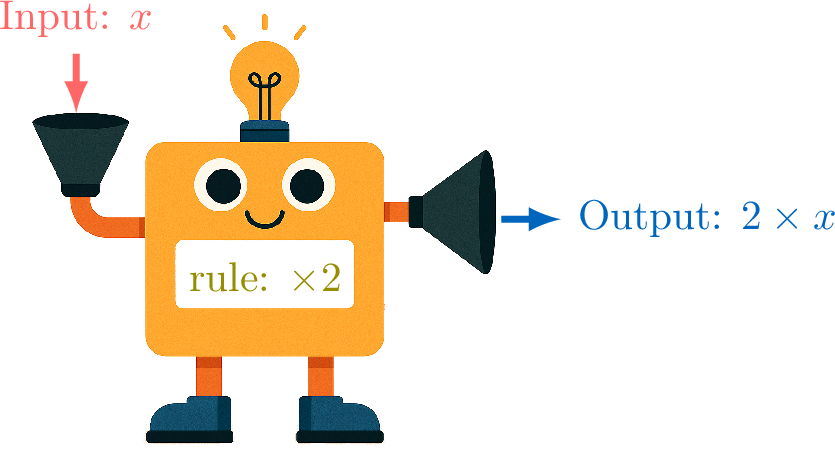
Let's imagine a machine whose rule is "multiply by 2".
| Input | 3 | 5 | 8 | 10 |
| Output | 6 | 10 | 16 | 20 |
To represent this machine, we write \(\textcolor{olive}{f}(\textcolor{colordef}{\text{input}}) = \textcolor{colorprop}{\text{output}}\). The parentheses \((\) \()\) indicate the action of the function \(\textcolor{olive}{f}\) on the input.
We use function notation to name functions and their variables, replacing "\(\textcolor{colordef}{\text{input}}\)" by "\(\textcolor{colordef}{x}\)" and "\(\textcolor{colorprop}{\text{output}}\)" by "\(\textcolor{colorprop}{f(x)}\)".
We can represent a function in the following way:
Definition Function
A function, \(f\), is a rule that assigns to each input value from a set called the domain, exactly one output value in a set called the range.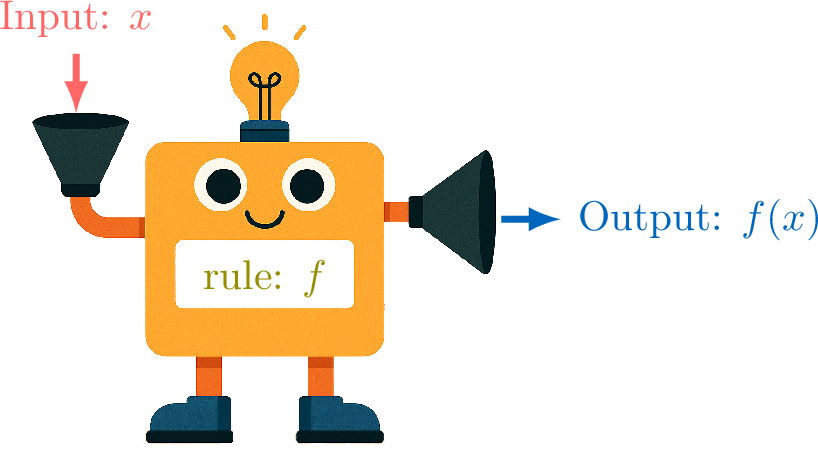
- \(f\) is the name of the function (the rule).
- \(x\) is the input variable.
- \(f(x)\) is the output value when the input is \(x\). It is read as "\(f\) of \(x\)".
- \(f(x)\) is called the image of \(x\) under \(f\).
Example
The function \(f\) is defined by the rule \(f(x)=2x-1\). Find the value of \(f(5)\).
To find \(f(5)\), we substitute the input value \(x=5\) into the function's rule:$$\begin{aligned}[t]f(x) &= 2x - 1 \\
f(5) &= 2(5) - 1 \\
&= 10 - 1 \\
&= \boldsymbol{9}\end{aligned}$$
Tables of Values
Definition Table of Values
A table of values is a table that organizes the relationship between the input values (\(x\)) and their corresponding output values (\(f(x)\)) for a function.
Example
Complete the table of values for the function \(f(x)=x^2\).
| \(x\) | \(-2\) | \(-1\) | \(0\) | \(1\) | \(2\) |
| \(f(x)\) |
We substitute each value of \(x\) into the function \(f(x)=x^2\):
- \(\begin{aligned}[t] f(-2) &= (-2)^2 \\ &= 4 \end{aligned}\)
- \(\begin{aligned}[t] f(-1) &= (-1)^2\\ &= 1 \end{aligned}\)
- \(\begin{aligned}[t] f(0) &= (0)^2 \\ &= 0 \end{aligned}\)
- \(\begin{aligned}[t] f(1) &= (1)^2 \\ &= 1 \end{aligned}\)
- \(\begin{aligned}[t] f(2) &= (2)^2 \\ &= 4 \end{aligned}\)
| \(x\) | \(-2\) | \(-1\) | \(0\) | \(1\) | \(2\) |
| \(f(x)\) | \(4\) | \(1\) | \(0\) | \(1\) | \(4\) |
Graphs of Functions
While a table of values is useful for listing some input–output pairs of a function, a graph is a powerful tool for visualizing how the output changes when the input changes. A graph gives us a picture of the function's behavior.
Definition Graph of a Function
The graph of a function \(f\) is the set of all points with coordinates \((\textcolor{colordef}{x}, \textcolor{colorprop}{f(x)})\) in a coordinate plane. The input value, \(x\), is plotted on the horizontal axis (the x-axis), and the output value, \(f(x)\), is plotted on the vertical axis (the y-axis). When the function is defined for all \(x\) in an interval, we can connect these points to form the curve of the function.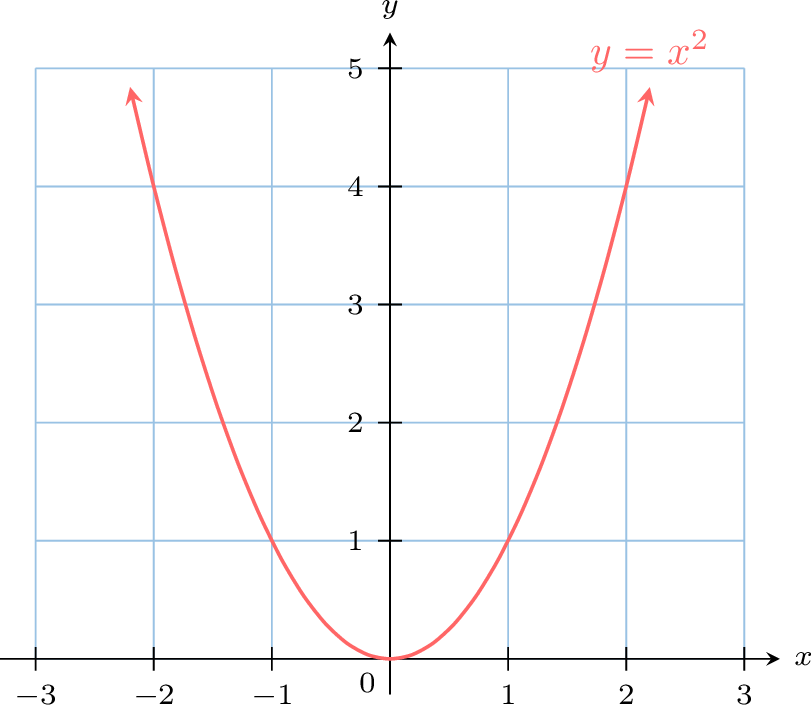
Method Plotting a Graph from a Table
To plot the graph of a function from its table of values:
- Draw a coordinate plane with a suitable scale on each axis and label the axes.
- For each pair \((x, f(x))\) in the table, plot the corresponding point on the coordinate plane.
- If the function is defined for all \(x\) in the interval shown, connect the points with a straight line or a smooth curve.
Example
Plot the graph of the function \(f(x) = x - 1\) using its table of values.
| \(x\) | \(-2\) | \(-1\) | \(0\) | \(1\) | \(2\) | \(3\) |
| \(f(x)\) | \(-3\) | \(-2\) | \(-1\) | \(0\) | \(1\) | \(2\) |
We plot the points \((-2, -3)\), \((-1, -2)\), \((0, -1)\), \((1, 0)\), \((2, 1)\), and \((3, 2)\) from the table. These points lie on the same straight line, so we connect them to draw the graph of \(f(x)=x-1\).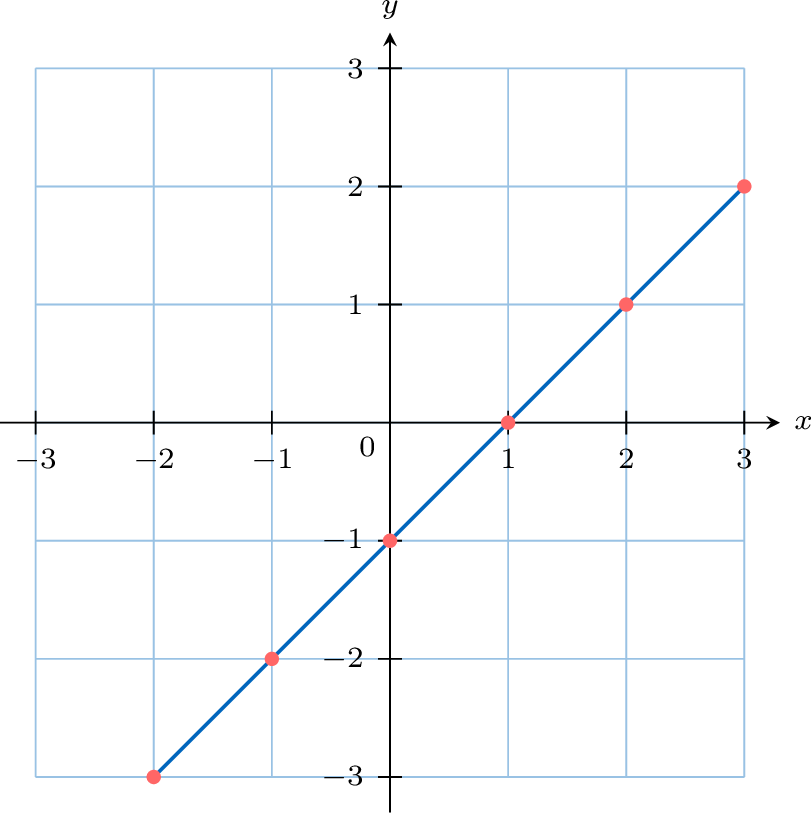
Finding Outputs from Inputs on a Graph
Method Finding the Value of \(f(x)\) from a Graph
To find the output \(f(x)\) for a given input \(x\) using a graph:
- Locate the input value on the horizontal x-axis.
- Move vertically from that point until you reach the curve of the function.
- Move horizontally from the intersection point to the vertical y-axis and read the corresponding value. This y-value is the output \(f(x)\).
Example
Using the graph of the function \(f\) below, find the value of \(f(2)\).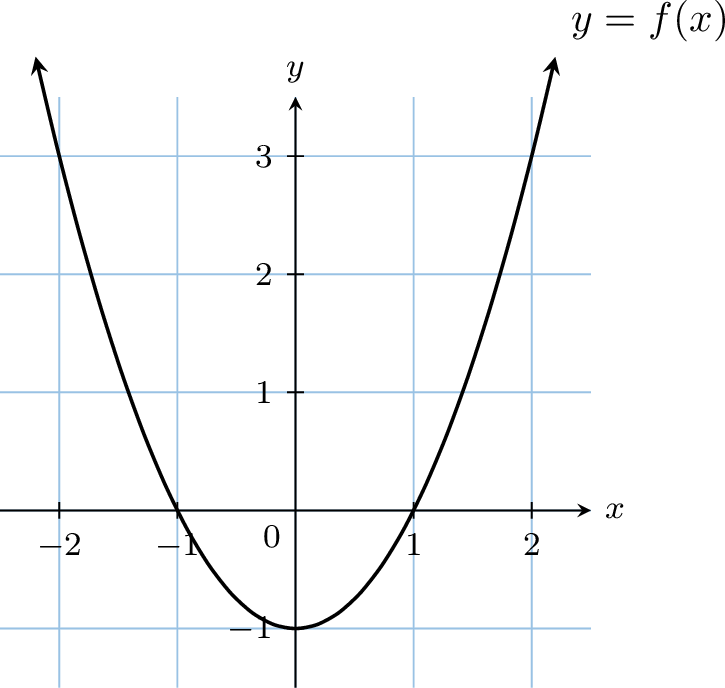
We follow the graphical method: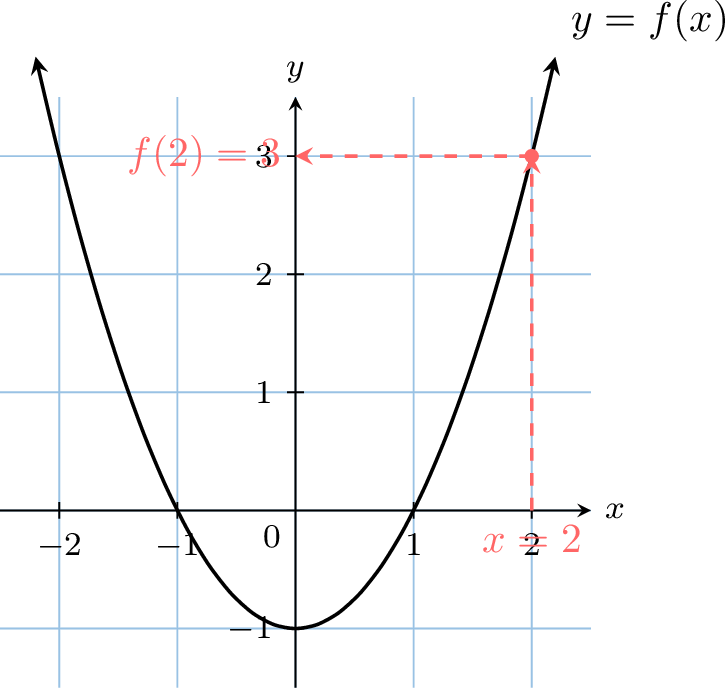
- Start at \(x=2\) on the horizontal axis.
- Move up to meet the curve.
- Move horizontally to the vertical axis and read the value, which is \(3\).
Finding Inputs from Outputs
We have learned how to take an input (\(x\)) and find its output (\(f(x)\)). Now, we will learn how to work backwards: if we know the output, can we find the input(s) that produced it? This process is called finding the preimage(s) (or input(s)) of a given value.
Method Finding Inputs from Outputs on a Graph
To find the preimage(s) of a value \(y\) (i.e., find all \(x\) such that \(f(x)=y\)):
- Locate the output value \(y\) on the vertical y-axis.
- Draw a horizontal line from this value across the graph.
- Find the intersection point(s) where the horizontal line crosses the function's curve.
- Move vertically to the x-axis from each intersection point to read the corresponding input value(s). These are the preimages.
Example
Using the graph of the function \(f\) below, find \(x\) such that \(f(x)= 3\).
We apply the graphical method: 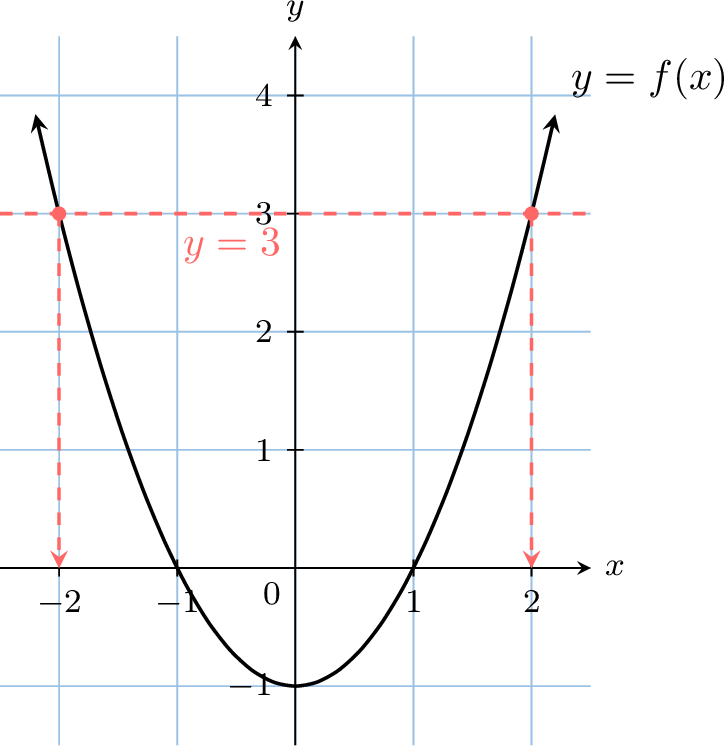
The preimages of \(3\) are \(\boldsymbol{-2}\) and \(\boldsymbol{2}\).
- We locate \(y=3\) on the vertical axis.
- We draw a horizontal line at \(y=3\).
- The line intersects the curve at two points.
- We move vertically from these points to the x-axis to read the values, which are \(-2\) and \(2\).
Finding a preimage graphically is useful for visualization, but for an exact answer, we can use algebra.
Method Finding Inputs from Outputs Algebraically
To find the preimage(s) of a value \(y\) for a function \(f(x)\):
- Set the function's formula equal to the output value: \(\boldsymbol{f(x) = y}\).
- Solve the resulting equation for \(x\).
Example
Let \(f(x) = 3x + 12\). Find \(x\) such that \(f(x)=0\).
We need to find the value of \(x\) such that \(f(x)=0\). We set up the equation and solve:$$\begin{aligned} f(x) &= 0 \\
3x + 12 &= 0 \\
3x &= -12 && \color{gray}\text{(subtract 12 from both sides)} \\
x &= \frac{-12}{3} &&\color{gray}\text{(divide both sides by 3)} \\
x &= -4\end{aligned}$$The preimage of \(0\) is \(\boldsymbol{x = -4}\).
Check: \(f(-4) = 3(-4) + 12 = -12 + 12 = 0\). The answer is correct.
Check: \(f(-4) = 3(-4) + 12 = -12 + 12 = 0\). The answer is correct.