Line Equations
Slopes
The slope (or gradient) of a line describes its direction and steepness. It is a number that tells us how much the \(y\)-coordinate of a point on the line changes when the \(x\)-coordinate increases by \(1\) unit.
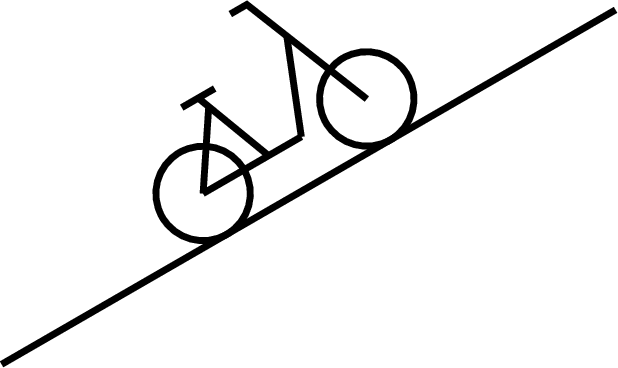
- A positive slope indicates that the line goes up (ascends) as you move to the right.
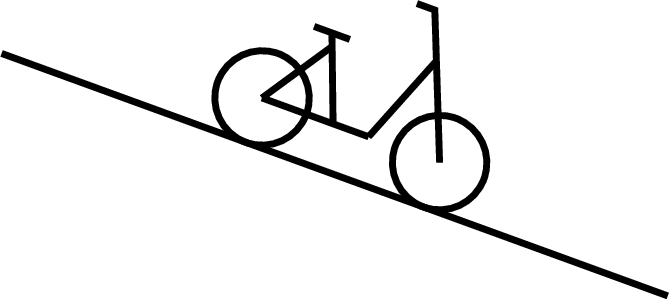
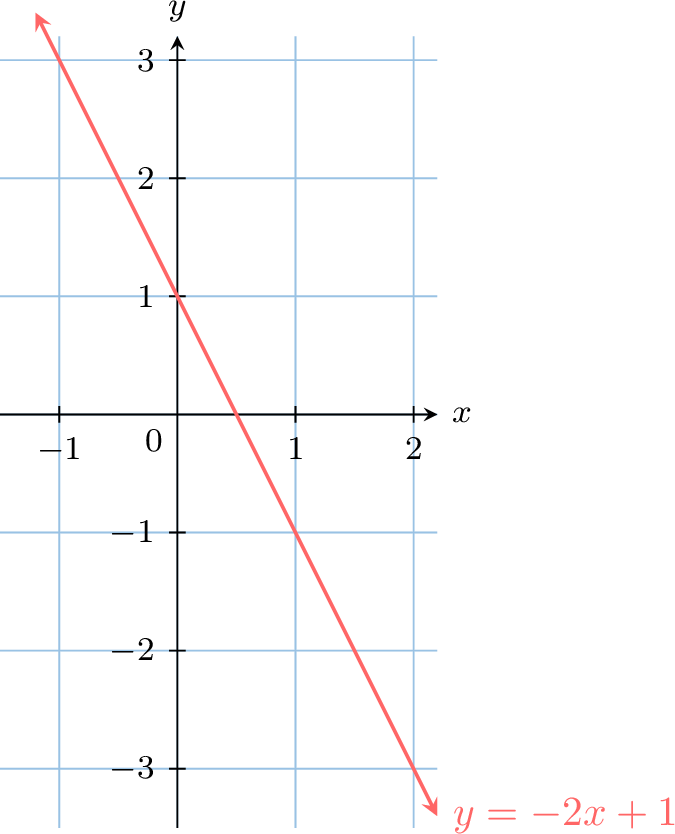
- A negative slope indicates that the line goes down (descends) as you move to the right.
- A slope of zero means the line is horizontal: as you move to the right, there is no vertical change.

Definition Slope
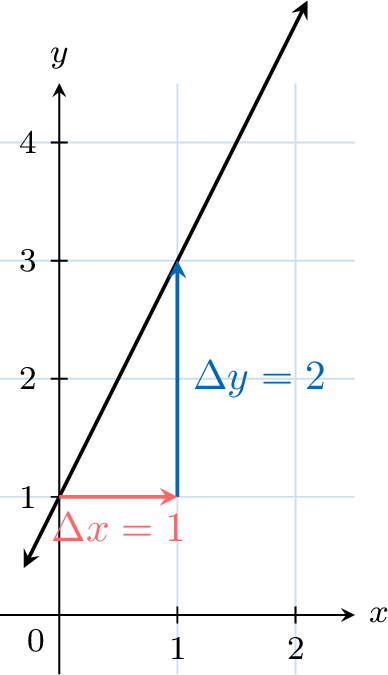
The slope (or gradient) of a non-vertical line is defined as the ratio of the change in the vertical direction (\(\Delta y\)) to the change in the horizontal direction (\(\Delta x\)), for any two distinct points on the line. This ratio is the same no matter which two points on the line we choose:$$\text{slope} = \dfrac{\textcolor{colorprop}{\Delta y}}{\textcolor{colordef}{\Delta x}} = \dfrac{\textcolor{colorprop}{\text{vertical change}}}{\textcolor{colordef}{\text{horizontal change}}}, \quad \text{where } \textcolor{colordef}{\Delta x} \neq 0$$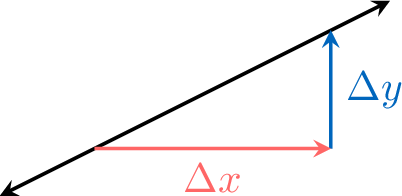
Example
Slope Formula
Proposition Slope Formula
The slope of a non-vertical line passing through two distinct points \(A\left(\textcolor{colordef}{x_A}, \textcolor{colorprop}{y_A}\right)\) and \(B\left(\textcolor{colordef}{x_B}, \textcolor{colorprop}{y_B}\right)\) is given by the formula:$$\text{slope} = \frac{\textcolor{colorprop}{y_B}-\textcolor{colorprop}{y_A}}{\textcolor{colordef}{x_B}-\textcolor{colordef}{x_A}}, \quad \text{where } \textcolor{colordef}{x_A} \neq \textcolor{colordef}{x_B}$$The order of the points does not matter, as long as we subtract in the same order in the numerator and the denominator.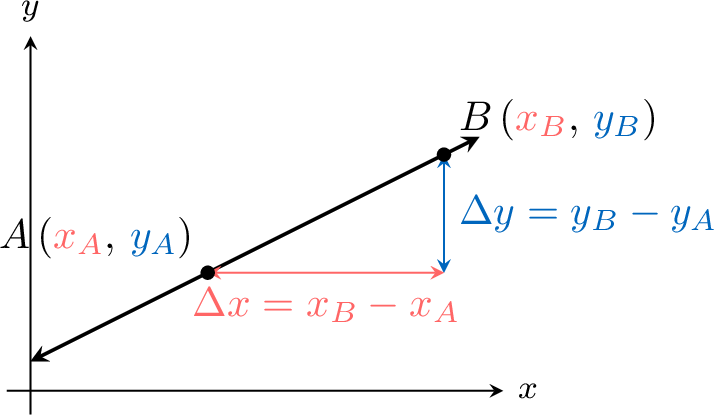
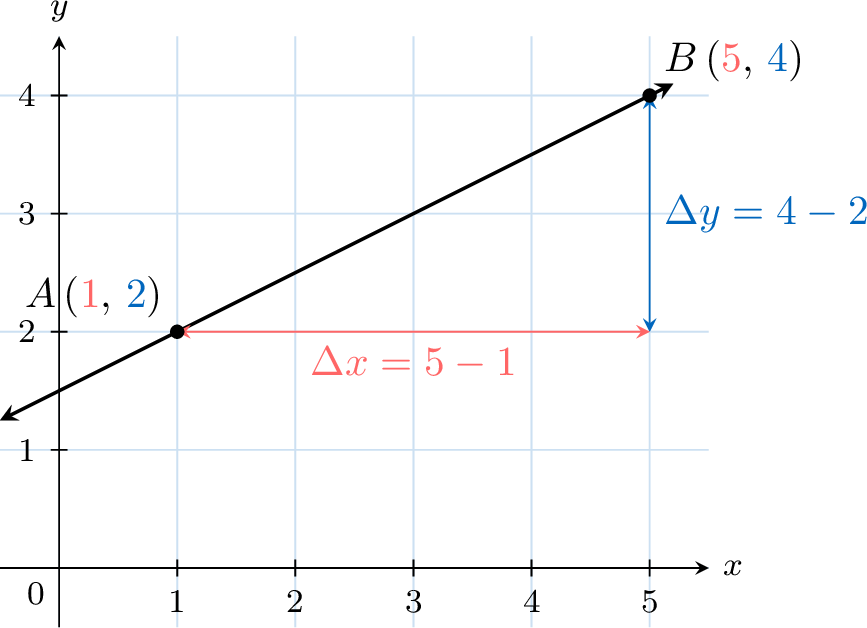
Example
Find the slope of the line \(\Line{AB}\) for \(A\left(\textcolor{colordef}{1}, \textcolor{colorprop}{2}\right)\) and \(B\left(\textcolor{colordef}{5}, \textcolor{colorprop}{4}\right)\).
\(y\)-Intercept
Definition \(y\)-Intercept
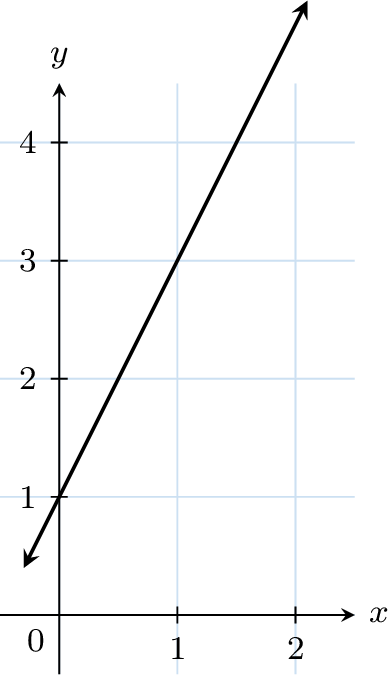
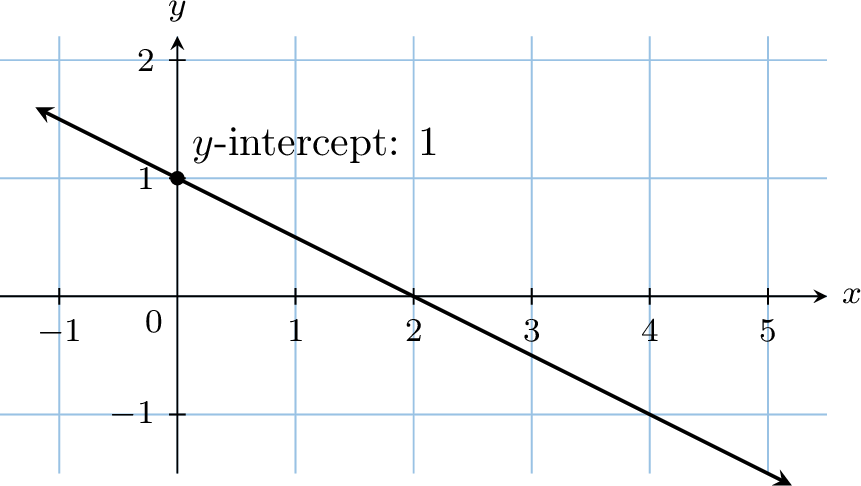
The \(y\)-intercept is the value of \(y\) where the graph crosses the \(y\)-axis (when \(x=0\)).
Example
Find the \(y\)-intercept.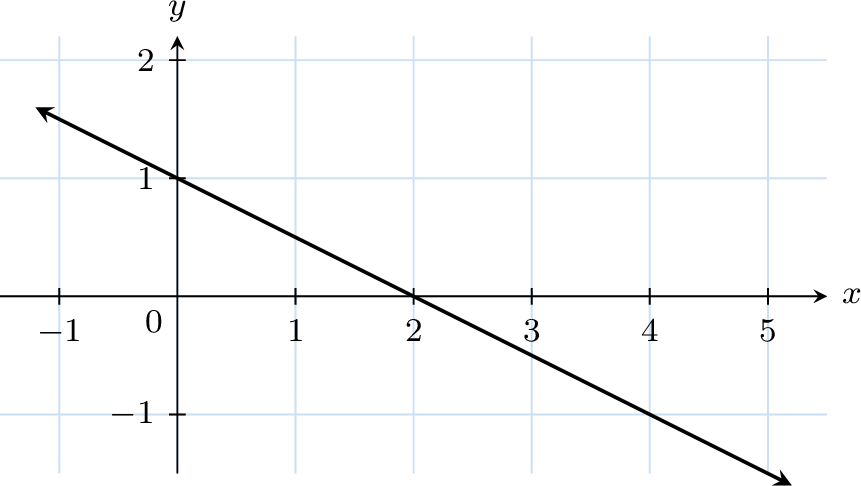
Line Equations
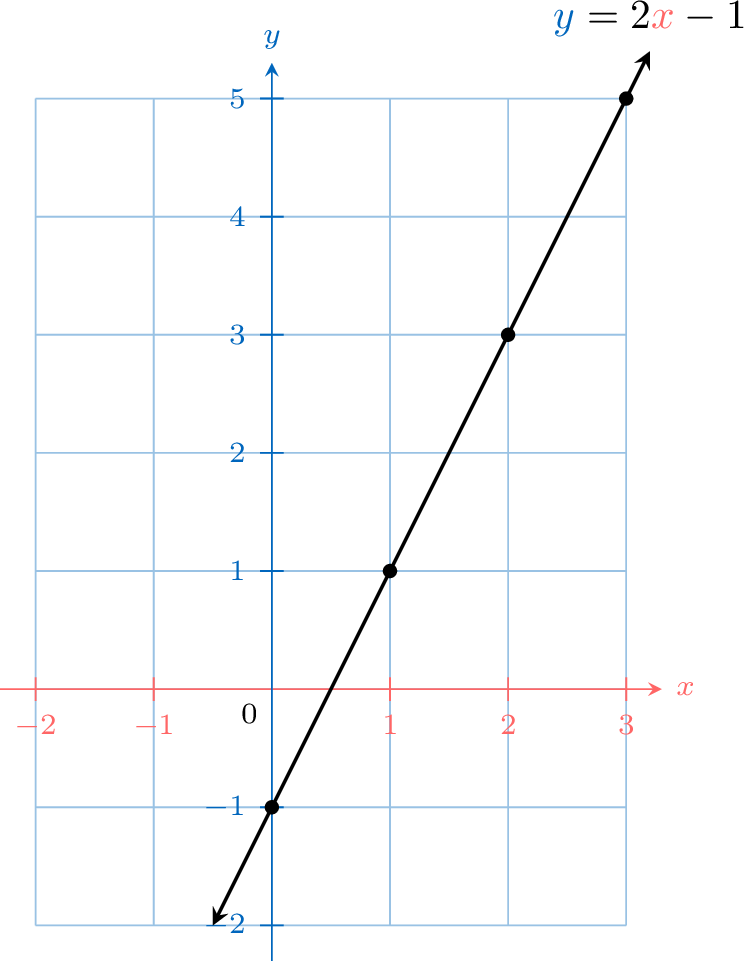
An equation like \(\textcolor{colorprop}{y}=2\textcolor{colordef}{x}-1\) describes a relationship between the variables \(\textcolor{colordef}{x}\) and \(\textcolor{colorprop}{y}\). For any value of \(\textcolor{colordef}{x}\) we choose, the equation tells us the corresponding value of \(\textcolor{colorprop}{y}\).
We can use this to find coordinates \((\textcolor{colordef}{x}, \textcolor{colorprop}{y})\) for points that satisfy the equation.
We can use this to find coordinates \((\textcolor{colordef}{x}, \textcolor{colorprop}{y})\) for points that satisfy the equation.
- If \(\textcolor{colordef}{x} = \textcolor{colordef}{1}\), then \(\textcolor{colorprop}{y} = 2(\textcolor{colordef}{1}) - 1 = \textcolor{colorprop}{1}\). This gives us the point \((1, 1)\).
- If \(\textcolor{colordef}{x} = \textcolor{colordef}{2}\), then \(\textcolor{colorprop}{y} = 2(\textcolor{colordef}{2}) - 1 = \textcolor{colorprop}{3}\). This gives us the point \((2, 3)\).
| \(\textcolor{colordef}{x}\) | \(\textcolor{colordef}{0}\) | \(\textcolor{colordef}{1}\) | \(\textcolor{colordef}{2}\) | \(\textcolor{colordef}{3}\) |
| \(\textcolor{colorprop}{y}\) | \(\textcolor{colorprop}{-1}\) | \(\textcolor{colorprop}{1}\) | \(\textcolor{colorprop}{3}\) | \(\textcolor{colorprop}{5}\) |
Definition Slope-Intercept Form
The slope-intercept form of a line's equation is:$$y = mx + c$$where \(m\) is the slope (gradient) and \(c\) is the \(y\)-intercept.
- The slope \(m\) tells us how much \(y\) changes when \(x\) increases by \(1\).
- The \(y\)-intercept \(c\) is the value of \(y\) when \(x = 0\), i.e. the point where the line crosses the \(y\)-axis.
Example
Graphing Line Equations
Method Graphing a Line Using Two Points
To graph a line given by \(y = mx + c\):
- Find the first point \((x_1, y_1)\):
- Choose any convenient value for \(x_1\) (often an integer).
- Substitute \(x_1\) into the equation to calculate \(y_1\).
- Find a second point \((x_2, y_2)\):
- Choose a different value for \(x_2\).
- Substitute \(x_2\) into the equation to calculate \(y_2\).
- Draw the line:
- Plot both points on a graph.
- Use a ruler to draw a straight line passing through both points.
Example
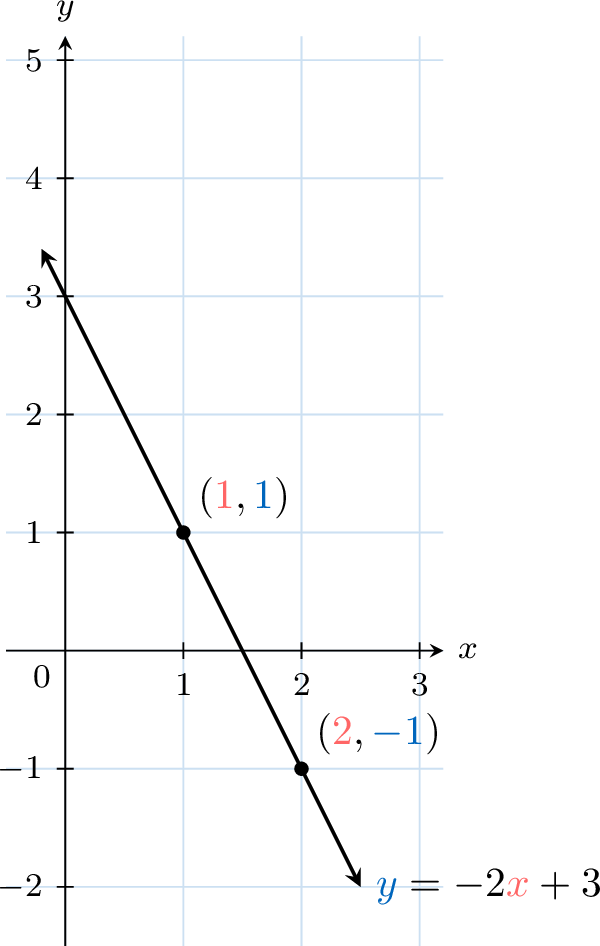
Graph the line \(y = -2x + 3\).
- For \(\textcolor{colordef}{x} = \textcolor{colordef}{1}\),$$\begin{aligned}[t]\textcolor{colorprop}{y} &= -2 \times \textcolor{colordef}{1} + 3 \\ &= \textcolor{colorprop}{1}\end{aligned}$$
- For \(\textcolor{colordef}{x} = \textcolor{colordef}{2}\),$$\begin{aligned}[t]\textcolor{colorprop}{y} &= -2 \times \textcolor{colordef}{2} + 3 \\ &= \textcolor{colorprop}{-1}\end{aligned}$$
- So, the points \((\textcolor{colordef}{1}, \textcolor{colorprop}{1})\) and \((\textcolor{colordef}{2}, \textcolor{colorprop}{-1})\) are on the graph.
Method Graphing a Line Using the \(y\)-Intercept and Slope
To graph a line \(y = mx + c\):
- Plot the \(y\)-intercept:
- Mark the point \((0, c)\) on the graph.
- Use the slope \(m\) to find a second point:
- From \((0, c)\), move horizontally by a chosen amount \(\Delta x\) (for example, \(1\) or \(2\) units).
- Then move vertically by \(\Delta y = m \cdot \Delta x\).
- Mark the second point.
- Draw the line:
- Draw a straight line passing through both points.
Example
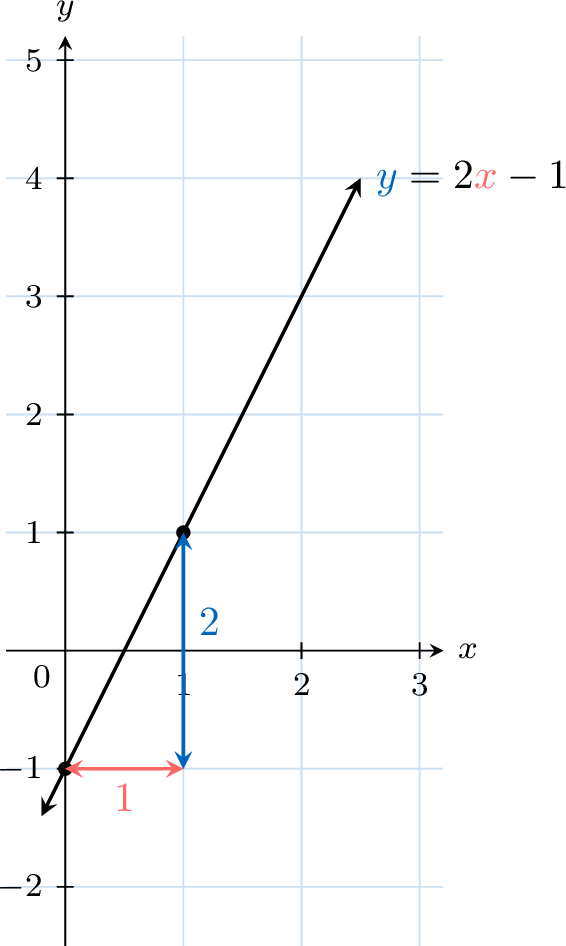
Graph the line \(y = 2x - 1\).
- The \(y\)-intercept is \(-1\), so plot the point \((0, -1)\).
- The slope is \(2\): from \((0, -1)\), move \(1\) unit right (\(\Delta x = 1\)), then \(2\) units up (\(\Delta y = 2\)), to reach \((1, 1)\).
- Draw the line through these two points.