Line Equations
Definition
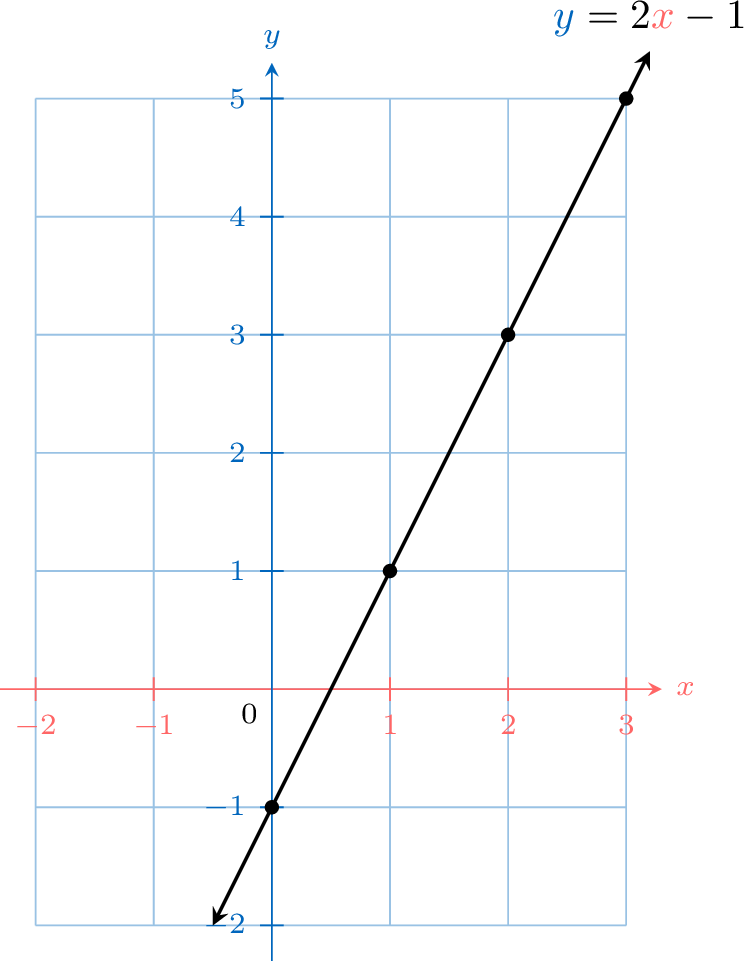
An equation like \(\textcolor{colorprop}{y}=2\textcolor{colordef}{x}-1\) describes a relationship between the variables \(\textcolor{colordef}{x}\) and \(\textcolor{colorprop}{y}\). For any value of \(\textcolor{colordef}{x}\) we choose, the equation tells us the corresponding value of \(\textcolor{colorprop}{y}\).
We can use this to find coordinates \((\textcolor{colordef}{x}, \textcolor{colorprop}{y})\) for points that satisfy the equation.
We can use this to find coordinates \((\textcolor{colordef}{x}, \textcolor{colorprop}{y})\) for points that satisfy the equation.
- If \(\textcolor{colordef}{x} = \textcolor{colordef}{1}\), then \(\textcolor{colorprop}{y} = 2(\textcolor{colordef}{1}) - 1 = \textcolor{colorprop}{1}\). This gives us the point \((1, 1)\).
- If \(\textcolor{colordef}{x} = \textcolor{colordef}{2}\), then \(\textcolor{colorprop}{y} = 2(\textcolor{colordef}{2}) - 1 = \textcolor{colorprop}{3}\). This gives us the point \((2, 3)\).
| \(\textcolor{colordef}{x}\) | \(\textcolor{colordef}{0}\) | \(\textcolor{colordef}{1}\) | \(\textcolor{colordef}{2}\) | \(\textcolor{colordef}{3}\) |
| \(\textcolor{colorprop}{y}\) | \(\textcolor{colorprop}{-1}\) | \(\textcolor{colorprop}{1}\) | \(\textcolor{colorprop}{3}\) | \(\textcolor{colorprop}{5}\) |
Definition Slope-Intercept Form
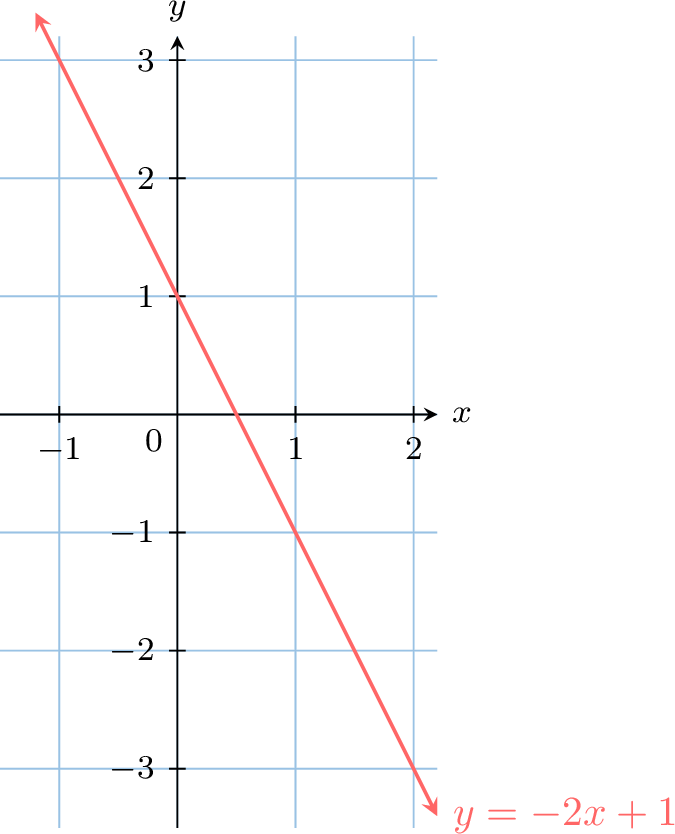
The slope-intercept form of a line's equation is:$$y = mx + c$$where \(m\) is the slope (gradient) and \(c\) is the \(y\)-intercept.
- The slope \(m\) tells us how much \(y\) changes when \(x\) increases by \(1\).
- The \(y\)-intercept \(c\) is the value of \(y\) when \(x = 0\), i.e. the point where the line crosses the \(y\)-axis.
Example