Functions
Definitions
A function is like a machine that follows a specific rule. For every number you put in, you get exactly one number out.
Let's imagine a machine whose rule is "multiply by 2".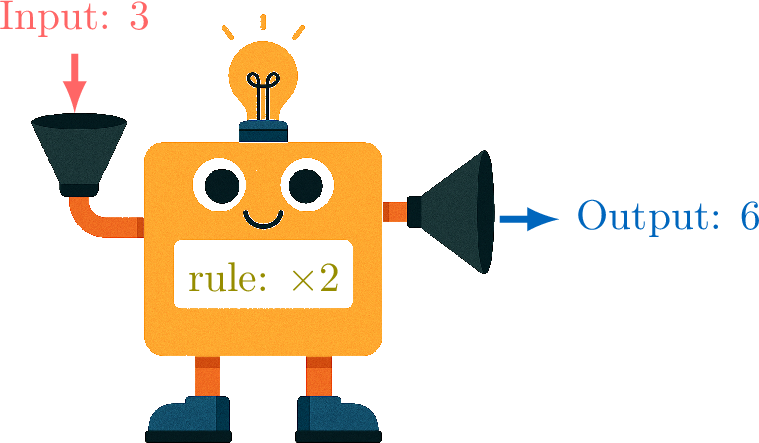
To represent this machine, we write \(\textcolor{olive}{f}(\textcolor{colordef}{\text{input}}) = \textcolor{colorprop}{\text{output}}\). The parentheses \((\) \()\) indicate that the function \(\textcolor{olive}{f}\) is applied to the input.
We use function notation to name functions and their variables, replacing “\(\textcolor{colordef}{\text{input}}\)” by “\(\textcolor{colordef}{x}\)” and “\(\textcolor{colorprop}{\text{output}}\)” by “\(\textcolor{colorprop}{f(x)}\)”.
For example, if the rule is “twice the input”:
When the input is \(\textcolor{colordef}{x} = \textcolor{colordef}{1}\), we get:$$\begin{aligned}\textcolor{olive}{f}(\textcolor{colordef}{1}) &= 2 \times \textcolor{colordef}{1}\\ &= \textcolor{colorprop}{2}\end{aligned}$$
Let's imagine a machine whose rule is "multiply by 2".
| Input | 3 | 5 | 8 | 10 |
| Output | 6 | 10 | 16 | 20 |
To represent this machine, we write \(\textcolor{olive}{f}(\textcolor{colordef}{\text{input}}) = \textcolor{colorprop}{\text{output}}\). The parentheses \((\) \()\) indicate that the function \(\textcolor{olive}{f}\) is applied to the input.
We use function notation to name functions and their variables, replacing “\(\textcolor{colordef}{\text{input}}\)” by “\(\textcolor{colordef}{x}\)” and “\(\textcolor{colorprop}{\text{output}}\)” by “\(\textcolor{colorprop}{f(x)}\)”.
For example, if the rule is “twice the input”:
When the input is \(\textcolor{colordef}{x} = \textcolor{colordef}{1}\), we get:$$\begin{aligned}\textcolor{olive}{f}(\textcolor{colordef}{1}) &= 2 \times \textcolor{colordef}{1}\\ &= \textcolor{colorprop}{2}\end{aligned}$$
Definition Function
A function is a rule that assigns to each input value from a set called the domain exactly one output value in a set called the range.
We use the notation \(f(x)\) to represent the output of a function \(f\) when the input is \(x\).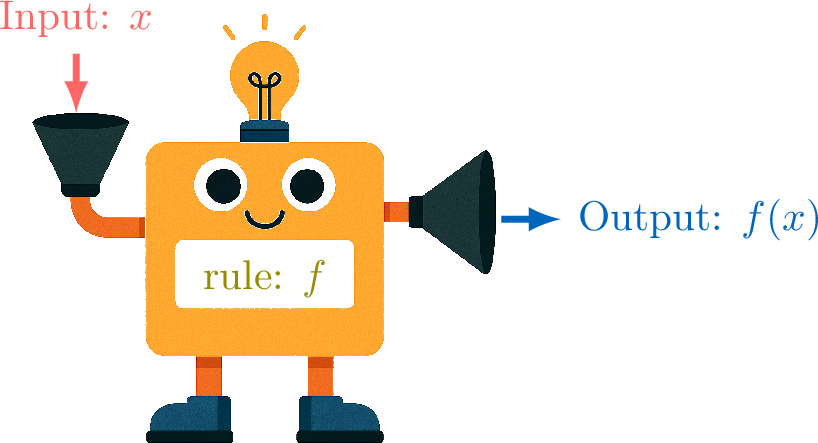
We use the notation \(f(x)\) to represent the output of a function \(f\) when the input is \(x\).
- \(f\) is the name of the function (the rule).
- \(x\) is the input variable.
- \(f(x)\) is the output value when the input is \(x\). It is read as “\(f\) of \(x\)”.
Example
The function \(f\) is defined by the rule \(f(x)=2x-1\). Find the value of \(f(5)\).
To find \(f(5)\), we substitute the input value \(x=5\) into the function's rule:$$\begin{aligned}[t]f(x) &= 2x - 1 \\
f(5) &= 2(5) - 1 \\
&= 10 - 1 \\
&= \boldsymbol{9}\end{aligned}$$
Tables of Values
Definition Table of Values
A table of values is a table that organizes the relationship between the input values (\(x\)) and their corresponding output values (\(f(x)\)) for a function.
Example
Complete the table of values for the function \(f(x)=x^2\).
| \(x\) | \(-2\) | \(-1\) | \(0\) | \(1\) | \(2\) |
| \(f(x)\) |
We substitute each value of \(x\) into the function \(f(x)=x^2\):
- \(\begin{aligned}[t] f(-2) &= (-2)^2 \\ &= 4 \end{aligned}\)
- \(\begin{aligned}[t] f(-1) &= (-1)^2\\ &= 1 \end{aligned}\)
- \(\begin{aligned}[t] f(0) &= (0)^2 \\ &= 0 \end{aligned}\)
- \(\begin{aligned}[t] f(1) &= (1)^2 \\ &= 1 \end{aligned}\)
- \(\begin{aligned}[t] f(2) &= (2)^2 \\ &= 4 \end{aligned}\)
| \(x\) | \(-2\) | \(-1\) | \(0\) | \(1\) | \(2\) |
| \(f(x)\) | \(4\) | \(1\) | \(0\) | \(1\) | \(4\) |
Graphs of Functions
While a table of values is useful for listing some input–output pairs of a function, a graph is a powerful tool for visualizing how the output changes when the input changes. A graph gives us a picture of the function's behavior.
Definition Graph of a Function
The graph of a function \(f\) is the set of all points with coordinates \((\textcolor{colordef}{x}, \textcolor{colorprop}{f(x)})\) in a coordinate plane. The input value, \(x\), is plotted on the horizontal axis (the x-axis), and the output value, \(f(x)\), is plotted on the vertical axis (the y-axis). When the function is defined for all \(x\) in an interval, we can connect these points to form the curve of the function.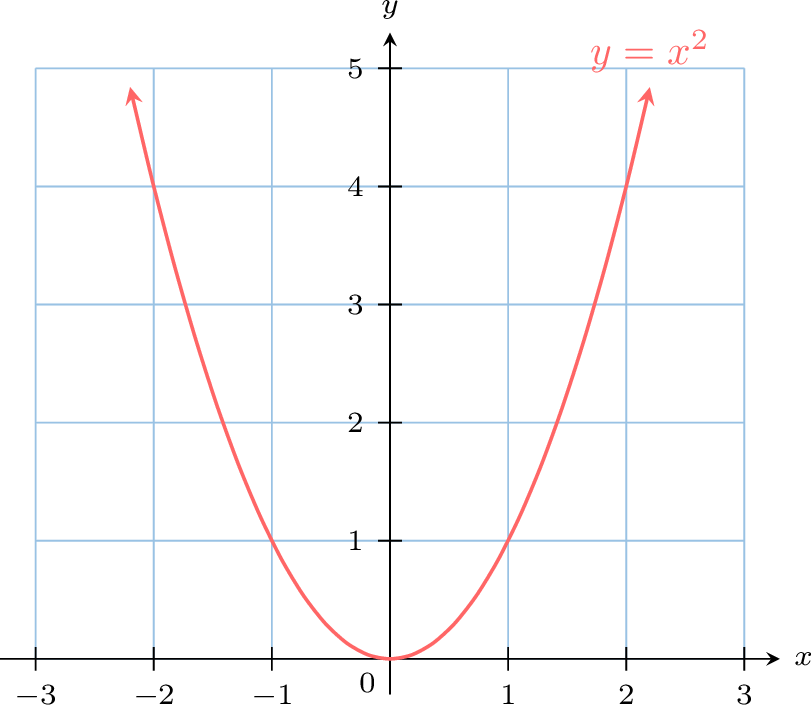
Method Plotting a Graph from a Table
To plot the graph of a function from its table of values:
- Draw a coordinate plane with a suitable scale on each axis and label the axes.
- For each pair \((x, f(x))\) in the table, plot the corresponding point on the coordinate plane.
- If the function is defined for all \(x\) in the interval shown, connect the points with a straight line or a smooth curve.
Example
Plot the graph of the function \(f(x) = x - 1\) using its table of values.
| \(x\) | \(-2\) | \(-1\) | \(0\) | \(1\) | \(2\) | \(3\) |
| \(f(x)\) | \(-3\) | \(-2\) | \(-1\) | \(0\) | \(1\) | \(2\) |
We plot the points \((-2, -3)\), \((-1, -2)\), \((0, -1)\), \((1, 0)\), \((2, 1)\), and \((3, 2)\) from the table. These points lie on the same straight line, so we connect them to draw the graph of \(f(x)=x-1\).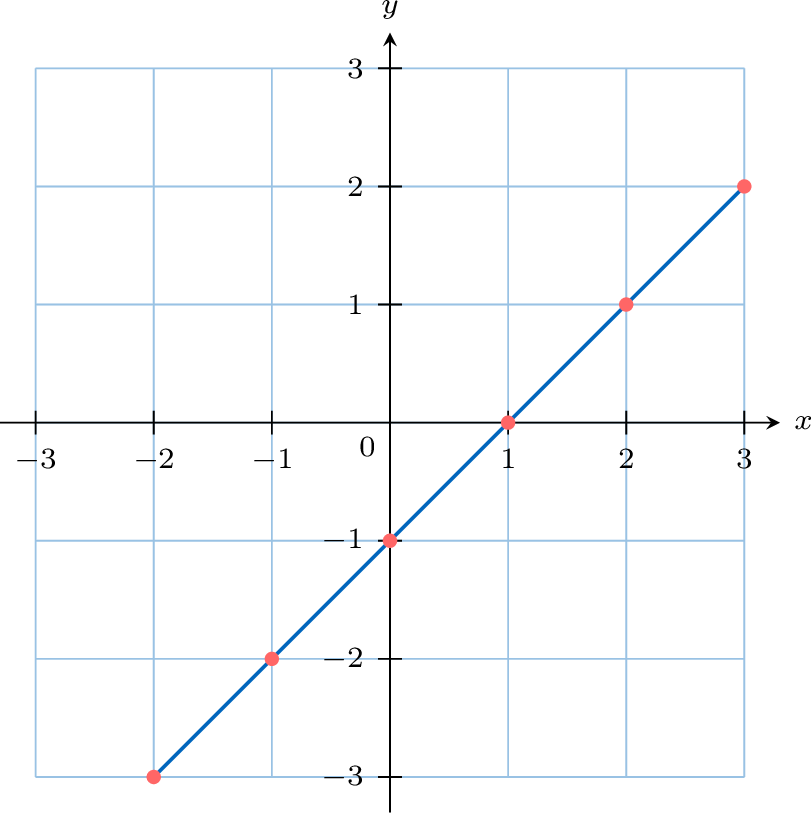
Method Finding the Value of \(f(x)\) from a Graph
To find the output \(f(x)\) for a given input \(x\) using a graph:
- Locate the input value on the horizontal x-axis.
- Move vertically from that point until you reach the curve of the function.
- Move horizontally from the intersection point to the vertical y-axis and read the corresponding value. This y-value is the output \(f(x)\).
Example
Using the graph of the function \(f\) below, find the value of \(f(2)\).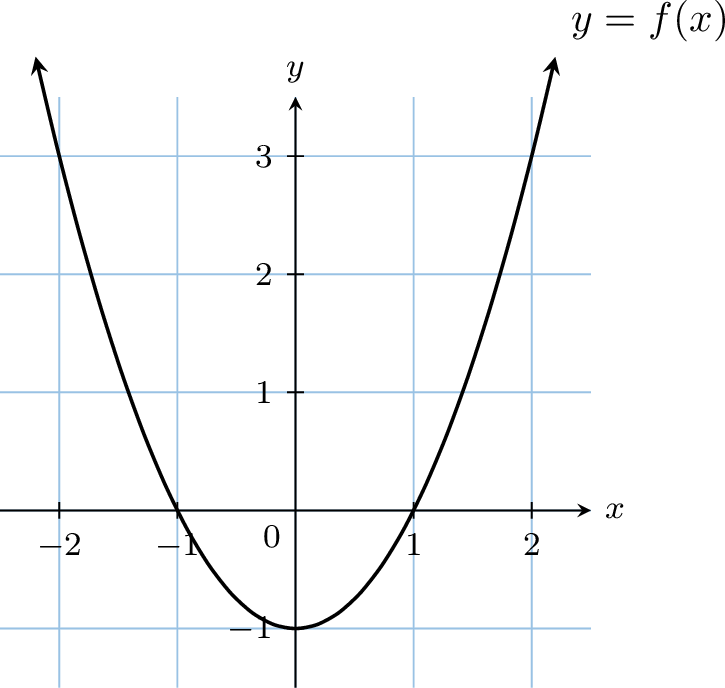
We follow the graphical method: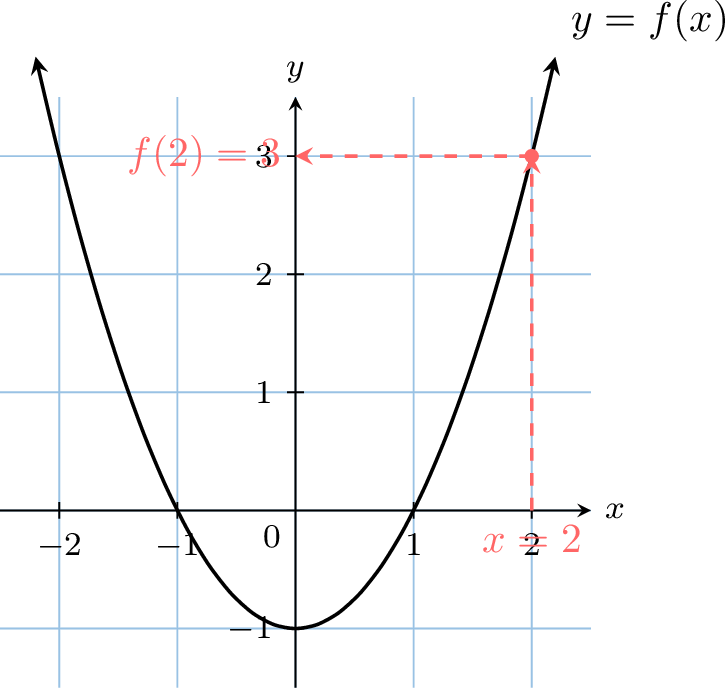
- Start at \(x=2\) on the horizontal axis.
- Move up to meet the curve.
- Move horizontally to the vertical axis and read the value, which is \(3\).