Coordinate Geometry
Coordinate Plane
Definition Coordinate Plane
A coordinate plane is a grid formed by two number lines that intersect at their zero point, called the origin. The origin has coordinates \((0,0)\).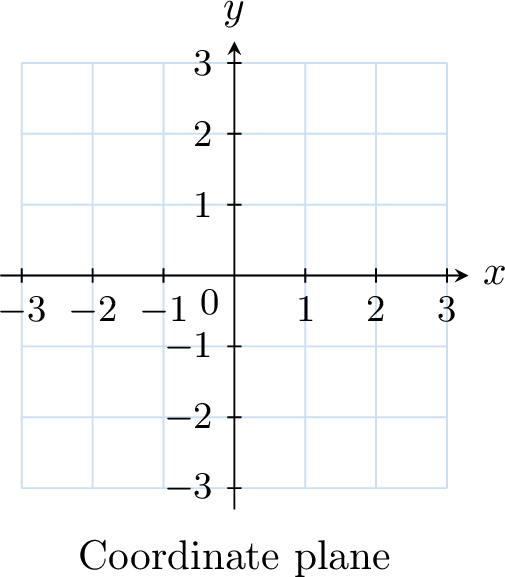
- The horizontal number line is called the \(x\)-axis.
- The vertical number line is called the \(y\)-axis.
Definition Coordinates of a Point
The coordinates of a point are a pair of numbers, written as \((x, y)\), where \(x\) is the \(x\)-coordinate and \(y\) is the \(y\)-coordinate: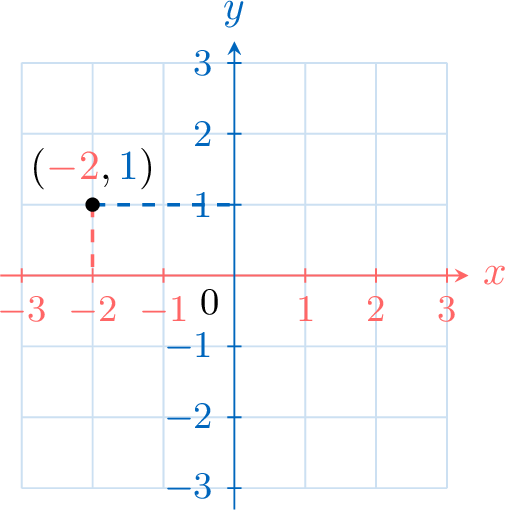
- The \(x\)-coordinate indicates the horizontal position along the \(x\)-axis, with positive numbers to the right of the origin and negative numbers to the left.
- The \(y\)-coordinate indicates the vertical position along the \(y\)-axis, with positive numbers above the origin and negative numbers below.
Example
Plot these points on a coordinate plane:$$A(-2,3),\quad B(3,-1),\quad \text{and}\quad C(-3,-2).$$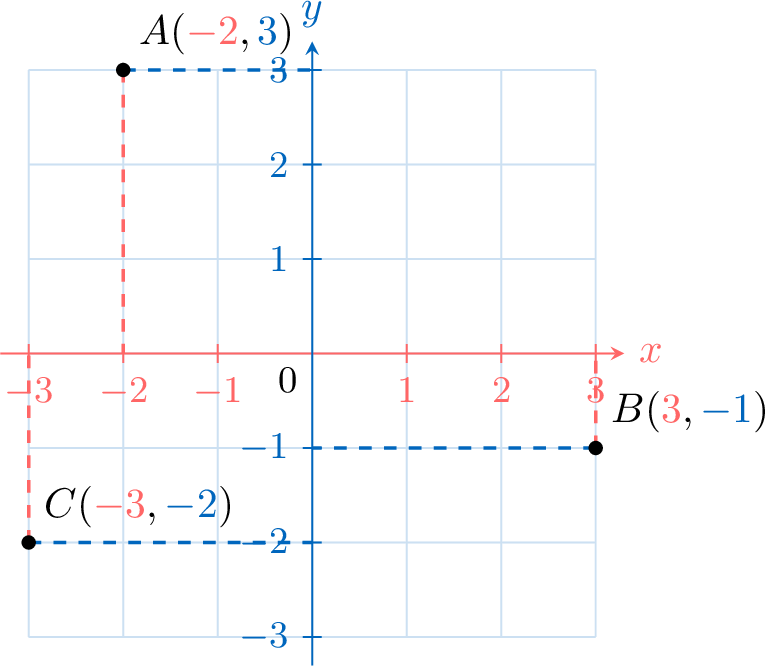
Table of Points
Definition Table of Points
A table of points lists the coordinates of several points in a coordinate plane.
- The first row represents the \(x\)-coordinates.
- The second row represents the \(y\)-coordinates.
Example
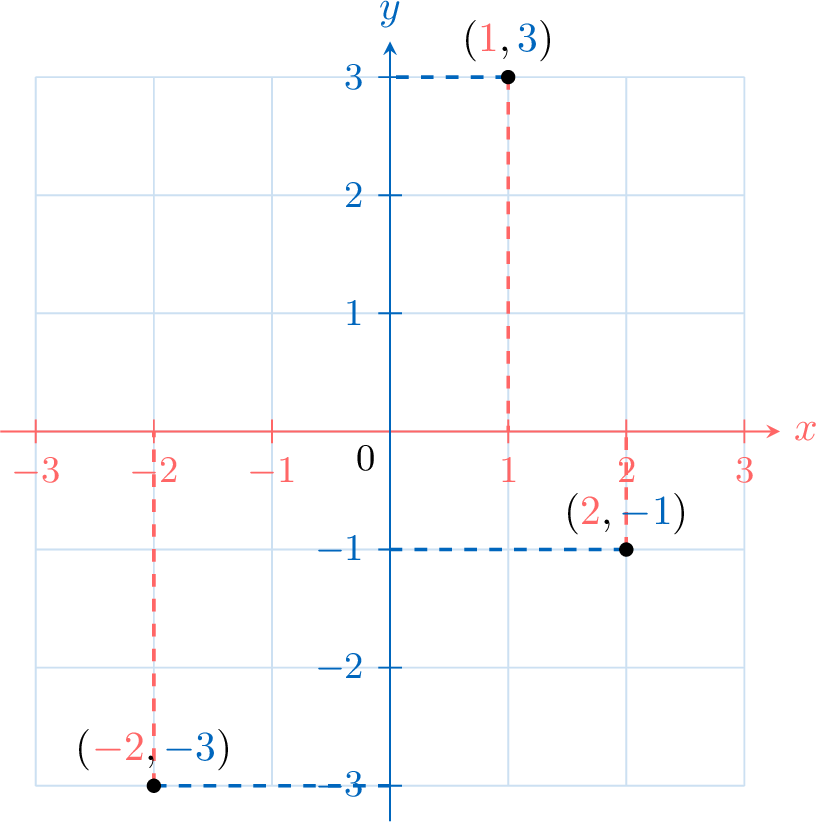
| \(\textcolor{colordef}{x}\) | \(\textcolor{colordef}{-2}\) | \(\textcolor{colordef}{1}\) | \(\textcolor{colordef}{2}\) |
| \(\textcolor{colorprop}{y}\) | \(\textcolor{colorprop}{-3}\) | \(\textcolor{colorprop}{3}\) | \(\textcolor{colorprop}{-1}\) |