Statistics
Statistical Investigation Process
Statistics are all around us, from sports averages to news reports about the weather.
- A basketball player averages 14.6 points per game.
- Last year was the hottest year on record since 1897.
Definition Statistics
Statistics is the science of designing investigations and then collecting, organizing, analyzing, and interpreting data to answer a specific question.
Method Statistical Investigation Process
A statistical investigation follows these five key steps:
- Pose the Question: Define clearly what you want to investigate.
- Collect Data: Gather information relevant to your question.
- Analyze Data: Calculate summary statistics, such as frequencies, means, or modes.
- Represent Data: Display the organized data visually using graphs and charts.
- Interpret Data: Draw conclusions to answer your question.
Step 1: Posing the Question
Definition Statistical Problem
A statistical problem is a clear, focused question that can be answered by collecting and analyzing data.
Example
Let's investigate the problem: "What is the favorite school subject of students in our class?"
Definition Population
A population is the entire group of people or things that you want to study.
Example
For our survey, the population is all 25 students in our class.
Definition Data
Data is the information we collect, like numbers, words, measurements, or observations.
Example
The data we collect will be the list of answers from each student, such as "Math", "Art", "Science", "Art", "Sport", etc.
Definition Types of Variables
Data can be described by different types of variables:
- Qualitative variable (categorical): Describes a quality or category. The possible answers are words or labels. Think: "What kind?" (e.g., eye color, favorite food).
- Quantitative variable (numerical): Describes a quantity or number that can be counted or measured. Think: "How many?" or "How much?" (e.g., height, number of siblings).
Example
For our survey:
- The variable "Favorite Subject" is qualitative because the answers are categories (Math, Art, etc.).
- The variable "How many hours do you do homework per week?" is quantitative because the answer will be a number that can be measured (e.g., 2 hours, 5 hours).
Step 2: Collecting Data
Definition Census
A census is a survey that collects data from every single member of a population.
Method Collecting and Recording Survey Data
Once you have your question and have identified your population, you need a systematic way to collect and record the answers. For a census of a small group (like your class), a tally table is an efficient tool.
- Prepare a Tally Table: Before you start, create a table with a column for each possible answer category and a column for tally marks.
- Conduct the Survey: Ask each person in your population the survey question one by one.
- Record Each Answer: For each answer you receive, place one tally mark
 in the row for the corresponding category. Remember to make the fifth mark a diagonal line across the first four
  to make counting easier.
Example
Collecting data for the question "What is your favorite school subject?"
As you survey each of the 25 students, you would fill out the tally column. After asking all 25 students, your tally table would look like this:
As you survey each of the 25 students, you would fill out the tally column. After asking all 25 students, your tally table would look like this:
| Subject | Tally Marks |
| Math | |
| Science | |
| Sport | |
| Art | |
Step 3: Analyzing Data
Descriptive statistics are numbers, such as the frequency, mean or mode, that summarize key features of a dataset.
Definition Frequency and Relative Frequency
Frequency (or count) is how many times each category appears in our data.
Relative frequency is the proportion of the data that falls into a category. We can write it as a fraction, a decimal, or a percentage.$$ \text{Relative frequency (in }\pourcent\text{)} = \frac{\text{Frequency}}{\text{Total number of data values}} \times 100\pourcent $$
Relative frequency is the proportion of the data that falls into a category. We can write it as a fraction, a decimal, or a percentage.$$ \text{Relative frequency (in }\pourcent\text{)} = \frac{\text{Frequency}}{\text{Total number of data values}} \times 100\pourcent $$
Example
Let's calculate the relative frequency for our "Favorite Subject" survey of 25 students:
| Subject | Frequency | Relative Frequency |
| Math | 8 | \(8/25\times 100\pourcent = 32\pourcent\) |
| Science | 5 | \(5/25\times 100\pourcent = 20\pourcent\) |
| Sport | 7 | \(7/25\times 100\pourcent = 28\pourcent\) |
| Art | 5 | \(5/25\times 100\pourcent = 20\pourcent\) |
| Total | 25 | 100\(\pourcent\) |
Definition Mode
The mode is the value or category that appears most frequently. A dataset can have more than one mode.
Example
The results of the "Favorite Subject" survey are shown in the frequency table below.
| Subject | Frequency |
| Math | 8 |
| Science | 5 |
| Sport | 7 |
| Art | 5 |
The mode is the category with the highest frequency. By looking at the table, the highest frequency is 8.
The subject corresponding to this frequency is Math. Therefore, the mode is Math. This means it is the favorite subject.
The subject corresponding to this frequency is Math. Therefore, the mode is Math. This means it is the favorite subject.
Definition Mean
The mean is the sum of all numerical values divided by the count of values. It is only used for quantitative data:$$ \bar{x} = \frac{\text{sum of all values}}{\text{number of values}} $$
Example
A survey asked 9 students to rate how much they like their favorite subject on a scale from 0 (dislike) to 5 (love). The ratings were:$$1, 4, 2, 3, 5, 4, 5, 4, 4$$Calculate the mean rating for this dataset.
To find the mean rating, we sum the values and divide by the number of students.$$ \text{Mean} = \frac{1 + 4 + 2 + 3 + 5 + 4 + 5 + 4 + 4}{9} = \frac{32}{9} \approx 3.56 $$The mean rating is approximately 3.56. This indicates that the central tendency of the group's opinion is positive, leaning closer to "4" than "3" on the 0–5 scale.
Step 4: Representing Data
Once data is organized in a table, we can create graphs to see the patterns visually. Bar charts are excellent for comparing frequencies, while pie charts are best for showing proportions.
Definition Bar Chart
A bar chart uses rectangular bars where the height of each bar represents its frequency. It can be used for both qualitative and quantitative data.
- For qualitative (categorical) data, each bar represents a distinct category (e.g., "Math", "Science"). The bars are typically drawn with gaps between them to show the categories are separate.
- For quantitative (numerical) data, each bar represents a specific number (e.g., a score of "3", or "4 siblings"). The numbers are placed in order along the horizontal axis.
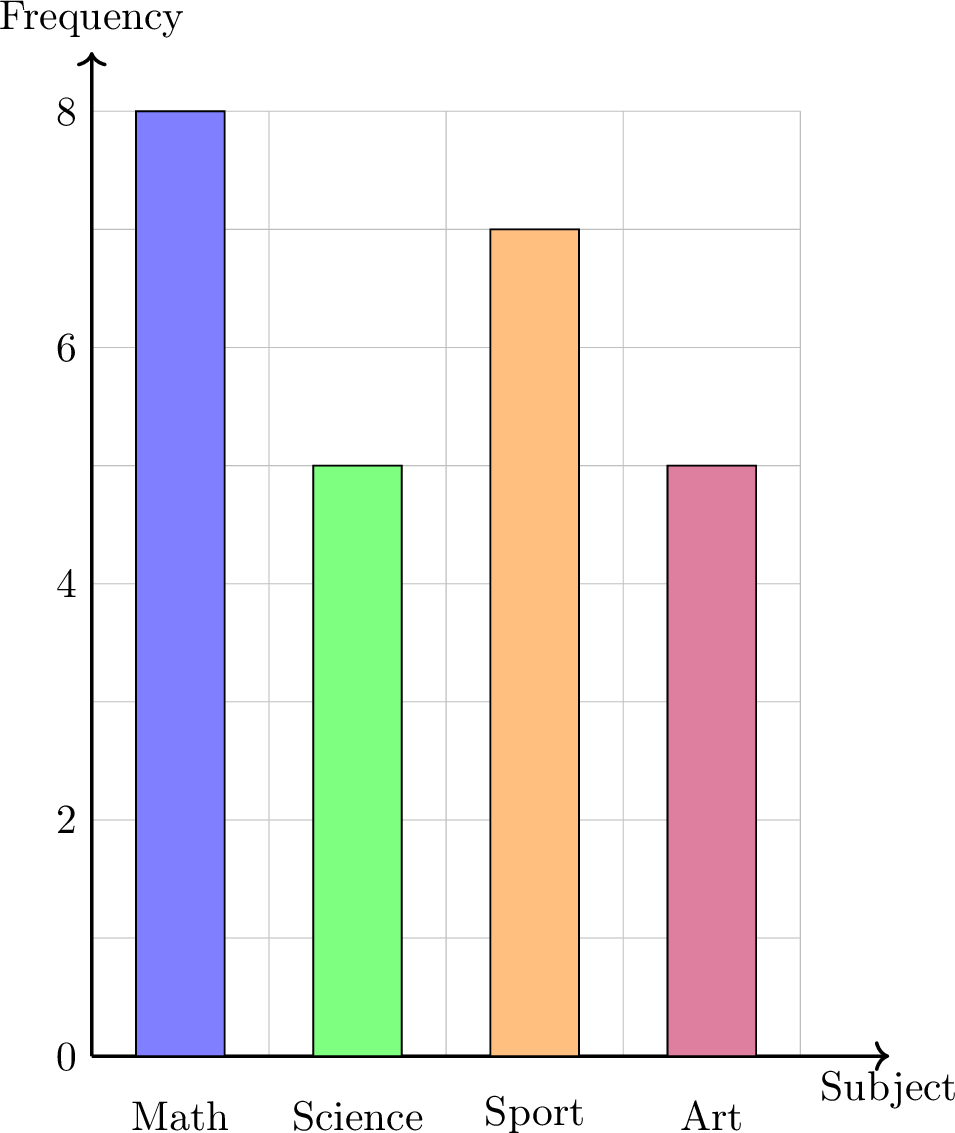
Example
Draw a bar chart for our "Favorite Subject" survey data.
| Subject | Frequency |
| Math | 8 |
| Science | 5 |
| Sport | 7 |
| Art | 5 |
Definition Pie Chart
A pie chart shows the proportion of each category as a slice of a circle. If the relative frequency of a category is written as a decimal (for example \(0.32\)), the angle for its slice is calculated as:$$ \text{Angle} = \text{Relative Frequency} \times 360^\circ. $$
Example
Draw a pie chart for our "Favorite Subject" survey data (Total = 25 students).
| Subject | Frequency | Relative Frequency |
| Math | 8 | \(32\pourcent\) |
| Science | 5 | \(20\pourcent\) |
| Sport | 7 | \(28\pourcent\) |
| Art | 5 | \(20\pourcent\) |
First, calculate the angle for each slice: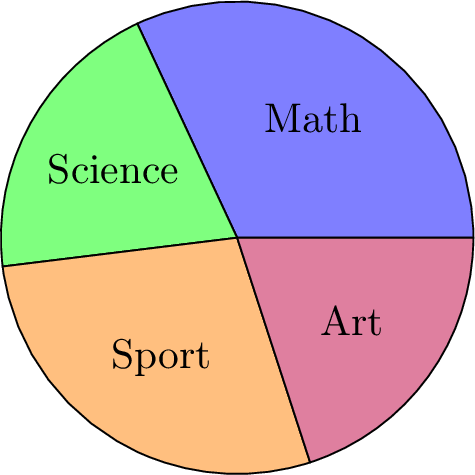
- Math: \(0.32 \times 360^\circ \approx 115^\circ\)
- Science: \(0.20 \times 360^\circ = 72^\circ\)
- Sport: \(0.28 \times 360^\circ \approx 101^\circ\)
- Art: \(0.20 \times 360^\circ = 72^\circ\)
Step 5: Interpreting Data
Method A Method for Interpreting Data
Interpretation is the final and most important step. It’s where you explain the story your data tells. Follow these steps to write a strong interpretation.
- State the Main Findings: Start by describing the most obvious points. What is the most popular category (the mode)? What is the least popular?
- Make Comparisons: Use comparative words (e.g., "more than," "less than," "twice as many") to compare different categories. Perform simple calculations if needed.
- Use Specific Data as Evidence: Support your statements with numbers. Use frequencies (counts) or relative frequencies (percentages) from your table or chart.
- Draw a Conclusion: Write a concluding sentence that directly answers your original statistical question.
- Reflect and Ask New Questions: Think about what your data doesn't tell you. Does this result apply to the whole school, or just your class? What could you investigate next?
Example Interpreting the "Favorite Subject" Survey
Let's apply the 5-step method to interpret the results from our survey on favorite subjects.
| Subject | Frequency | Relative Frequency |
| Math | 8 | \(32\pourcent\) |
| Science | 5 | \(20\pourcent\) |
| Sport | 7 | \(28\pourcent\) |
| Art | 5 | \(20\pourcent\) |
- Main Findings: The data shows that Math is the most popular subject. The least popular subjects are Science and Art, which are tied.
- Comparisons: More students chose Math (8) than Sport (7). The number of students who prefer Science is the same as the number who prefer Art (5).
- Evidence: Math is the favorite for 32\(\pourcent\) of the class, making it the clear mode.
- Conclusion: In conclusion, based on our survey of 25 students, the favorite subject in this class is Math.
- Reflection: This conclusion only applies to our class of 25 students. A new question for a future investigation could be: "Is Math also the favorite subject in the entire school?"