Coordinate Geometry
Coordinate Plane
Definition Coordinate Plane
A coordinate plane is a grid formed by two number lines that cross at zero. One number line goes left and right (called the x-axis), and the other goes up and down (called the y-axis). The point where they cross is called the origin and has coordinates \((0,0)\).
The coordinates of a point are a pair of numbers, like \(A(3,2)\). The first number is the \(x\)-coordinate and tells you how far to move along the \(x\)-axis. The second number is the \(y\)-coordinate and tells you how far to move along the \(y\)-axis.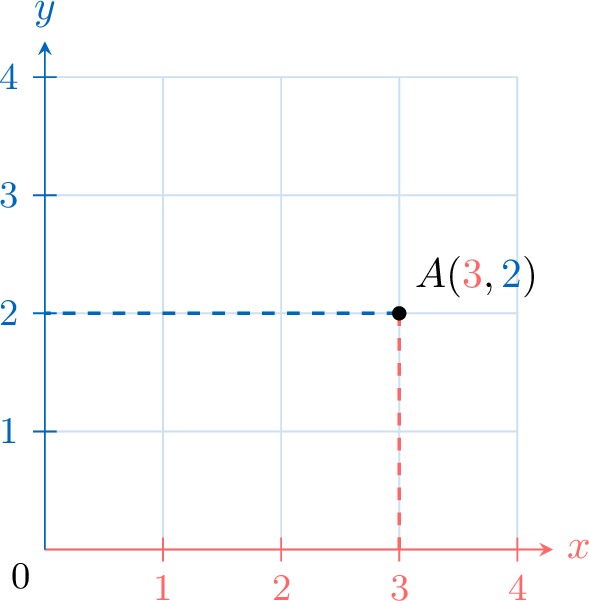
The coordinates of a point are a pair of numbers, like \(A(3,2)\). The first number is the \(x\)-coordinate and tells you how far to move along the \(x\)-axis. The second number is the \(y\)-coordinate and tells you how far to move along the \(y\)-axis.
Example
Plot these points on a coordinate plane: \(A(2,3)\), \(B(4,2)\), and \(C(0,1)\).
- For \(A(2,3)\): Start at the origin \((0,0)\), move 2 units along the \(x\)-axis, then 3 units up along the \(y\)-axis.
- For \(B(4,2)\): Start at \((0,0)\), move 4 units along the \(x\)-axis, then 2 units up along the \(y\)-axis.
- For \(C(0,1)\): Stay at \(0\) on the \(x\)-axis, then move 1 unit up along the \(y\)-axis.
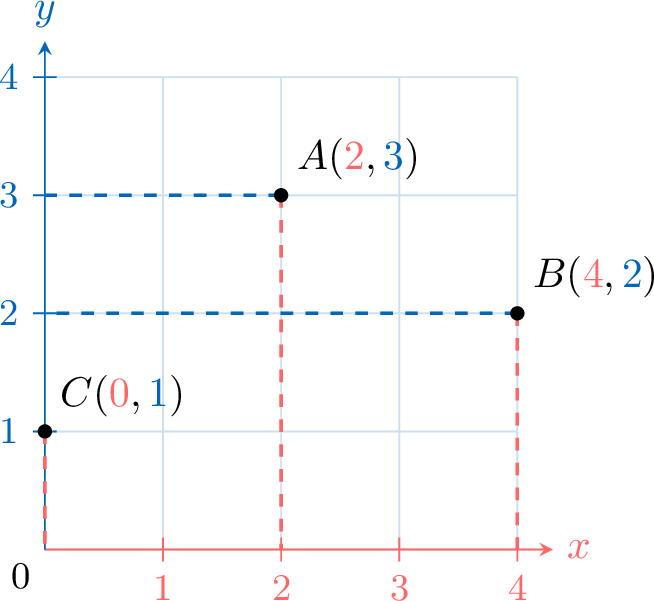
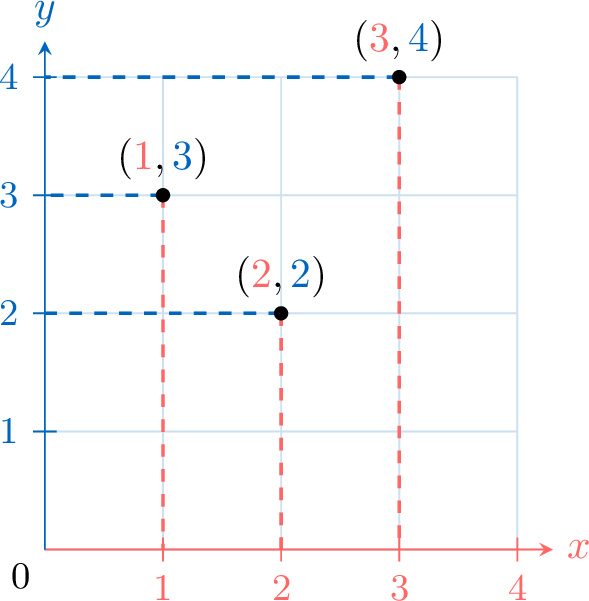
Table of Points
Definition Table of Points
A table of points lists the coordinates of several points in a coordinate plane.
- The first row represents the \(x\)-coordinates.
- The second row represents the \(y\)-coordinates.
Example
| \(\textcolor{colordef}{x}\) | \(\textcolor{colordef}{1}\) | \(\textcolor{colordef}{2}\) | \(\textcolor{colordef}{3}\) |
| \(\textcolor{colorprop}{y}\) | \(\textcolor{colorprop}{3}\) | \(\textcolor{colorprop}{2}\) | \(\textcolor{colorprop}{4}\) |