Functions
What is a Function?
Have you ever noticed that some things always change in the same way? For example, if you know the number of bicycles, you can always find the number of wheels by multiplying by 2. In math, we have a special name for a rule that tells us how to get one number from another: a function.
You can imagine a function as a magic machine. You put a number in (the input), the machine uses its rule, and it gives you back a new number (the output). If you put in the same input, you will always get the same output.
You can imagine a function as a magic machine. You put a number in (the input), the machine uses its rule, and it gives you back a new number (the output). If you put in the same input, you will always get the same output.
Definition Function
A function is a rule that takes an input number and gives back exactly one output number. For each input, the function machine always gives the same output and follows the same rule every time.
Example
Let’s see how a function machine works.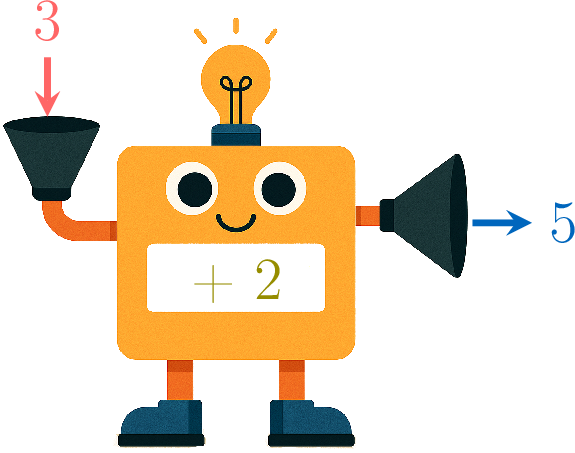
- The rule of the function is: \(\textcolor{olive}{\text{add 2}}\).
- The input is: \(\textcolor{colordef}{3}\).
- The output is: \(\textcolor{colordef}{3}\textcolor{olive}{+2} = \textcolor{colorprop}{5}\).
Table of Values
A function machine follows one rule, but we can give it many different inputs. To keep track of the output for each input, we can organize our results in a special chart called a table of values.
Definition Table of Values
A table of values is a table that organizes and displays several pairs of input and output values for one function.
Example
Let's make a table of values for the function with the rule “add 2” to the input.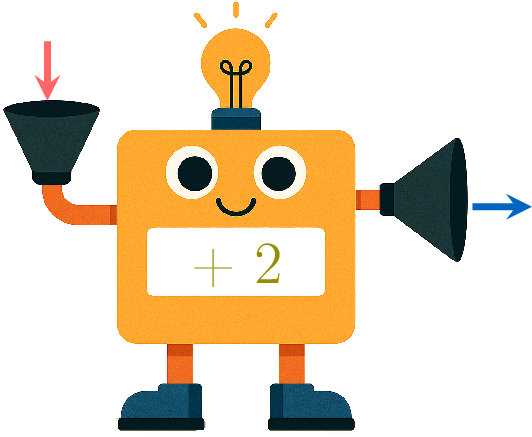
| Input | 2 | 3 | 4 |
| Output | 4 | 5 | 6 |
Graphs of Functions
So far, we have organized the inputs and outputs of a function using a table of values. Another way to show the relationship between the inputs and outputs is to draw a picture of how they are related on a coordinate plane. This picture is called a graph of the function.
Definition Line Graph
A line graph is a visual representation of a function on a coordinate plane. It is created by plotting the \((\textcolor{colordef}{\text{Input}},\textcolor{colorprop}{\text{Output}})\) pairs as points, with the input on the horizontal axis and the output on the vertical axis, and then connecting them with straight line segments.
Example
Draw the line graph for the function rule "add 2" 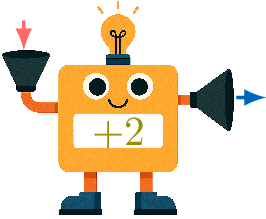 , using the given table of values.
, using the given table of values.| Input | 1 | 2 | 3 | 4 |
| Output | 3 | 4 | 5 | 6 |
First, we read the pairs of values from the table and write them as coordinate points: \((1,3)\), \((2,4)\), \((3,5)\), and \((4,6)\). In each pair, the first number is the input (the \(x\)-coordinate) and the second number is the output (the \(y\)-coordinate).
Then, we plot these points on the coordinate plane and connect them in order with line segments.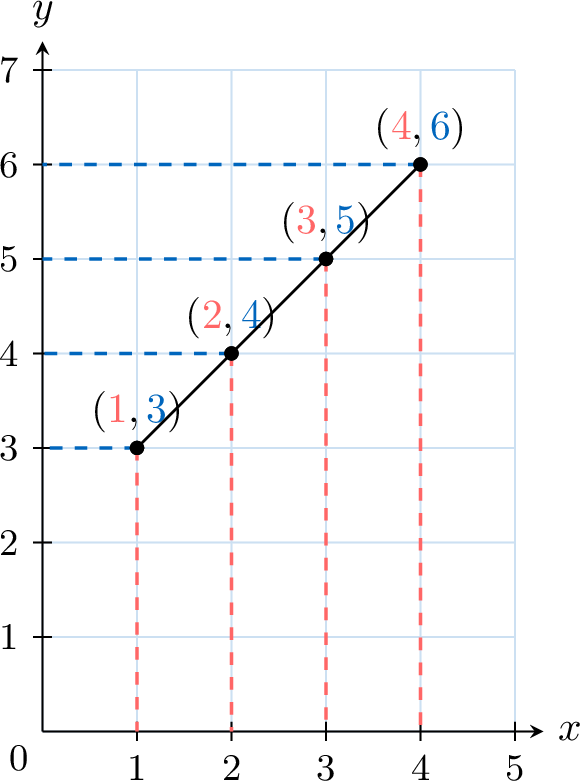
Then, we plot these points on the coordinate plane and connect them in order with line segments.