Relation
What is a Relation?
Definition Relation
A relation describes how two variables (quantities) are connected.
In mathematics, we often use the letters \(\textcolor{colordef}{x}\) and \(\textcolor{colorprop}{y}\) to represent variables. A variable is a quantity that can take different values.
In other contexts, we often use the first letter of the name of the quantity. For example, the variable time is represented by the letter \(t\).
In other contexts, we often use the first letter of the name of the quantity. For example, the variable time is represented by the letter \(t\).
Example
We study the height of a child at different ages.
State the two variables.
State the two variables.
- Time in years: this is the variable \(\textcolor{colordef}{t}\). It changes as the child gets older.
- Height of the child in cm: this is the variable \(\textcolor{colorprop}{h}\). It tells us how tall the child is.
Tables
Definition Table
A table is used to organize data so that it is easier to display and study the relationship between variables. Usually, one row (or column) is used for the first variable and another row (or column) for the second variable.
Example
Hugo's height as a function of age is given by the following table:
| \(\textcolor{colordef}{t\text{ (years)}}\) | \(0\) | \(1\) | \(2\) | \(3\) | \(4\) | \(5\) | \(6\) |
| \(\textcolor{colorprop}{h\text{ (cm)}}\) | \(52\) | \(67\) | \(78\) | \(86\) | \(98\) | \(106\) | \(115\) |
Hugo's height at \(4\) years old is \(\textcolor{colorprop}{98}\) centimeters.
Graphs
Definition Graph
A graph of a relation is the set of points \((\textcolor{colordef}{x},\textcolor{colorprop}{y})\) in a coordinate plane. The first coordinate \(\textcolor{colordef}{x}\) is placed on the horizontal axis, and the second coordinate \(\textcolor{colorprop}{y}\) on the vertical axis.
Definition Line Graph
A line graph of a relation is a graph where the points \((\textcolor{colordef}{x},\textcolor{colorprop}{y})\) are connected by straight line segments, usually from left to right.
Method Plotting a Line Graph from a Table
In a coordinate plane:
- we plot each point \((\textcolor{colordef}{x},\textcolor{colorprop}{y})\) from the table,
- we connect the points in order with straight line segments.
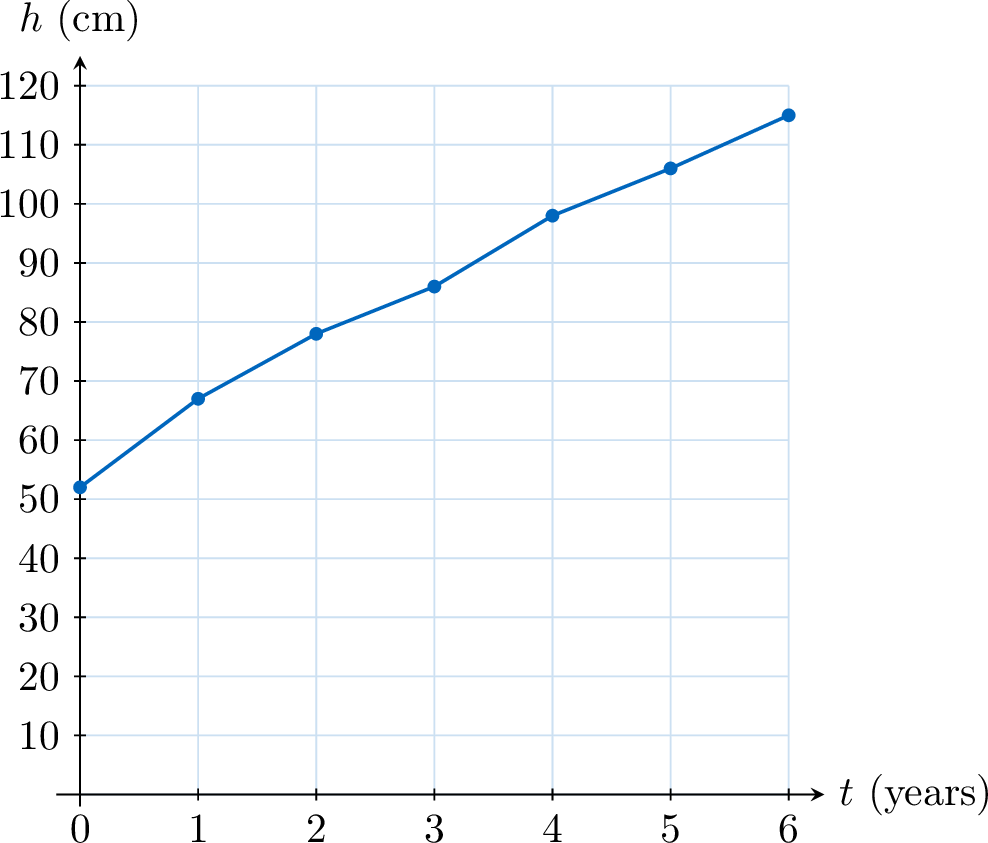
Example
Plot the line graph of Hugo's height as a function of age, using the data below:
| \(\textcolor{colordef}{t\text{ (years)}}\) | \(0\) | \(1\) | \(2\) | \(3\) | \(4\) | \(5\) | \(6\) |
| \(\textcolor{colorprop}{h\text{ (cm)}}\) | \(52\) | \(67\) | \(78\) | \(86\) | \(98\) | \(106\) | \(115\) |
- First, plot the points \((0,52)\), \((1,67)\), \((2,78)\), \((3,86)\), \((4,98)\), \((5,106)\), \((6,115)\) in a coordinate plane.
- Then, connect the points in order with straight line segments to form the line graph.