Probability
Ever wondered if it will rain tomorrow or if you will win a game? That’s probability! It is a mathematical way to measure how likely an event is to happen.
Outcomes
Definition Outcome
An outcome is one possible result of a random experiment.
Definition All Possible Outcomes
All possible outcomes are the complete list of all the outcomes that can happen in a random experiment.
Example
What are all the possible outcomes when you flip a coin? 
All possible outcomes are Heads (H)= and Tails (T)=
 .
.
Example
What are all the possible outcomes when you roll a six-sided die?
All possible outcomes are 1= , 2=
, 2= , 3=
, 3= , 4=
, 4= , 5=
, 5= , and 6=
 .
.
Events
Once we know all the possible outcomes of an experiment (the sample space), we can focus on specific results we are interested in. These specific results, which can be one or more outcomes, are called events.
Definition Event
An event is a set of outcomes from the set of all possible outcomes.
Example
In the experiment of rolling a die, find the outcomes that correspond to rolling an even number.
The outcomes for “rolling an even number” are 2=, 4=, and 6=.
Using Words to Describe Probability
We use special words to describe the chance of an event happening. We can place these words on a line from least likely to most likely.
Definition Probability Line

- Impossible: It can’t happen.
Example: Riding a dinosaur. - Less likely: It probably won’t happen.
Example: Rolling a die and getting a 3. - Even chance: It has the same chance to happen or not to happen.
Example: Tossing a coin and getting heads. - More likely: It will probably happen.
Example: Drinking water at school today. - Certain: It will happen.
Example: The sun will rise tomorrow.
Using Numbers to Quantify Probability
When you flip a coin, there are two possible outcomes: heads or tails. The chance of getting heads is 1 out of 2. We can write this as a fraction: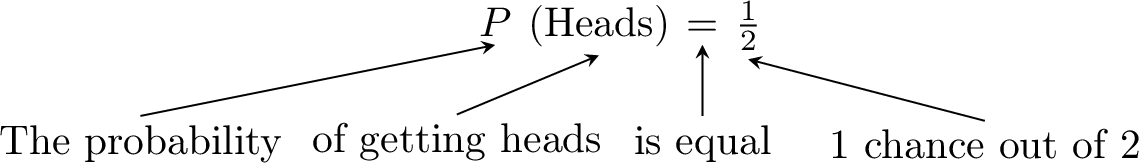
Definition Probability
The probability of an event, written \(P(\text{event})\), is a number from 0 (impossible) to 1 (certain).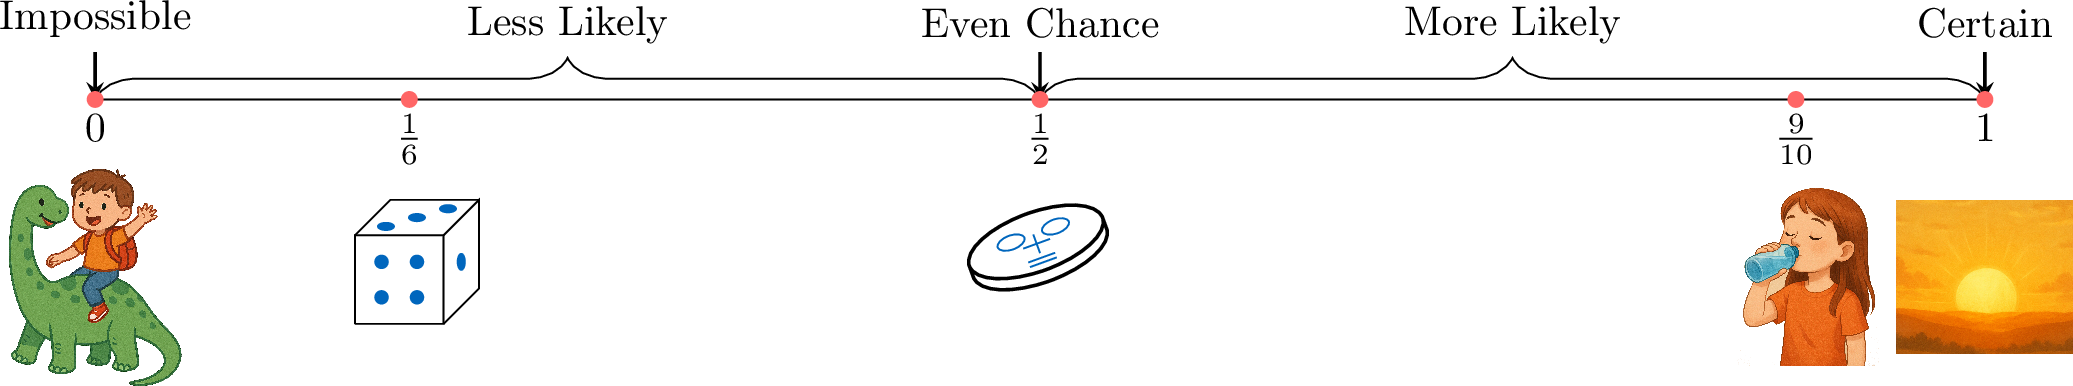
Calculating Probabilities
In many experiments, each outcome has the same chance of happening. For example, a fair coin is just as likely to land on heads as it is on tails. When we roll a fair die, each number from 1 to 6 has the same chance of appearing. We call these equally likely outcomes.
Definition Calculating Probability with Equally Likely Outcomes
When all outcomes of an experiment are equally likely, we can calculate the probability of an event using a simple formula:$$P(\text{event}) = \frac{\text{Number of favorable outcomes}}{\text{Total number of possible outcomes}}$$“Favorable outcomes” are the outcomes that match the event we are interested in.
Example
A fair six-sided die is rolled. Calculate the probability of rolling an even number.
- Total number of possible outcomes: A die has 6 faces, so there are 6 possible outcomes: \(\{1, 2, 3, 4, 5, 6\}\).
- Number of favorable outcomes: The event is “rolling an even number”. The outcomes that are even are \(\{2, 4, 6\}\). There are 3 favorable outcomes.
- Calculate the probability:$$\begin{aligned}P(\text{rolling an even number}) &= \frac{\text{Number of favorable outcomes}}{\text{Total number of possible outcomes}} \\ &= \frac{3}{6} \\ &= \frac{1}{2}\end{aligned}$$
Representing Probabilities as Numbers
Method Expressing Probabilities in Different Forms
We can write probabilities in three different ways: as fractions, decimals, or percentages. These three forms represent the same probability, but look different.
Example
The probability of an event is \(P(\text{event}) = \frac{1}{4}\). Represent this probability as a decimal and a percentage.
- Fraction: \( \frac{1}{4} \)
- Decimal: To convert a fraction to a decimal, divide the numerator by the denominator:$$ 1 \div 4 = 0.25 $$
- Percentage: To convert a decimal to a percentage, multiply by 100 and add the percent sign:$$ 0.25 = 0.25 \times 100\pourcent = 25\pourcent $$
Experimental Probability
So far, we have calculated theoretical probability. This is what we expect to happen based on logic. For example, we expect a coin to land on heads half the time, so we say \(P(\text{Heads}) = \frac{1}{2}\).
But what if we can’t use logic? What if the outcomes are not equally likely? In these cases, we need to do an experiment to estimate the probability.
But what if we can’t use logic? What if the outcomes are not equally likely? In these cases, we need to do an experiment to estimate the probability.
Isaac wants to find the probability that a cone he drops will land on its base. The possible outcomes are “base down” or “on its side”.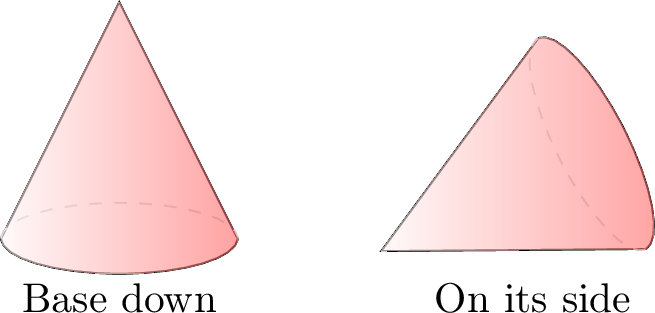
- Base down: 15 times.
- On its side: 35 times.
Definition Experimental Probability (Relative Frequency)
The experimental probability of an event is an estimate found by repeating an experiment many times. It is calculated with the formula:$$ \text{Experimental Probability} = \frac{\text{Number of times an event occurs}}{\text{Total number of trials}} $$The more trials we do, the better our estimate of the true probability will be.