Line Equations
Slopes
The slope (or gradient) of a line describes its direction and steepness. It is represented by a number that indicates how much the \(y\)-coordinate of a point on the line changes for a corresponding change in the \(x\)-coordinate.
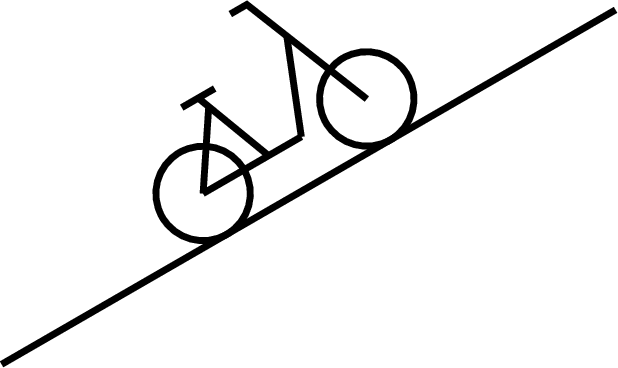
- A positive slope indicates that the line goes up (ascends) as you move to the right.
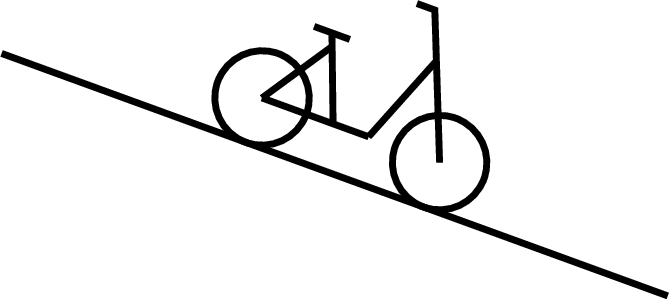
- A negative slope indicates that the line goes down (descends) as you move to the right.
- A slope of zero means the line is horizontal: there is no vertical change.

Definition Slope
The slope (or gradient) of a line is defined as the ratio of the change in the vertical direction (\(\Delta y\)) to the change in the horizontal direction (\(\Delta x\)):$$\text{slope} = \dfrac{\textcolor{colorprop}{\Delta y}}{\textcolor{colordef}{\Delta x}} = \dfrac{\textcolor{colorprop}{\text{vertical change}}}{\textcolor{colordef}{\text{horizontal change}}}$$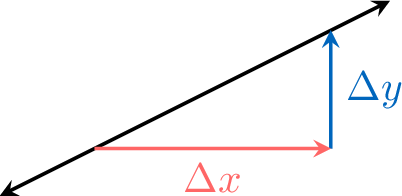
Example
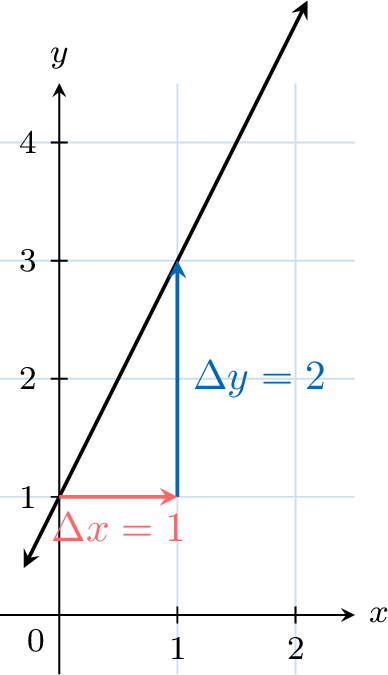
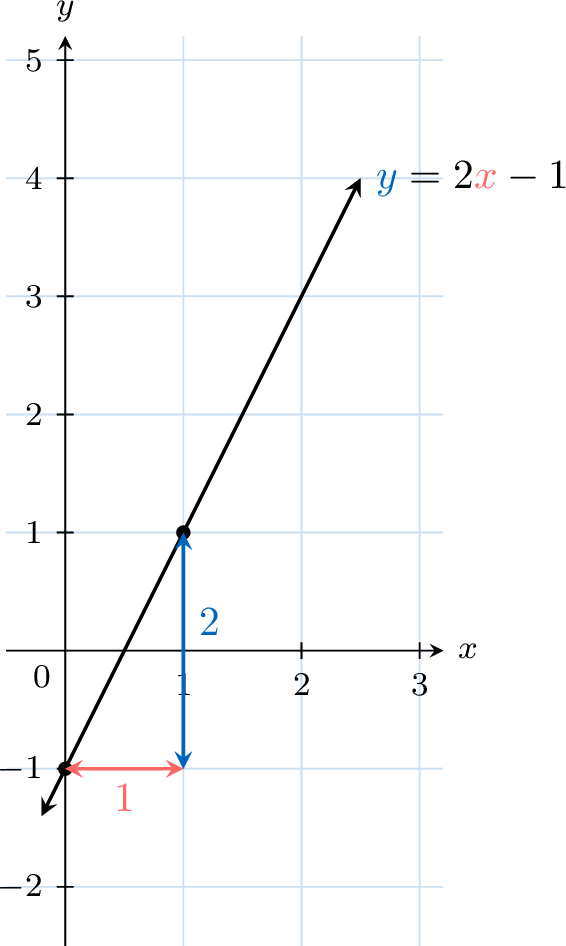
- $$\begin{aligned}[t]\text{slope} &= \frac{\textcolor{colorprop}{\Delta y}}{\textcolor{colordef}{\Delta x}}\\ &= \frac{\textcolor{colorprop}{2}}{\textcolor{colordef}{1}}\\ &= 2\end{aligned}$$
Slope Formula
Proposition Slope Formula
The slope of a line through \(A\left(\textcolor{colordef}{x_A}, \textcolor{colorprop}{y_A}\right)\) and \(B\left(\textcolor{colordef}{x_B}, \textcolor{colorprop}{y_B}\right)\) is$$\text{slope} = \frac{\textcolor{colorprop}{y_B}-\textcolor{colorprop}{y_A}}{\textcolor{colordef}{x_B}-\textcolor{colordef}{x_A}}$$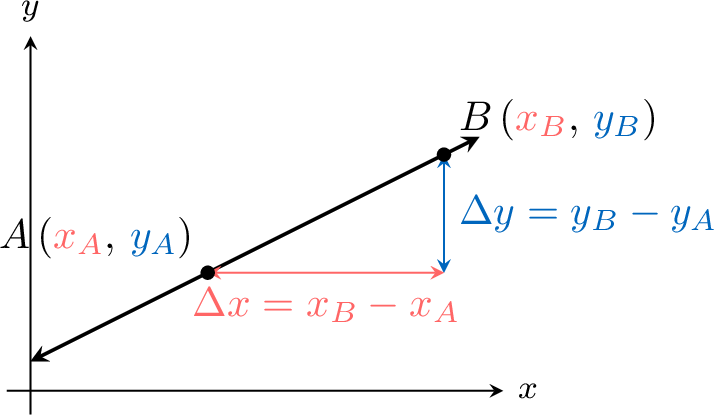
Example
Find the slope of the line \(\Line{AB}\) for \(A\left(\textcolor{colordef}{1}, \textcolor{colorprop}{2}\right)\) and \(B\left(\textcolor{colordef}{5}, \textcolor{colorprop}{4}\right)\).
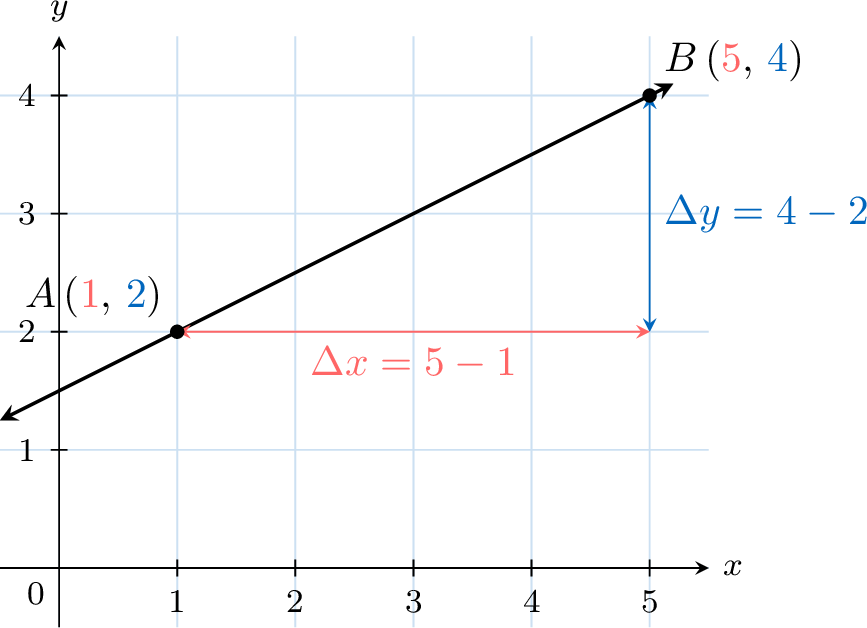
- $$\begin{aligned}[t]\text{slope of }\Line{AB} &= \frac{\textcolor{colorprop}{y_B}-\textcolor{colorprop}{y_A}}{\textcolor{colordef}{x_B}-\textcolor{colordef}{x_A}} \\ &= \frac{\textcolor{colorprop}{4}-\textcolor{colorprop}{2}}{\textcolor{colordef}{5}-\textcolor{colordef}{1}} \\ &= \frac{\textcolor{colorprop}{2}}{\textcolor{colordef}{4}} \\ &= \frac{\textcolor{colorprop}{1}}{\textcolor{colordef}{2}}\end{aligned}$$
\(y\)-Intercept
Definition \(y\)-Intercept
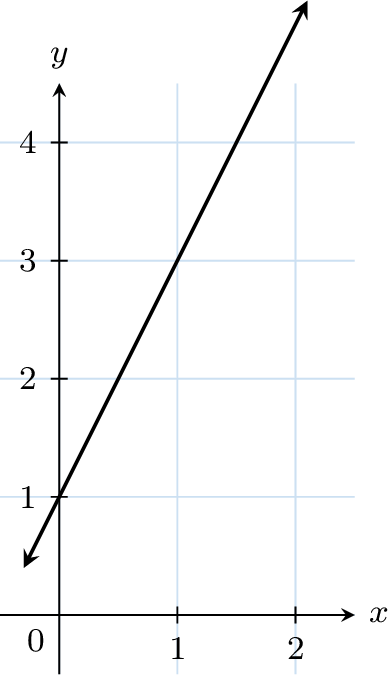
The \(y\)-intercept is the value of \(y\) where the graph crosses the \(y\)-axis (when \(x=0\)).
Example
Find the \(y\)-intercept.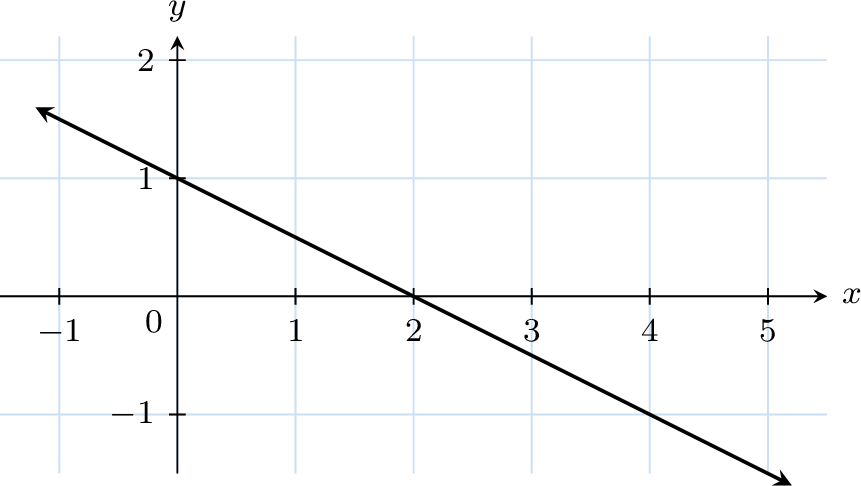
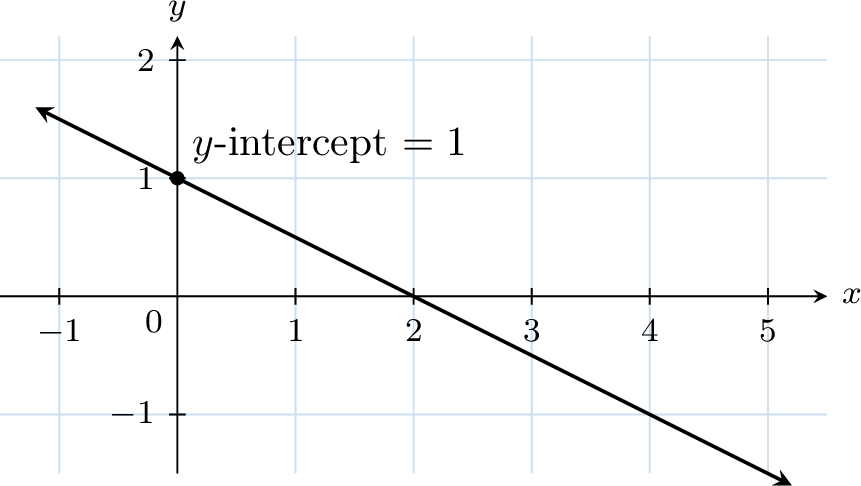
- The \(y\)-intercept is \(1\) because the graph crosses the \(y\)-axis at the point \((0,1)\).
Line Equations
Consider the equation \(\textcolor{colorprop}{y}=2\textcolor{colordef}{x}-1\), which describes the relationship between two variables \(\textcolor{colordef}{x}\) and \(\textcolor{colorprop}{y}\).
For any given value of \(\textcolor{colordef}{x}\), we can use the equation to find the corresponding value of \(\textcolor{colorprop}{y}\). These values give coordinates \((\textcolor{colordef}{x}, \textcolor{colorprop}{y})\) of points on the graph.
In fact, there are infinitely many points that satisfy \(\textcolor{colorprop}{y}=2 \textcolor{colordef}{x}-1\), forming a continuous line extending indefinitely in both directions (indicated with arrowheads).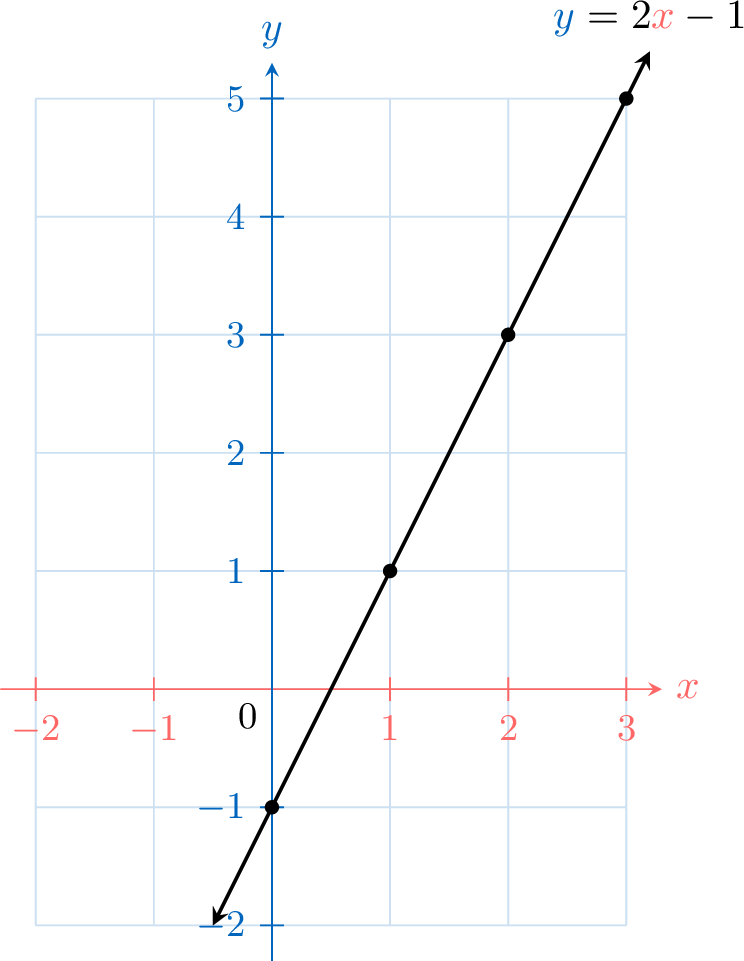
For any given value of \(\textcolor{colordef}{x}\), we can use the equation to find the corresponding value of \(\textcolor{colorprop}{y}\). These values give coordinates \((\textcolor{colordef}{x}, \textcolor{colorprop}{y})\) of points on the graph.
- For \(\textcolor{colordef}{x} = \textcolor{colordef}{1}\):$$\begin{aligned}[t]\textcolor{colorprop}{y} &= 2\times \textcolor{colordef}{1} - 1 \\ &= \textcolor{colorprop}{1}\end{aligned}$$
- For \(\textcolor{colordef}{x} = \textcolor{colordef}{2}\):$$\begin{aligned}[t]\textcolor{colorprop}{y} &= 2\times \textcolor{colordef}{2} - 1 \\ &= \textcolor{colorprop}{3}\end{aligned}$$
| \(\textcolor{colordef}{x}\) | \(\textcolor{colordef}{0}\) | \(\textcolor{colordef}{1}\) | \(\textcolor{colordef}{2}\) | \(\textcolor{colordef}{3}\) |
| \(\textcolor{colorprop}{y}\) | \(\textcolor{colorprop}{-1}\) | \(\textcolor{colorprop}{1}\) | \(\textcolor{colorprop}{3}\) | \(\textcolor{colorprop}{5}\) |
In fact, there are infinitely many points that satisfy \(\textcolor{colorprop}{y}=2 \textcolor{colordef}{x}-1\), forming a continuous line extending indefinitely in both directions (indicated with arrowheads).
Definition Equation of a line
The equation of a line can be written as:$$y = mx + c$$where \(m\) is the slope and \(c\) is the \(y\)-intercept.
Example
Graphing Line Equations
Method Graphing a Line Using Two Points
To graph a line given by \(y = mx + c\):
- Find the first point \((x_1, y_1)\):
- Choose any value for \(x_1\).
- Substitute \(x_1\) into the equation to calculate \(y_1\).
- Find a second point \((x_2, y_2)\):
- Choose a different value for \(x_2\).
- Substitute \(x_2\) into the equation to calculate \(y_2\).
- Draw the line:
- Plot both points on a graph.
- Use a ruler to draw a straight line passing through both points.
Example
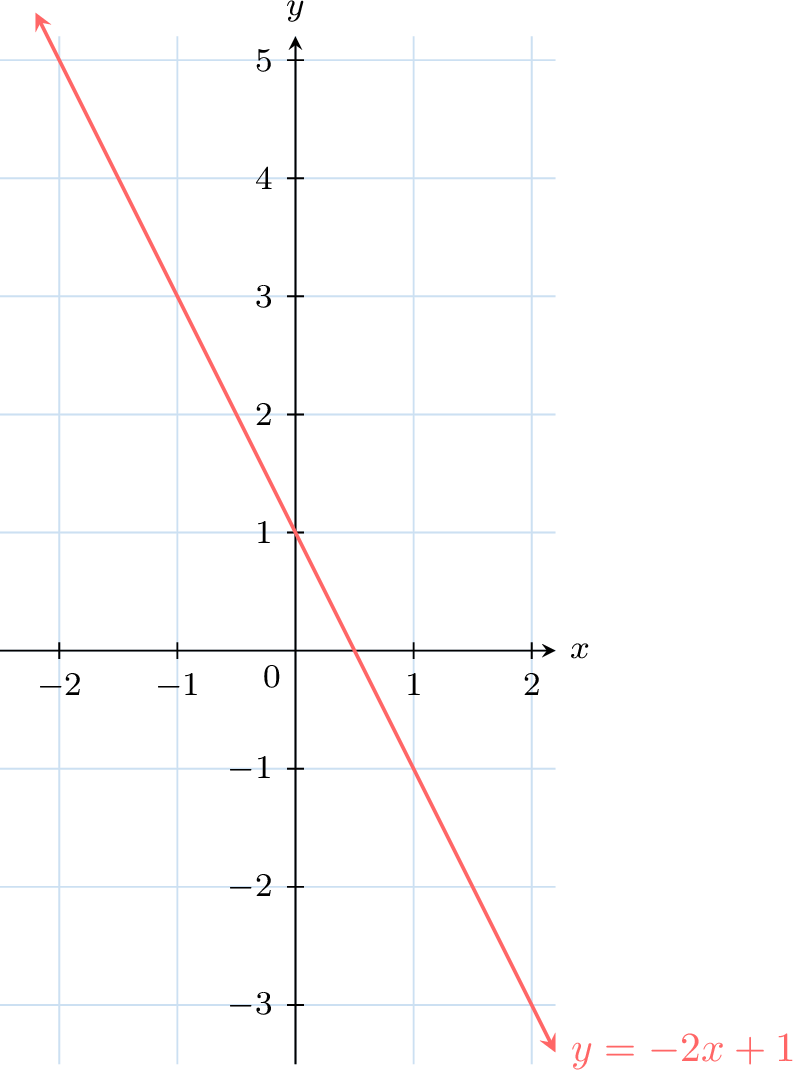
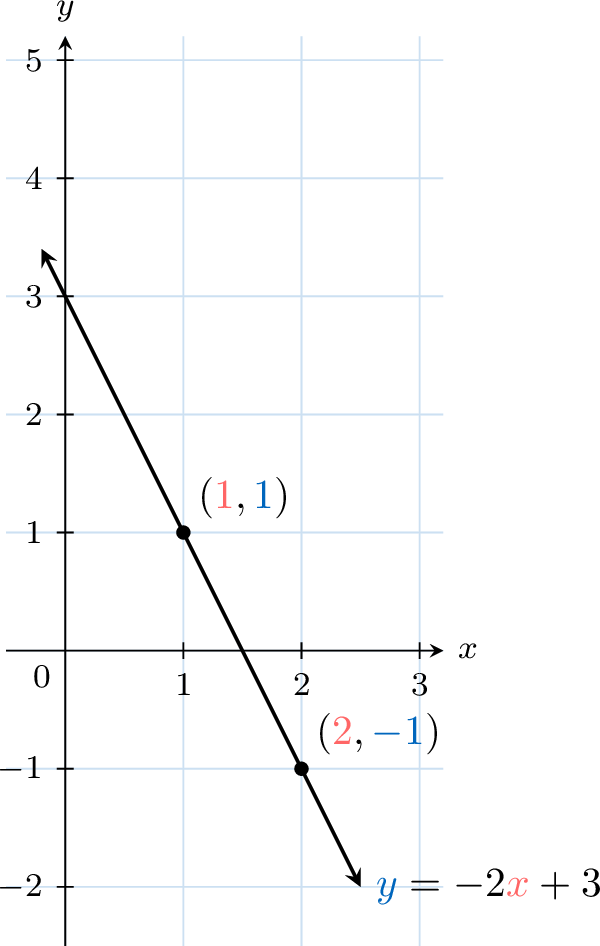
Graph the line \(y = -2x + 3\).
- For \(\textcolor{colordef}{x} = \textcolor{colordef}{1}\),$$\begin{aligned}[t]\textcolor{colorprop}{y} &= -2 \times \textcolor{colordef}{1} + 3 \\ &= \textcolor{colorprop}{1}\end{aligned}$$
- For \(\textcolor{colordef}{x} = \textcolor{colordef}{2}\),$$\begin{aligned}[t]\textcolor{colorprop}{y} &= -2 \times \textcolor{colordef}{2} + 3 \\ &= \textcolor{colorprop}{-1}\end{aligned}$$
- So, the points \((\textcolor{colordef}{1}, \textcolor{colorprop}{1})\) and \((\textcolor{colordef}{2}, \textcolor{colorprop}{-1})\) are on the graph.
Method Graphing a Line Using the \(y\)-Intercept and Slope
To graph a line \(y = mx + c\):
- Plot the \(y\)-intercept:
- Mark the point \((0, c)\) on the graph.
- Use the slope \(m\) to find a second point:
- From \((0, c)\), move horizontally by \(\Delta x\).
- Then move vertically by \(\Delta y = m \cdot \Delta x\).
- Mark the second point.
- Draw the line:
- Draw a straight line passing through both points.
Example
Graph the line \(y = 2x - 1\).
- The \(y\)-intercept is \(-1\), so plot the point \((0, -1)\).
- The slope is \(2\): from \((0, -1)\), move \(1\) unit right (\(\Delta x = 1\)), then \(2\) units up (\(\Delta y = 2\)), to reach \((1, 1)\).
- Draw the line through these two points.