Bivariate Statistics
Bivariate analysis focuses on how these two variables interact. By examining pairs of values, we can investigate patterns, such as whether an increase in \(x\) corresponds to a change in \(y\), and quantify the nature and strength of this relationship using tools like scatter plots, correlation, and regression. This approach is foundational in statistics for understanding dependencies and making predictions based on observed data.
Bivariate Variables
Definition Bivariate Variable
A bivariate variable refers to a pair of numerical variables that are observed and analyzed together to explore their relationship. These variables are typically denoted as \(x\) and \(y\), where \(x\) is the independent variable (often the predictor or input) and \(y\) is the dependent variable (often the response or outcome).
Example
Consider the data from a class of students:
| Hours Studied (\(x\)) | 5 | 1 0 | 8 | 15 |
| Exam Score (\(y\)) | 50 | 85 | 75 | 95 |
Scatter Plots
To visualize relationships between two numerical variables, we use scatter plots.
Definition Scatter Plot
A scatter plot displays data points as Cartesian coordinates \((x, y)\) on a graph.
Example
A teacher recorded the number of hours students studied and their corresponding exam scores. The data is shown below, where "Hours Studied" represents the time spent preparing (in hours), and "Exam Score" represents the score achieved (out of 100):
| Hours Studied (\(x\)) | 5 | 10 | 8 | 15 |
| Exam Score (\(y\)) | 50 | 85 | 75 | 95 |
To construct the scatter plot, plot each pair of data points with "Hours Studied" on the x-axis and "Exam Score" on the y-axis. The resulting scatter plot is shown below: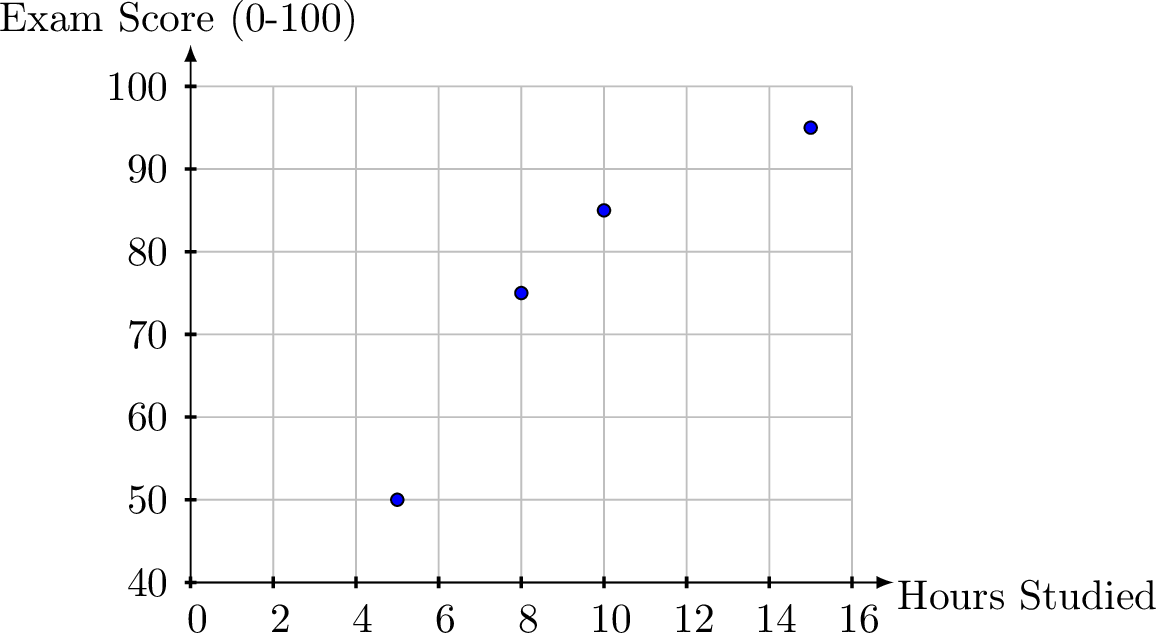
Correlation
Definition Correlation
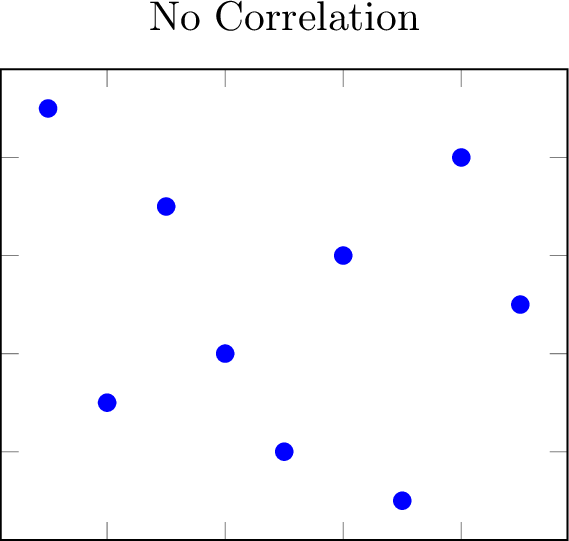
Correlation describes the relationship between two variables.
Example
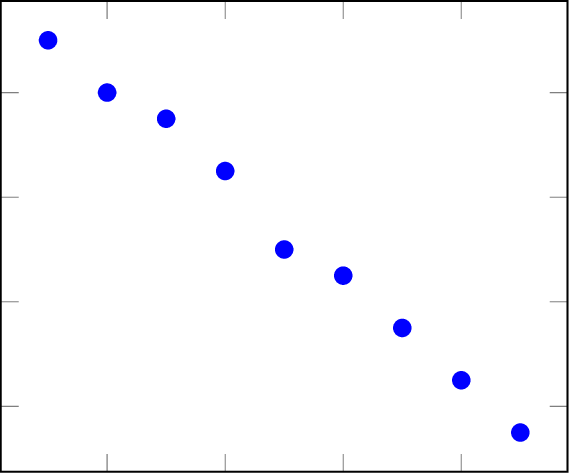
A teacher studies the relationship between hours studied and exam scores, collecting data from students. The scatter plot below shows the results, where the x-axis represents "Hours Studied" (in hours) and the y-axis represents "Exam Score" (out of 100):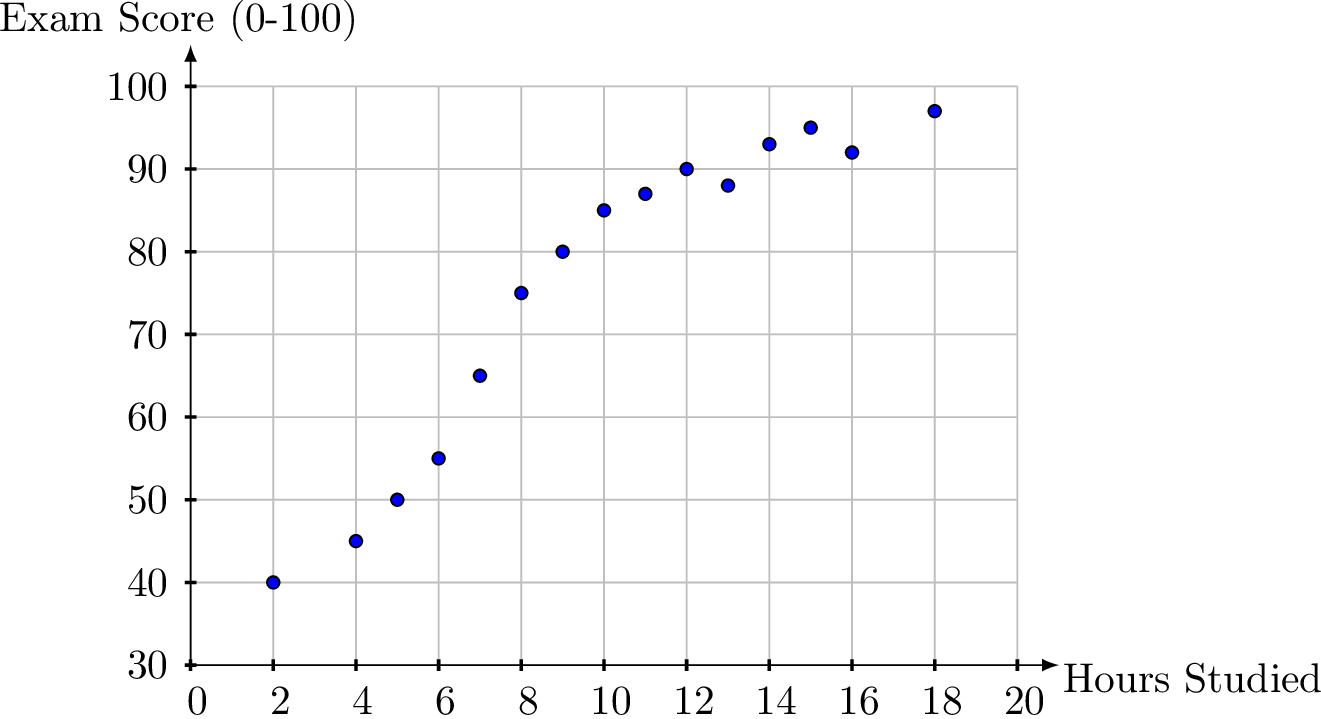
The points generally trend upward from left to right: as the number of hours studied increases (e.g., from 2 to 18), the exam scores tend to increase (e.g., from 40 to 97). This suggests a positive correlation between hours studied and exam scores, meaning that more study time is associated with higher scores.
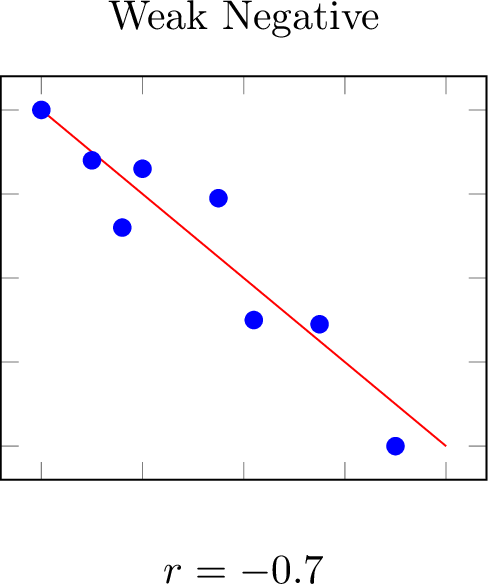
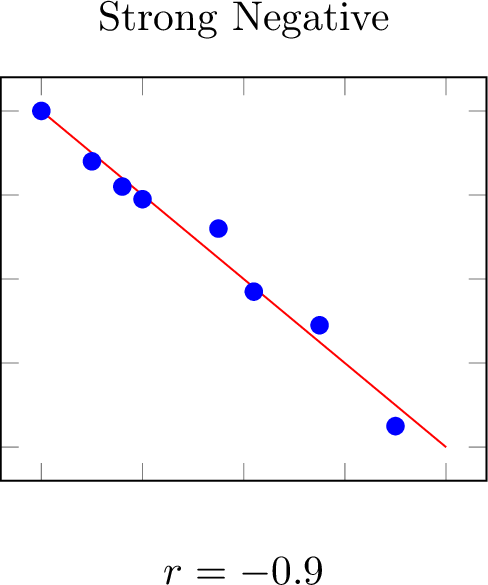
Definition Positive and Negative Correlation
- A positive correlation occurs when both variables increase together.
- A negative correlation occurs when one variable increases as the other decreases.
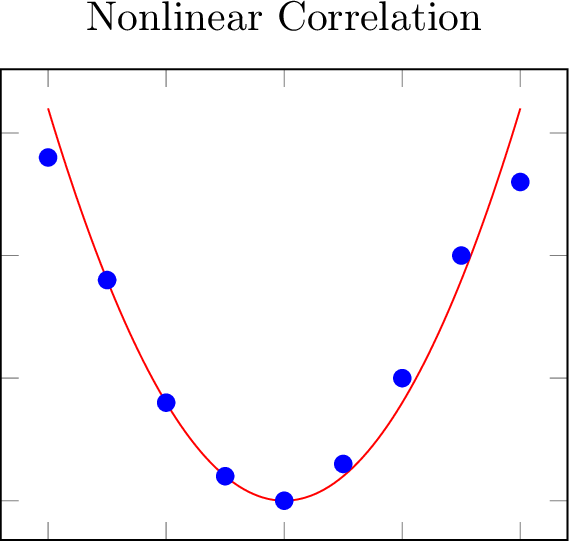
Definition Linear Correlation
A correlation is linear if the data points roughly align along a straight line.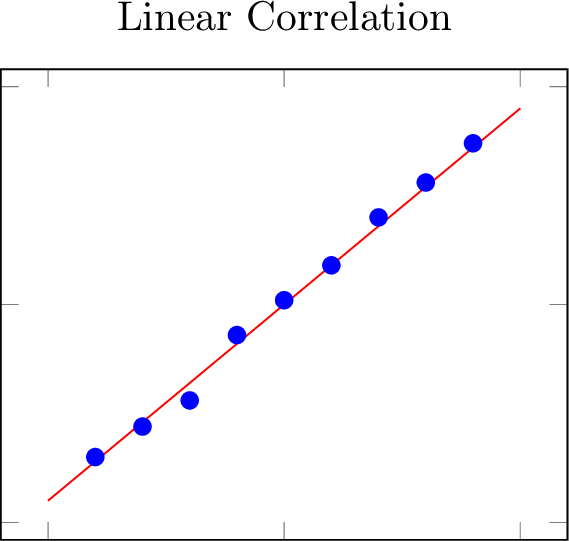
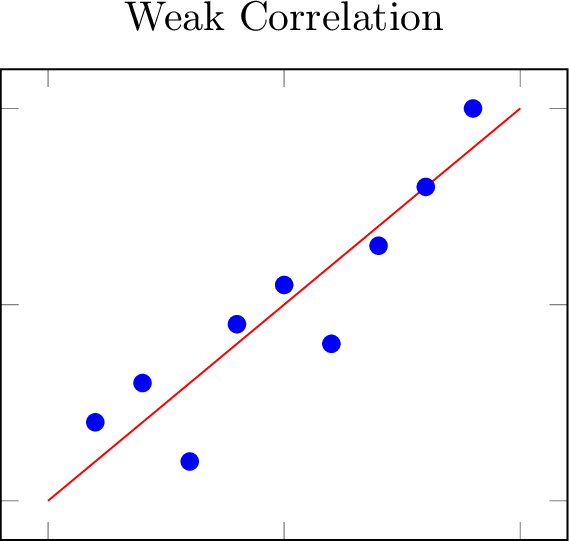
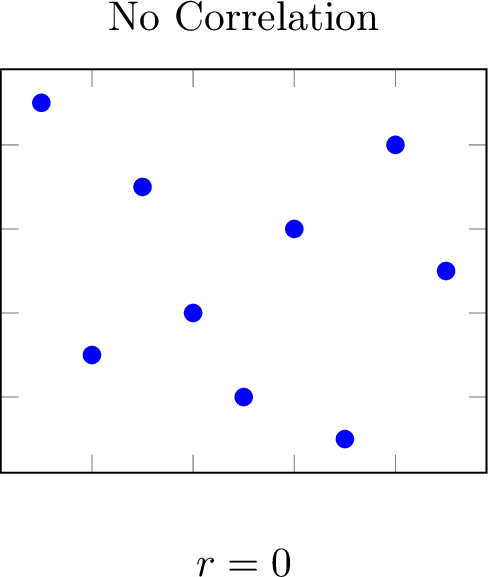
Definition Strength
The strength of a correlation reflects how tightly data points follow a trend.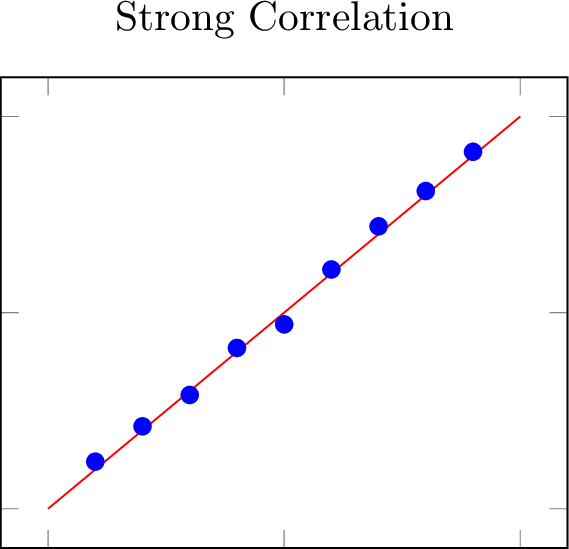
Definition Outlier
An outlier is a data point that deviates significantly from the overall trend.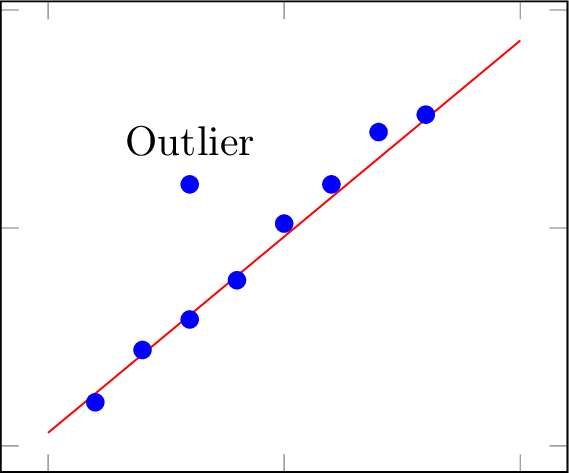
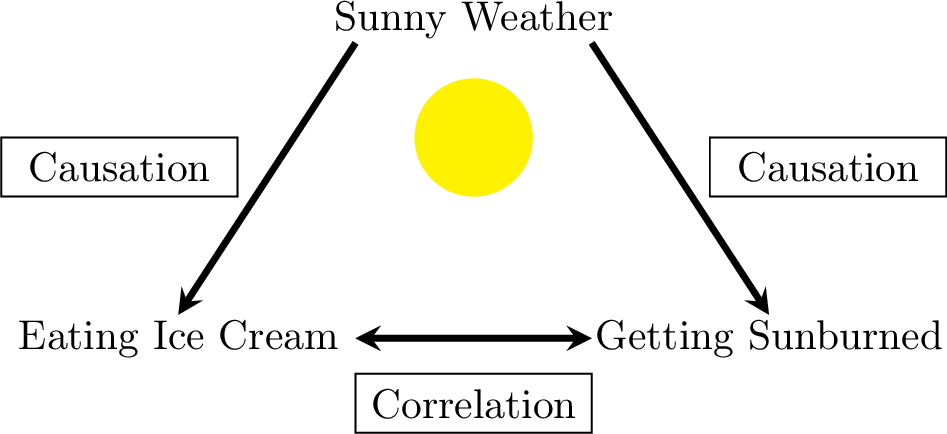
Causality
Definition Causation
Causation indicates a direct cause-and-effect relationship between variables.
Remark
Correlation shows a relationship between variables, but it doesn’t imply one causes the other. Causation requires a controlled experiment, such as comparing a placebo group to a medicated group in medical research to determine if treatment causes different outcomes.
Example
Label the relationships as “correlation” or “causation”: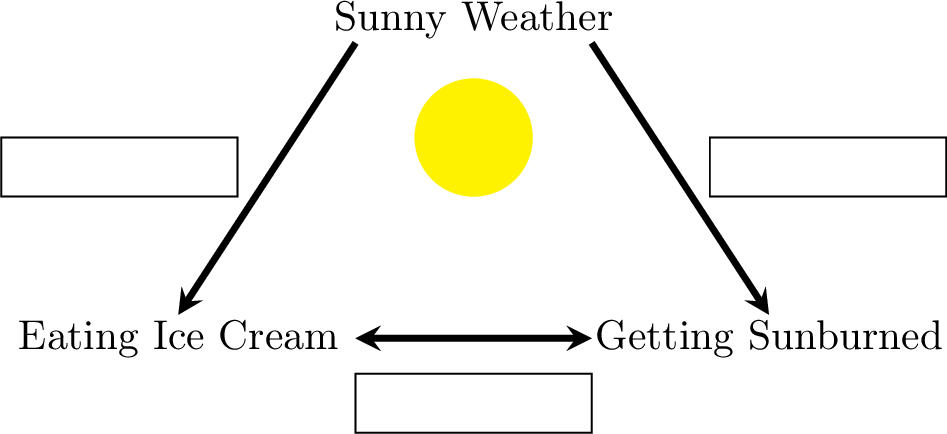
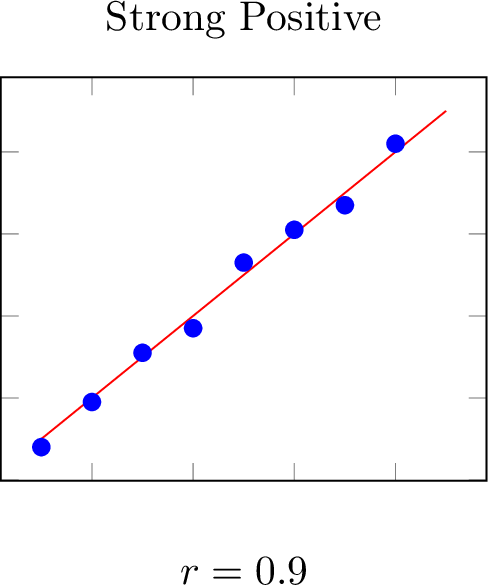
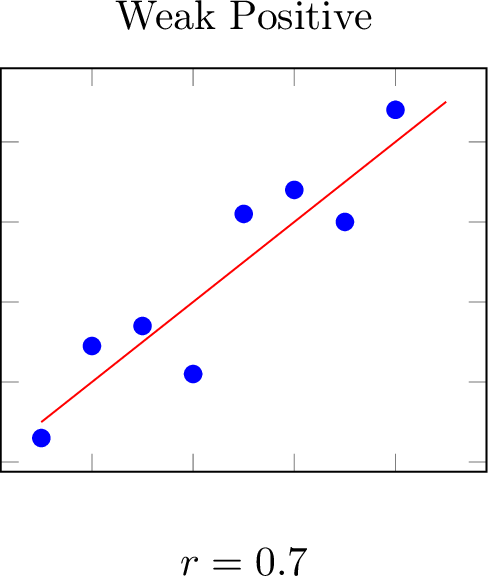
Measuring Correlation
Scatter plots allow us to visually assess correlation strength as strong, moderate, or weak, but this is subjective. The correlation coefficient provides a precise, numerical measure of linear relationship strength.
Definition Correlation Coefficient
The correlation coefficient, ranging from -1 to 1, quantifies the direction and strength of a linear relationship between two variables.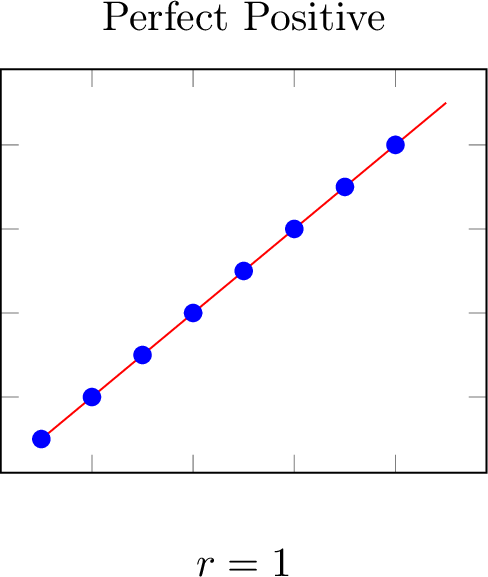

Definition Coefficient of Determination
The coefficient of determination, \(r^2\), ranges from 0 to 1 and measures the strength of a linear relationship, derived as the square of the correlation coefficient, eliminating direction.
Line Fitting
For strong linear correlations, a line of best fit models the relationship. It’s typically worthwhile if \(r^2 \geq 0.7\).
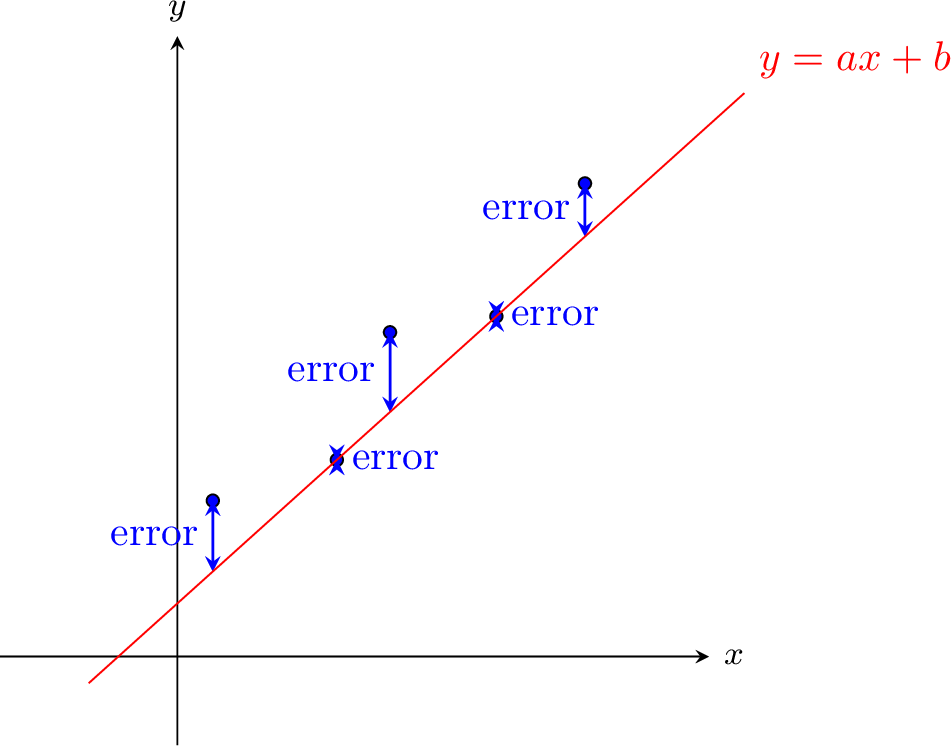
Definition Least Squares Regression Line
The least squares regression line, \(y = ax + b\), also called the line of best fit or trend line, minimizes the squared differences between observed points and the line.