Functions and Graphs of Polynomials
In the previous chapter, we explored the algebraic properties of polynomials. We now turn our attention to the visual representation of polynomial functions. By understanding the connection between a polynomial's algebraic form (its degree, factors, and roots) and the shape of its graph, we can sketch complex curves and solve inequalities.
General Principles of Polynomial Graphs
When we consider the behaviour of a polynomial function for very large values of \(|x|\) (i.e., as \(x \to \infty\) or \(x \to -\infty\)), the term with the highest power of \(x\) grows much faster than all the other terms combined. This means the leading term dictates the end behaviour of the graph.
Consider the cubic polynomial \(P(x) = 2x^3 + 5x^2 - 10x + 1\). We can factor out the leading term, \(2x^3\), to see what happens for large \(|x|\):$$ P(x) = 2x^3 \left( 1 + \frac{5x^2}{2x^3} - \frac{10x}{2x^3} + \frac{1}{2x^3} \right) = 2x^3 \left( 1 + \frac{5}{2x} - \frac{5}{x^2} + \frac{1}{2x^3} \right) $$As \(x\) becomes very large (positive or negative), the fractions inside the parentheses, such as \(\frac{5}{2x}\), \(\frac{5}{x^2}\), and \(\frac{1}{2x^3}\), all approach zero.$$ \text{As } |x| \to \infty, \quad \left( 1 + \frac{5}{2x} - \frac{5}{x^2} + \frac{1}{2x^3} \right) \to (1 + 0 - 0 + 0) = 1 $$Therefore, for very large values of \(|x|\), the function behaves like its leading term:$$ P(x) \approx 2x^3 $$This general principle allows us to predict the end behaviour of any polynomial.
Consider the cubic polynomial \(P(x) = 2x^3 + 5x^2 - 10x + 1\). We can factor out the leading term, \(2x^3\), to see what happens for large \(|x|\):$$ P(x) = 2x^3 \left( 1 + \frac{5x^2}{2x^3} - \frac{10x}{2x^3} + \frac{1}{2x^3} \right) = 2x^3 \left( 1 + \frac{5}{2x} - \frac{5}{x^2} + \frac{1}{2x^3} \right) $$As \(x\) becomes very large (positive or negative), the fractions inside the parentheses, such as \(\frac{5}{2x}\), \(\frac{5}{x^2}\), and \(\frac{1}{2x^3}\), all approach zero.$$ \text{As } |x| \to \infty, \quad \left( 1 + \frac{5}{2x} - \frac{5}{x^2} + \frac{1}{2x^3} \right) \to (1 + 0 - 0 + 0) = 1 $$Therefore, for very large values of \(|x|\), the function behaves like its leading term:$$ P(x) \approx 2x^3 $$This general principle allows us to predict the end behaviour of any polynomial.
Proposition End Behaviour of Polynomial Functions
The long-term behaviour of a polynomial graph, as \(x \to \infty\) and \(x \to -\infty\), is determined entirely by its leading term, \(a_nx^n\).
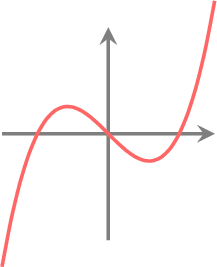
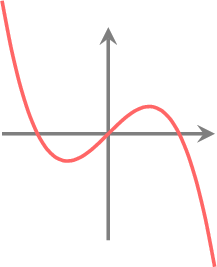
- Odd Degree (\(n=1, 3, 5, \dots\)): The graph goes in opposite directions.
- If \(a_n>0\): As \(x \to \infty, y \to \infty\). As \(x \to -\infty, y \to -\infty\). (Bottom-left to top-right)
- If \(a_n<0\): As \(x \to \infty, y \to -\infty\). As \(x \to -\infty, y \to \infty\). (Top-left to bottom-right)
- If \(a_n>0\): As \(x \to \infty, y \to \infty\). As \(x \to -\infty, y \to -\infty\). (Bottom-left to top-right)
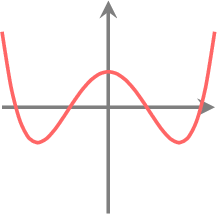
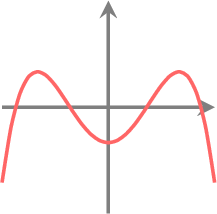
- Even Degree (\(n=2, 4, 6, \dots\)): The graph goes in the same direction at both ends.
- If \(a_n>0\): As \(x \to \infty, y \to \infty\). As \(x \to -\infty, y \to \infty\). (Opens upwards)
- If \(a_n<0\): As \(x \to \infty, y \to -\infty\). As \(x \to -\infty, y \to -\infty\). (Opens downwards)
- If \(a_n>0\): As \(x \to \infty, y \to \infty\). As \(x \to -\infty, y \to \infty\). (Opens upwards)
Proposition Multiplicity of Roots
The way a polynomial graph behaves at an x-intercept is determined by the multiplicity of the corresponding root (i.e., the power of its linear factor).
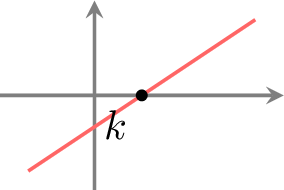
- Multiplicity 1: \((x-k)^1\). The graph cuts the x-axis at \(x=k\).
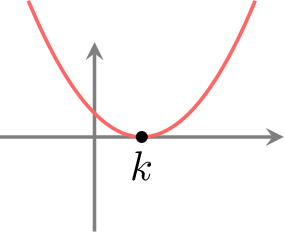
- Multiplicity 2: \((x-k)^2\). The graph touches the x-axis at \(x=k\) (tangent).
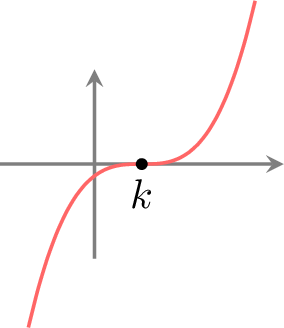
- Multiplicity 3: \((x-k)^3\). The graph has a point of inflection with horizontal tangent. on the x-axis at \(x=k\).
Graphing Cubic Functions
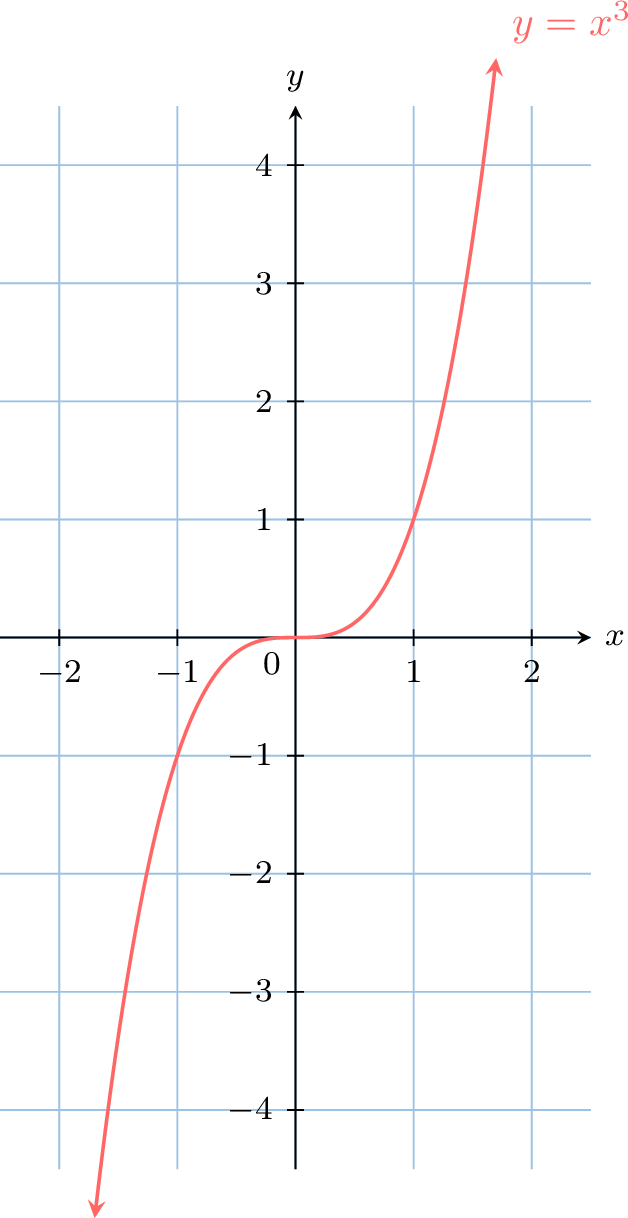
Proposition Parent Cubic Function \(y\equal x^3\)
- The graph has a point of horizontal inflection at the origin \((0,0)\).
- The graph has odd symmetry about the origin.
- End behaviour: As \(x \rightarrow \infty, y \rightarrow \infty\) and as \(x \rightarrow-\infty, y \rightarrow-\infty\).
Proposition Graphs of Cubic Polynomials from Factored Form
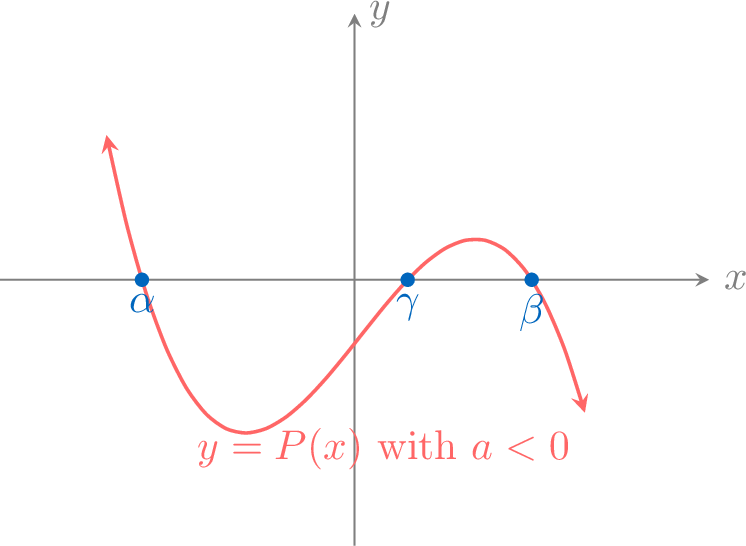
The overall shape and behavior at the x-intercepts of a cubic function \(P(x)\) depend on the sign of its leading coefficient, \(a\), and the multiplicity of its real roots.
- Three distinct real roots: \(P(x)=a(x-\alpha)(x-\beta)(x-\gamma)\)
The graph cuts the x-axis at three distinct points.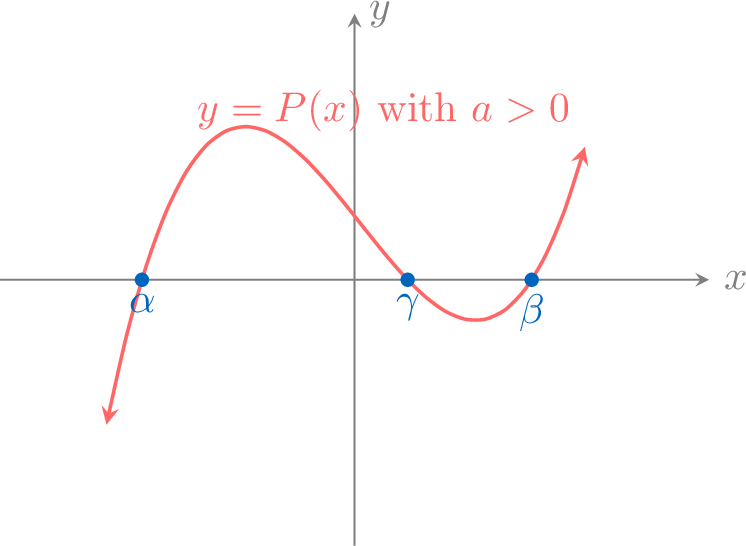
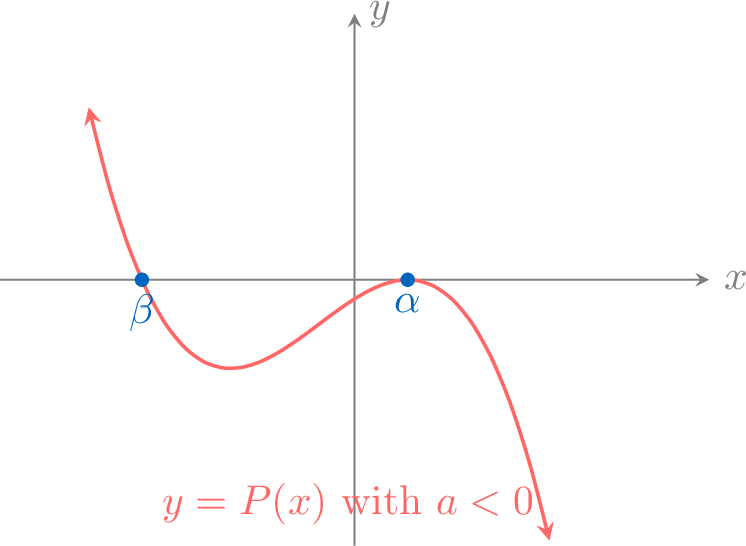
- One repeated and one distinct real root: \(P(x)=a(x-\alpha)^2(x-\beta)\)
The graph touches the x-axis at \(\alpha\) and cuts it at \(\beta\).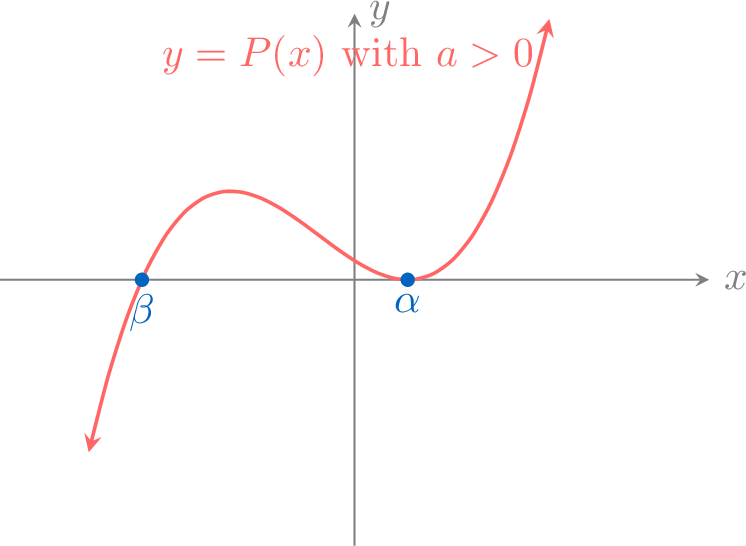
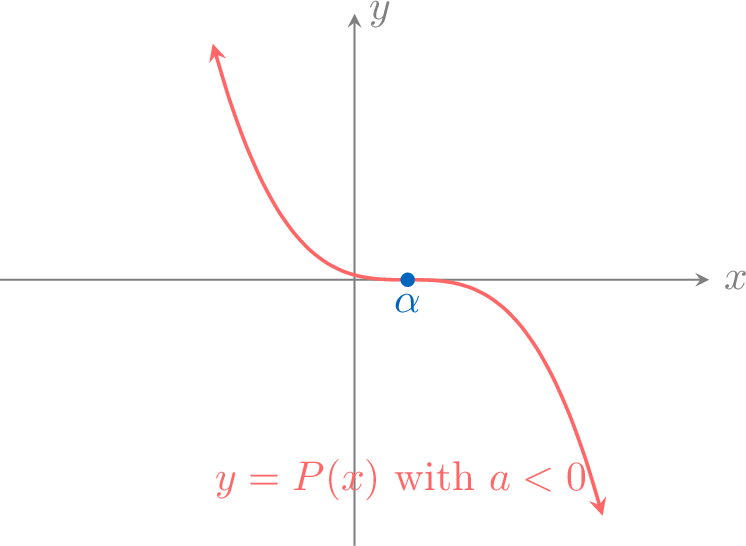
- One real root of multiplicity 3: \(P(x)=a(x-\alpha)^3\)
The graph has a point of horizontal inflection on the x-axis at \(\alpha\).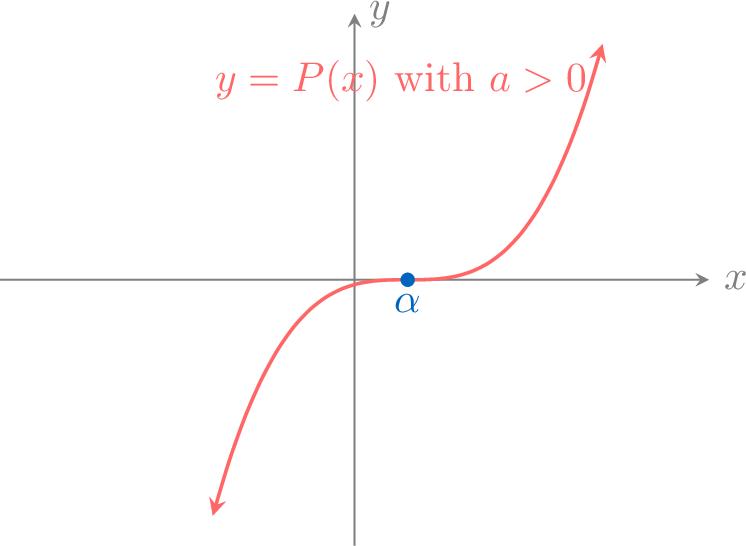
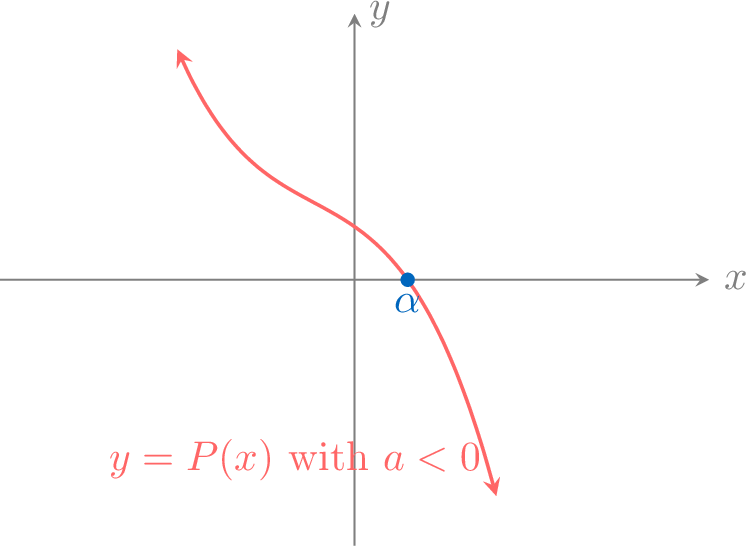
- One real root and two complex roots: \(P(x)=a(x-\alpha)(Ax^2+Bx+C)\) where \(B^2-4AC<0\)
The graph cuts the x-axis at only one point, \(\alpha\).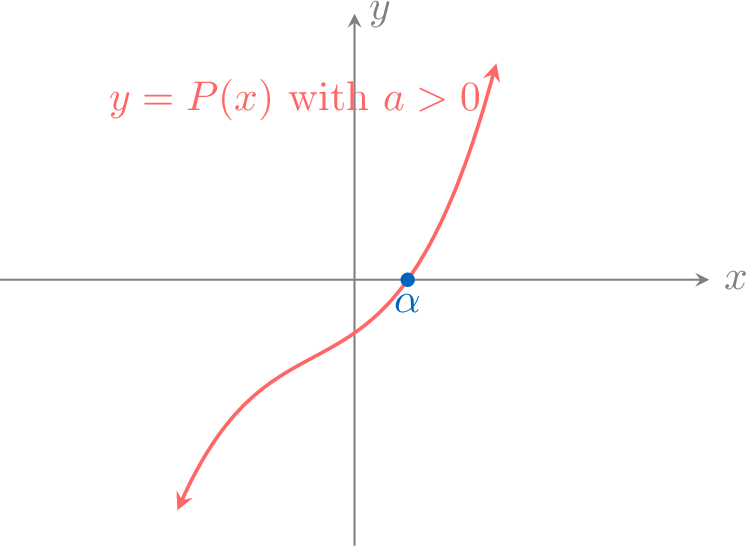
Example
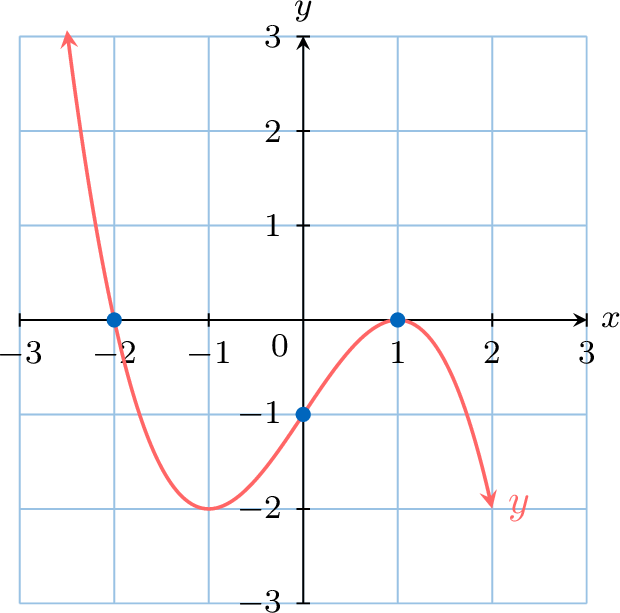
Sketch the graph of \(y = -\frac{1}{2}(x+2)(x-1)^2\).
- Roots: The roots are \(x=-2\) (multiplicity 1, so it cuts) and \(x=1\) (multiplicity 2, so it touches).
- y-intercept: When \(x=0\), \(y = -\frac{1}{2}(0+2)(0-1)^2 = -\frac{1}{2}(2)(1) = -1\).
- End Behaviour: The leading term would be \(-\frac{1}{2}x \cdot x^2 = -\frac{1}{2}x^3\). The degree is odd (3) and the leading coefficient is negative. So, as \(x \to \infty, y \to -\infty\) and as \(x \to -\infty, y \to \infty\).
- Sketch:
Graphing Quartic Functions
A quartic function is a polynomial of degree 4. The principles of end behaviour and multiplicity of roots extend directly to these higher-degree polynomials.
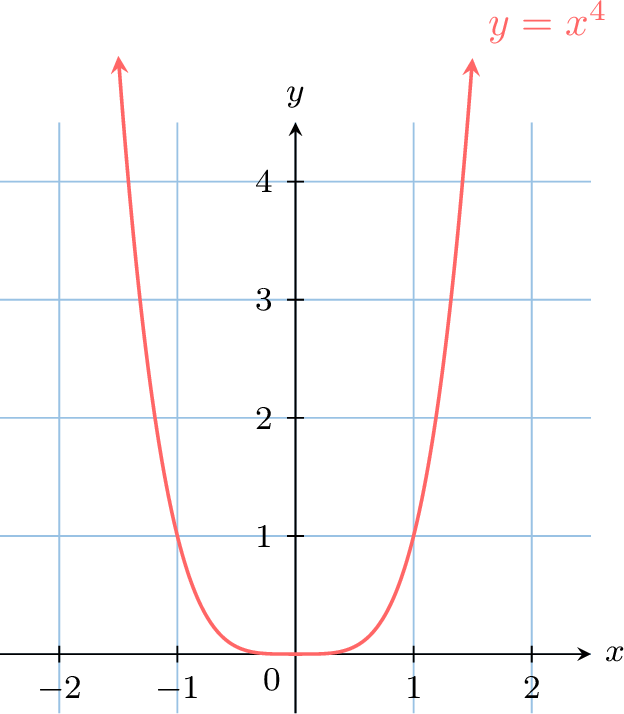
Proposition Parent Quartic Function \(y\equal x^4\)
- The graph is "flatter" near the origin than a parabola.
- The graph has even symmetry about the y-axis.
- End behaviour: As \(x \rightarrow \infty, y \rightarrow \infty\) and as \(x \rightarrow-\infty, y \rightarrow \infty\).
Proposition Graphs of Quartics from Factored Form
The behaviour of a quartic graph at its x-intercepts is determined by the multiplicity of its roots. For a positive leading coefficient (\(a>0\)):
- Four distinct real roots: \(P(x)=a(x-\alpha)(x-\beta)(x-\gamma)(x-\theta)\)
The graph cuts the x-axis at four distinct points.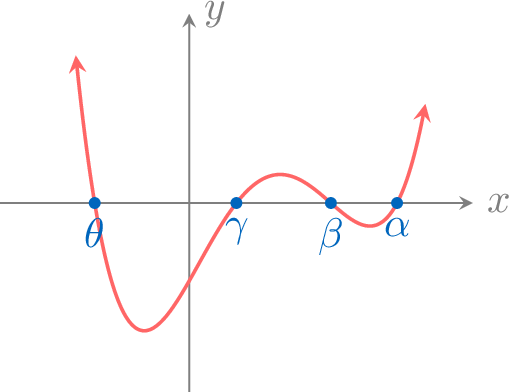
- One double root, two single roots: \(P(x)=a(x-\alpha)^2(x-\beta)(x-\gamma)\)
The graph touches at \(x=\alpha\) and cuts at \(x=\beta\) and \(x=\gamma\).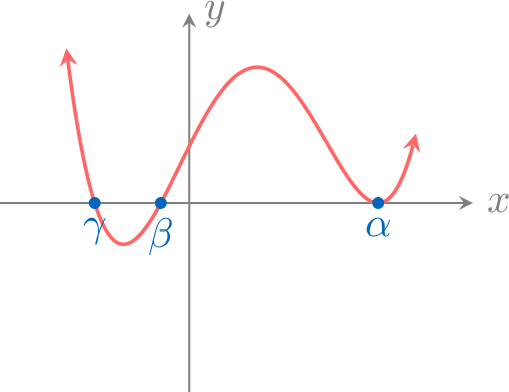
- Two double roots: \(P(x)=a(x-\alpha)^2(x-\beta)^2\)
The graph touches the x-axis at two distinct points.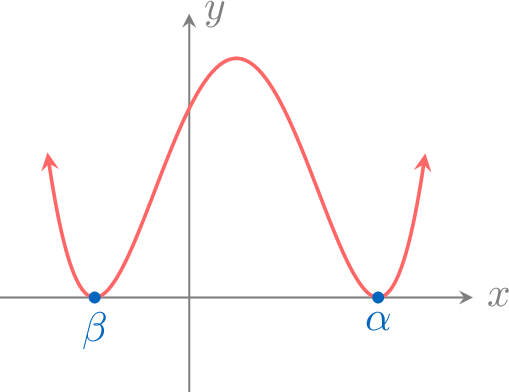
- One triple root: \(P(x)=a(x-\alpha)^3(x-\beta)\)
The graph has a point of inflection at \(x=\alpha\) and cuts at \(x=\beta\).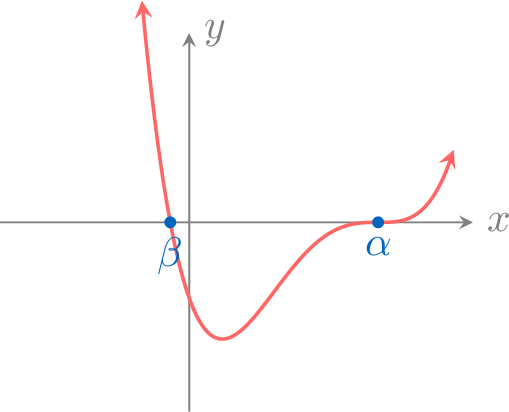
- Two real roots, two complex roots: \(P(x)=a(x-\alpha)(x-\beta)(x^2+c^2)\)
The graph cuts the x-axis at two points.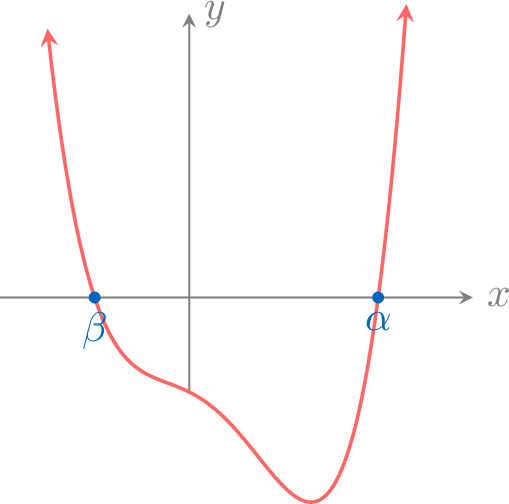
Example
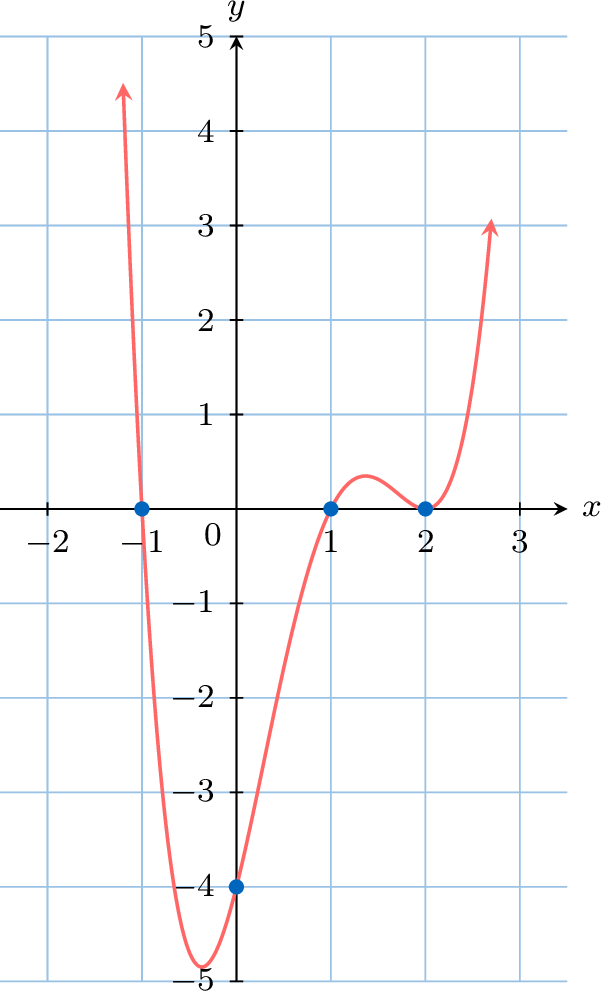
Sketch the graph of \(y = (x+1)(x-1)(x-2)^2\).
- Roots and Multiplicities: The roots are at \(x=-1\) (multiplicity 1, cuts the axis), \(x=1\) (multiplicity 1, cuts the axis), and \(x=2\) (multiplicity 2, touches the axis).
- y-intercept: We substitute \(x=0\): $$ y = (0+1)(0-1)(0-2)^2 = (1)(-1)(4) = -4 $$ The y-intercept is at \((0, -4)\).
- End Behaviour: The leading term is found by multiplying the leading terms of the factors: \(x \cdot x \cdot x^2 = x^4\). The degree is 4 (even) and the leading coefficient is positive (+1). Therefore, the graph opens upwards: as \(x \to \infty, y \to \infty\) and as \(x \to -\infty, y \to \infty\).
- Sketch: We draw a smooth curve that starts from the top-left, passes through the intercepts with the correct behaviour, and ends at the top-right.
Solving Polynomial Inequalities
Method Solving Polynomial Inequalities
To solve an inequality like \(P(x) > 0\) or \(P(x) \le 0\):
- Move all terms to one side to get the form \(P(x) \ge 0\).
- Find all the real roots of the polynomial \(P(x)\).
- Draw a sign diagram. Mark the roots on a number line.
- Test a value in each interval between the roots to determine if \(P(x)\) is positive or negative in that interval.
- Use the sign diagram to state the solution in interval notation.
Example
Solve the inequality \(x^3 - x^2 \ge 12x\).
- Rearrange: \(x^3 - x^2 - 12x \ge 0\).
- Find roots: Factorise the polynomial \(P(x) = x^3 - x^2 - 12x\). $$ P(x) = x(x^2 - x - 12) = x(x-4)(x+3) $$ The roots are \(x=-3, x=0, x=4\).
- Draw a Sign Diagram: We mark the roots on a number line and test values in the four resulting intervals. For example, test \(x=5\): \(5(1)(8) > 0\).

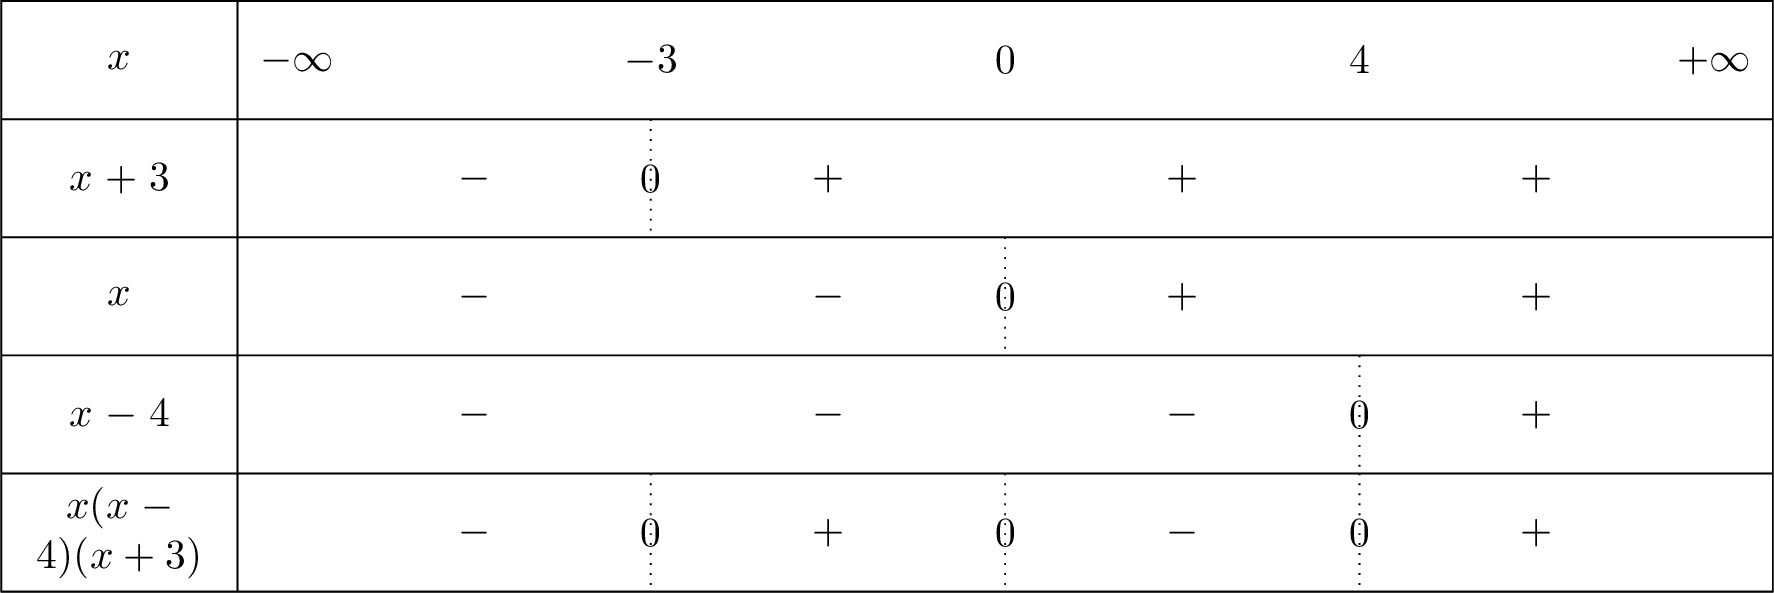
- State Solution: We are looking for where \(P(x) \ge 0\). According to the sign diagram, this occurs for \(x\) values between -3 and 0 (inclusive) and for values greater than or equal to 4. The solution is \(\boldsymbol{[-3, 0] \cup [4, \infty)}\).