Logarithm Functions
In the previous chapter, we defined the logarithm as the inverse operation of exponentiation. Just as these two operations are algebraically linked, their graphs are also deeply connected.
This chapter is dedicated to visualizing logarithmic functions. We will see how the graph of a logarithmic function, such as \(y = \log_a(x)\), is a reflection of its corresponding exponential function, \(y = a^x\), across the line \(y=x\).
We will explore the key features that define these graphs, including their domain and range, their vertical asymptotes, and their intercepts. We will begin with the most common logarithmic function, the natural logarithm (\(y=\ln x\)), and then extend our analysis to logarithms with any base, \(a\).
Natural Logarithm Function
Definition Natural Logarithm Function
The natural logarithm function is \(x\mapsto \ln x\).
- Domain: \((0, +\infty)\)
- Range: \((-\infty, +\infty)\)
Proposition Graph of the Natural Logarithm Function
The graph of \(\textcolor{colordef}{y = \ln x}\) is the reflection of \(\textcolor{colorprop}{y = e^x}\) over the line \(\textcolor{olive}{y = x}\). It has a vertical asymptote at \(x=0\), passes through (1,0), and is increasing.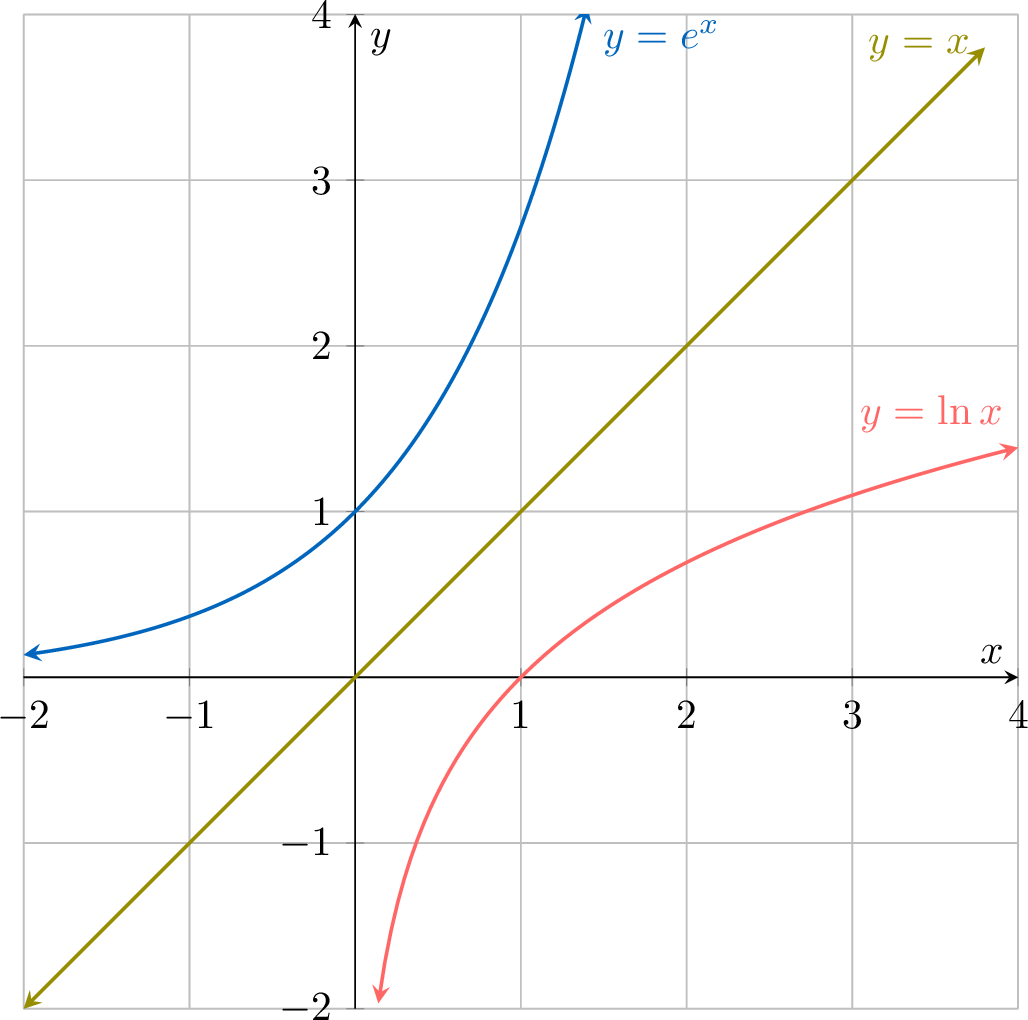
Logarithmic Function in Base \(a\)
Definition Logarithmic Function in Base a
The logarithmic function in base a is \(f(x) = \log_a(x)\), where \(a\) is a positive constant and \(a \neq 1\).
- Domain: \((0, +\infty)\)
- Range: \((-\infty, +\infty)\)
Proposition Graph of the Logarithmic Function in Base a
The graph of \(\textcolor{colordef}{y = \log_a(x)}\) is the reflection of \(\textcolor{colorprop}{y = a^x}\) over the line \(\textcolor{olive}{y = x}\). It has a vertical asymptote at \(x=0\) and passes through the point \((1,0)\).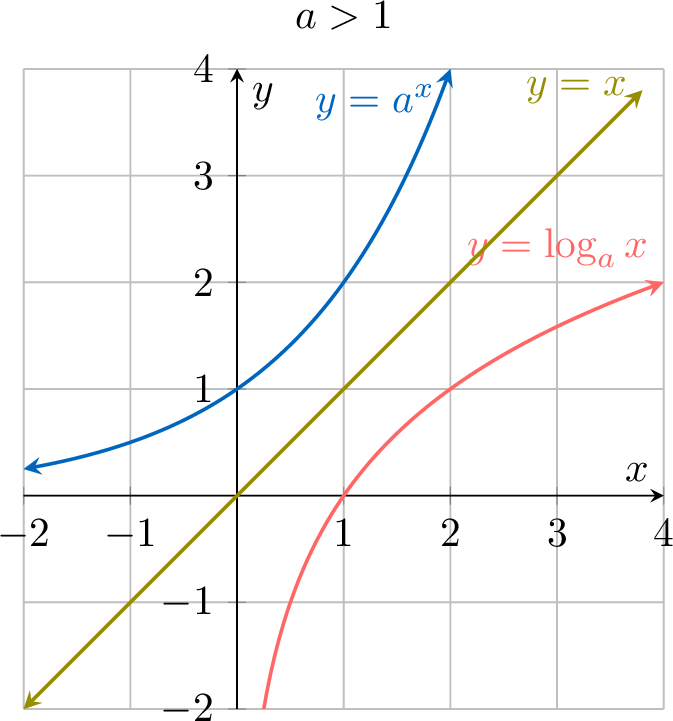 \(\quad\)
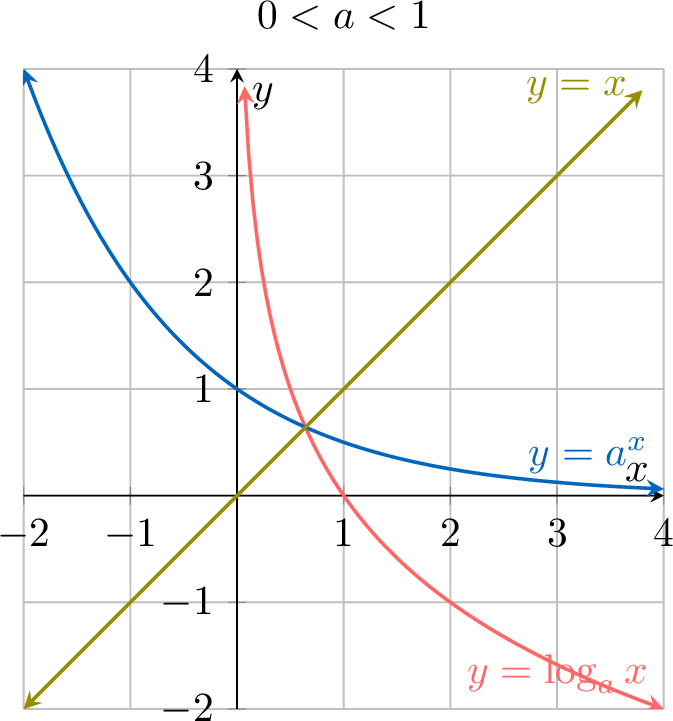
- If \(a > 1\), the function is increasing.
- If \(0 < a < 1\), the function is decreasing.
\(\quad\)