Functions
Definition
Definition Function
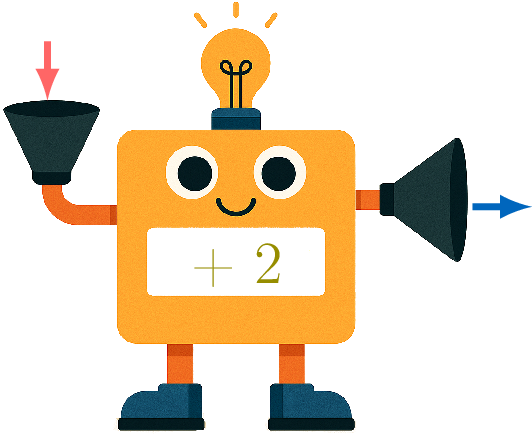
A function is a rule that assigns to each input exactly one output. You can think of a function as a machine: for every input you give it, the machine produces an output according to a specific rule.
Example
- The rule is: \(\textcolor{olive}{\text{add 2}}\).
- The input is: \(\textcolor{colordef}{3}\).
- The output is: \(\textcolor{colordef}{3}\textcolor{olive}{+2} =\textcolor{colorprop}{5}\).
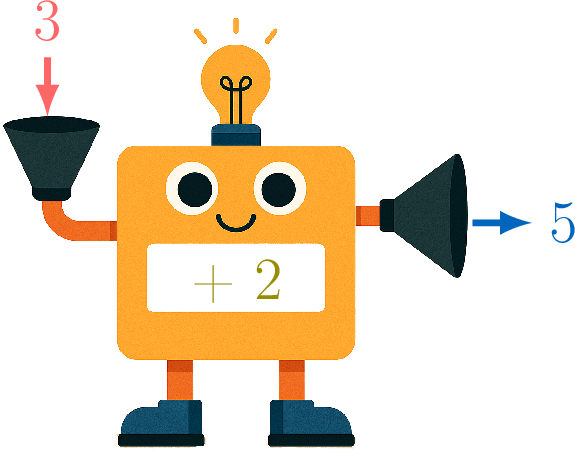
Table of values
Definition Table of values
A table of values is a table that shows several pairs of input and output values for a function.
Example
| Input | 2 | 3 | 4 |
| Output | 4 | 5 | 6 |
Graphs
Definition Graph
A graph of a relation is the set of points \((\textcolor{colordef}{\text{Input}},\textcolor{colorprop}{\text{Output}})\) in a coordinate plane.
Definition Line Graph
A line graph of a relation is the set of points \((\textcolor{colordef}{\text{Input}},\textcolor{colorprop}{\text{Output}})\) connected by straight line segments.
Example
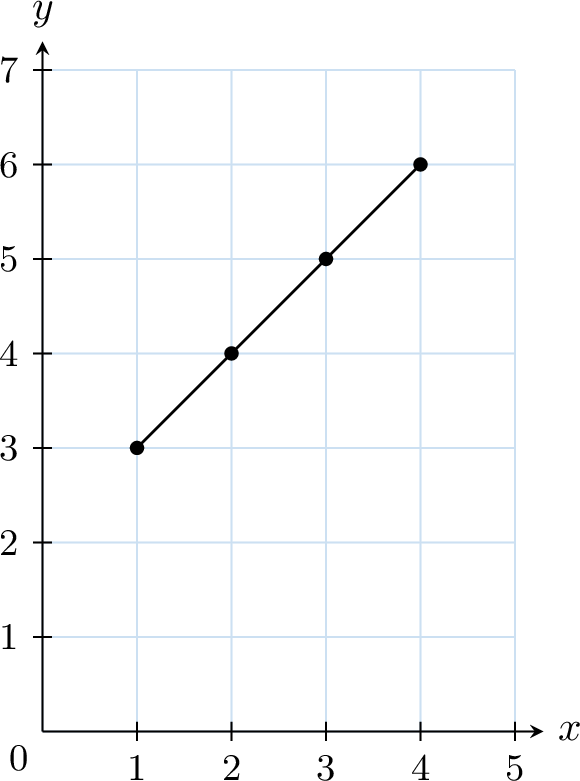
| Input | 1 | 2 | 3 | 4 |
| Output | 3 | 4 | 5 | 6 |
- Plot the points \((1,3)\), \((2,4)\), \((3,5)\), \((4,6)\) on a graph.
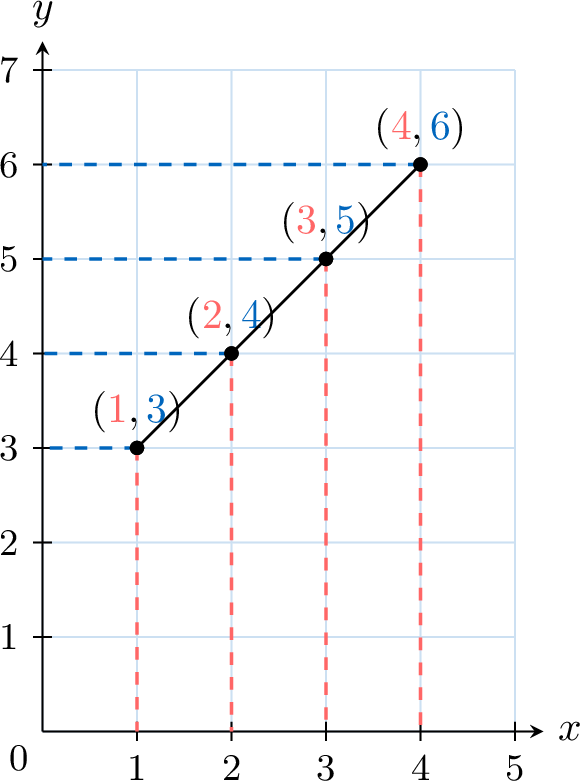
- Connect the points in order with straight line segments to form the line graph.