Statistics
Collecting Data
Definition Data
Data is the information we collect, like numbers, words, measurements, or observations.
Method Making Survey
To do the survey, follow these steps:
- Ask each student your question, like "What is your favorite pet?"
- Write down what each student says. You can:
- Write their name next to their answer (e.g., "Emma: Dog").
- Or use tally bars to count the answers (e.g., draw a tally mark for each "Dog").
Representing Data
Definition Pictograph
A pictograph uses pictures or symbols to show data.
Example
| 5 |  | |||
| 4 |  | | ||
| 3 | | | ||
| 2 | | | | |
| 1 |  | | | |
| Lemon | Orange | Apple | Cherry |
- Lemon: 1 student.
- Orange: 4 students.
- Apple: 5 students.
- Cherry: 2 students.
Definition Bar Chart
A bar chart shows data with bars.
Example
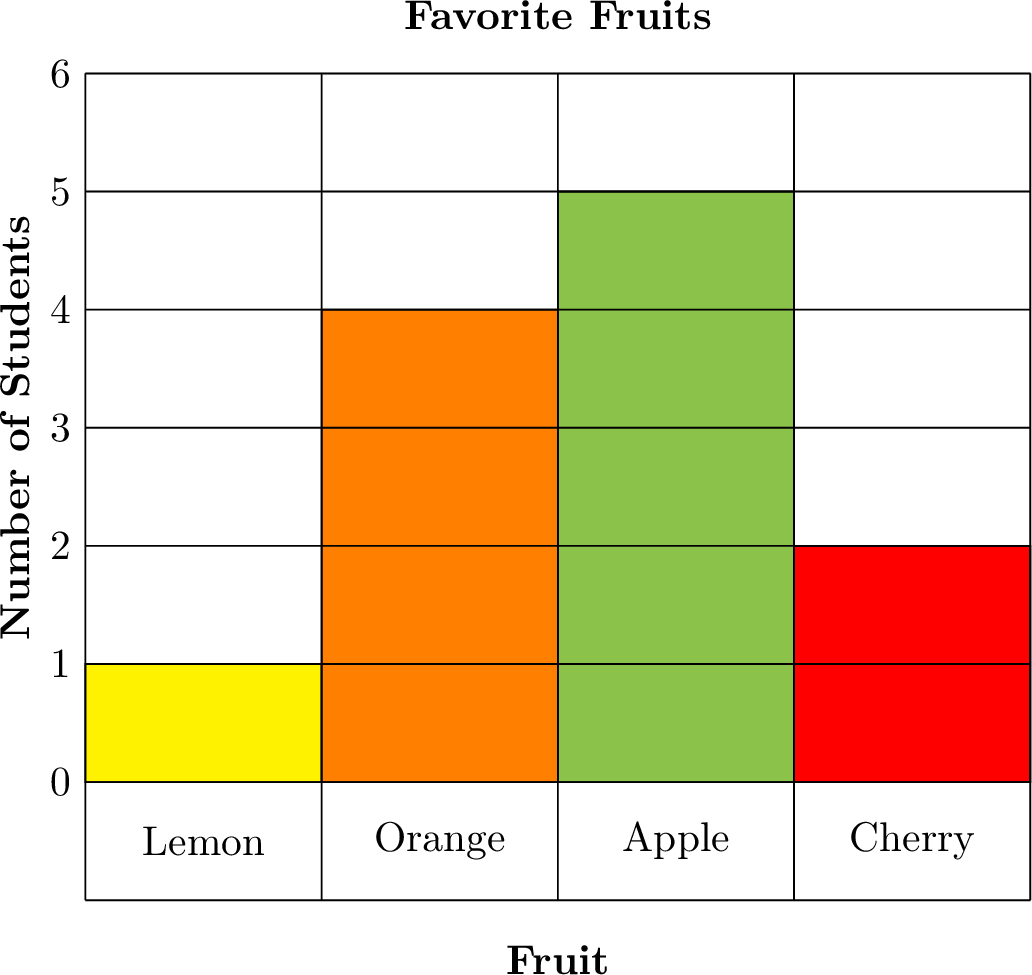
- Lemon: 1 student.
- Orange: 4 students.
- Apple: 5 students.
- Cherry: 2 students.